1
Cost Risk Modeling for Hybrid Power Generation from Geothermal, Biomass Resources and CSP in Turkey - Southeastern Anatolia and Eastern Anatolia Region
1* Yıldırım İsmail Tosun 1
Sirnak University, Faculty of Engineering, Department of Mining Engineering, Sirnak, Turkey * E-mail:[email protected]
Abstract
Crust formed by the heat existing in various depths, hot water containing chemicals, vapors and gases. These resources they contain high amounts of heat energy generated by the formation. To detect thermal energy sources is an issue requiring expertise; geological, geochemical, mineralogical, geological, geophysical surveys are carried out evaluation applied together. Usually hot springs spa and evaluation of district heating Southeastern Anatolia and Eastern Anatolia between 45 ° C and 125 ° C, less dense the population is not economically in the region. Uncertainties are taken into account by adding a contingency factor. This approach is simple and it is advantageous to be close to the real data. However, variable and uncertain application of parametric variables feet makes possible reliable risk analysis. This research has examined various risk models for energy production. The most appropriate model is determined by comparison. Drilling wells reports data were analyzed as a probability function were the main data source for this task but also gives equipment are used. Fed with data obtained by comparing the model results and the actual date has been confirmed.
The overall objective of the geothermal energy is the presence of a geothermal system can be produced economically. Geothermal energy was started exploration in the vast area to be searched, amended as a result of the research data, the field is narrowed down to investigate to direct heating of regional area. At the same time studies in the cost-benefit criterion it has been considered, and thus became the economic research work.
Keywords: risk assessment, stochastic cost estimation, simulation, direct heating simulation
I. Introduction
In the past five years about several deep geothermal wells were drilled in the southern Anatolian region. Some of them planned for geothermal technology, resulting in an advantageous transportation and green energy solutions for industrial project options in future (IEA, 2013). One of the main tasks of geothermal energy consultants also cost planning and risk estimate is for the construction process. These estimates of the total wells to be constructed for energy production facility until construction time and unit cost must be based on risk analysis parameters (Lentsch and Schubert A, 2013).
Uncertainties are taken into account by adding a contingency factor. This approach is simple and it is advantageous to be close to the real data. However, variable and uncertain application of parametric variables feet makes possible reliable risk analysis (Liu, 1997).
Probablistic approach makes easier in use power generation data of geological sources and biomass resources. (IEA, 2007) After the groove of important steps were being taken in this area, so that the control system has come up today in most areas where the application of fuzzy logic (Lin and Lee,1996).
Unlike conventional control systems their clients are, without the need for mathematical models of the system, is only set to give the desired output signal applied to the input, just as a human masters the processing of fuzzy control system similar to control it. So people like fuzzy logic and decisions of machine
operations can be achieved by using fuzzy sets. In the current applications, so smart grid electricity (intelligent) systems began to record a rapid development.
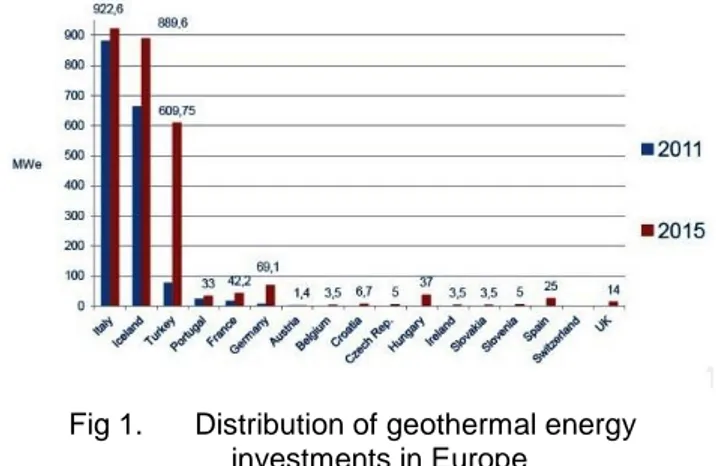
After Italy and Iceland, Turkey ranks third in Europe for the realization of installations and activities in geothermal power plants (Figure 1) (IEA, 2013).
Fig 1. Distribution of geothermal energy investments in Europe
This research has examined various risk models for energy production. The most appropriate model is determined by comparison. Drilling wells reports data were analyzed as a probability function were the main data source for this task but also gives equipment are used. Fed with data obtained by comparing the model results and the actual data have been confirmed. Model data trends observed in the average of approaches were examined and evaluated as a very
well-parametric analysis of costs. It has been expanded by recent model costs. This risk analysis and plant construction, investors can provide insurance companies for risk assessment and decision-makers geothermal wells. Thus, the risk analysis will help in calculating the correct budgeting and insurance premiums.
A. South Eastern and Eastern Anatolian Geothermal Sources
Depending on the volcanic and tectonic activity in Eastern and Southeastern Anatolia there are several geothermal areas to be considered as the direct heating or energy production purposes (MTA,1987); In Van-Ercis field the temperature of the water is the about 70-80°C, in the Diyarbakır-Cermik field the temperature is 51°C, and in the Urfa-Karaali the temperature is 49°C as the shallow reservoirs. Agri-Diyadin (78°C), the Bitlis-Nemrut field (59 °C) are the geothermal hot springs recorded in the Eastern Anatolian Region. The hottest springs recorded in the Southeastern Anatolia is in the south Diyarbakir, Cermik located in the geothermal areas and shallow 115.5 m depth in 51 °C, flow rate of 21 (l/s) used as central heating and pumped for irrigation. A part of water cooled is piped to Dicle University Physical Therapy and Rehabilitation Center for spa facilities and it utilizes warm water. Mardin Germav water supply is 63.5 °C and 15 (l/s) with the flow rate. Hot water from two pools of private management, are used as medicinal water. There are 5 pieces of Siirt Billoris geothermal sources. The temperature of the water from wells 40 - total flow rate is between 55 °C 172-173 (l/s). Sanliurfa Karaali 7 drilling results conducted in geothermal field, 5 wells have passed activities. 39-59 °C and the flow of resources is arasınn 20-40 (l/s) it varies. Batman's Kozluk-Taşlıdere Holi geothermal spa water temperature is 83 °C and in the flow of 16 (l/sec) and is evaluated as thermal springs from the source and greenhouse heating. Geothermal field in the province of Sirnak Güçlükonak field, and flow at 73.5 °C 12 (l / s) is used as the water source in the spa treatment.
II. Capital Investment Cost Risk Modeling A. Geothermal Drilling
Drilling needs feasibility study and performed the last exploration on where the drilling will be opened and greatly followthe data and the data result can be boring, drilling logging index, lost time parameters and the investment needs the processing logging, bore placing and cementing of the well of coatings. Well head, the construction of the heel should be carried out without interruption, depending on the time and depth. The construction of the borehole takes place in two parts with a variety of applications.
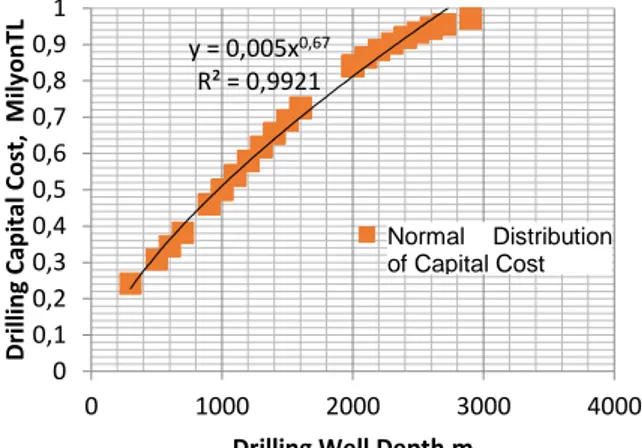
This Figure 2 varies depending on the time and depth as seen in the graph as shown horizontally and the model does not include the waiting time, this linear relationship. As given in Fig 3, the investment cost model vs depth is considered to be time-dependent progression throughout the entire process.
Exponentially increased cost was calculated due to the boring difficulties under 3000m below.
Fig 2. Drilling depth chart and Geothermal Well Investment Risk
Fig 3. Drilling depends on the well depth chart and Normal Distribution curve for Capital Investment
Risk
B. Cost Risk Modelling for Agricultural Biomass Waste Potential of Turkey
Considerable research on coal combustion has been conducted over the years, but the waste combustion results are widely dispersed because of the complex chemistry of waste (TKİ 2009, TTK 2009). Time related coal combustion modeling assumes basically first-order kinetic equations, or less sensitive for heating rate (Bell et al, 2011, Kajitani et al 2011). It is basically depend on the coal properties but also cover to some extent, the effect of heat-and-mass transfer phenomena (Jess et al,2010, Schultz et al, 2011). Fluidized bed combustion is preferred for clean emissions in the unit (EIA, 2007). The clean emission from biowaste and coal co-combustion could be managed in NOx and SOx due to low combustion temperature (Fig 4). The potential biowastes projected in Southeastern Anatolian region was
y = 0,6482e0,0007x R² = 0,9023 0 0,5 1 1,5 2 2,5 3 3,5 4 4,5 5 0 1000 2000 3000 4000 D ri lli n g C ap ital C o st, M ill io n TL
Drilling Well Depth,m Yatırım Maliyeti y = 0,005x0,67 R² = 0,9921 0 0,1 0,2 0,3 0,4 0,5 0,6 0,7 0,8 0,9 1 0 1000 2000 3000 4000 D ri lli n g C ap ital C o st, M ily o n TL
Drilling Well Depth,m NormalDağılım Capital Cost
Normal Distribution of Capital Cost
3 mainly the maize slush and animal manure, the digested biowaste. The proximate analysis and calorific values are given in Table 1.
Fig 4. Fluidized Bed Combustion of Coal and Biomass for power generation.
Tab 1. Combustible bio-waste proximate analysis Weight(%) Wood Waste Trash Cow Waste Poultry Waste Corn Waste Moisture 41.26 29.26 24.2 21.6 10.26 Ash 1.07 9.7 4.25 3.34 1.07 Fixed Carbon 25.08 25.08 25.08 25.08 45.08 Volatile Matter 74.59 74.59 64.59 64.59 54.59 Calorific Value (kcal/kg) 1430.1 1630.5 1760.8 1930.2 3780.2
The calorific values of bio wastes changed with the moisture content of the waste type. The most proposed bio waste was the corn waste, having a calorific value of 3780kcal/kg.
III. Projected Results and Discussion
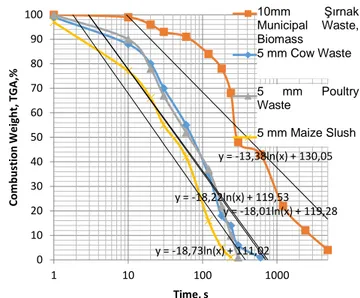
50 g samples were dried waste is subjected to combustion in the laboratory TGA analysis. The test results are shown in Figure 7. In Figure 7, the reactor temperature above 900 °C with respect to the amount of combustion is after pyrolysis. This increase in the burning rate of Sirnak landfill waste 28%/min cow pulp 52%/min and chicken waste at 53%/min in the corn stalks were 68%/min. Burning fuel as coal dust and combustion kinetics of Şırnak asphaltites used 10% sample weight ratio of the mixture is reduced by 25%. The combustion experiments stoker boiler is used for and obtained similar results.
Biomass waste and coal types are co fired in stoker or fluidized bed at 900°C and toxic gas emissions are secondly fired inthe secondary chamber by gas at 1000 °C and even alkali matter are added into the combustion chamber (Fig 4). While the lime addition
into the chamber at weight rate of 10% at 850 °C combustion rate values are shown in Fig 5.
Fig 5. TGA combustion weight of Biowaste types and combustion rate change.
Alfa Makine offered semi-mobile municipal waste incinerator for electricity regarding even the biowastes as shown in Fig 6.
Fig 6. Integrated CSP and mobile Biowaste and biogas combustion units and ORC power
generation.
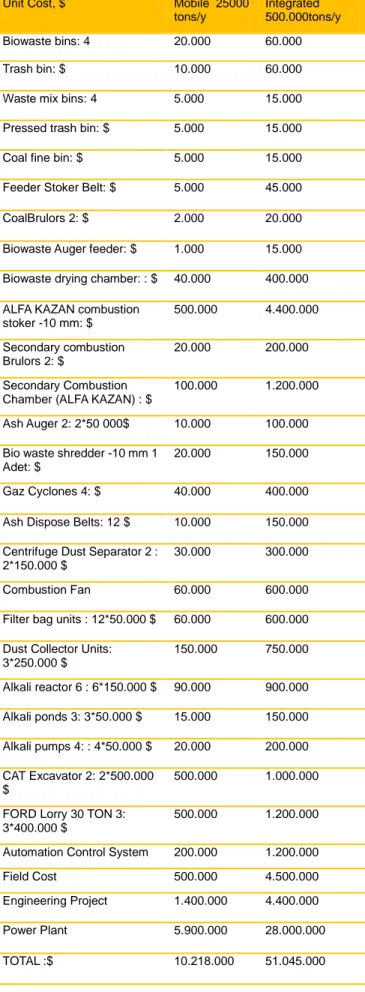
The capital cost values of units in waste combustion and power plant for both mobile plant at the capacity of 25.000 tons/year and the integrated plant at the capacity of 500.000 tons/year are determined by firm's offer and calculations. The cost values of combustion and power plant are given below Tab 2. y = -13,38ln(x) + 130,05 y = -18,01ln(x) + 119,28 y = -18,22ln(x) + 119,53 y = -18,73ln(x) + 111,02 0 10 20 30 40 50 60 70 80 90 100 1 10 100 1000 C om bus ti on W e ig ht , TGA ,% Time, s 10 mm Şırnak ÇöpBiyoKütle 5 mm Sığır Küspe 5 mm Tavuk Küspe Mısır Sapı 10mm Şırnak Municipal Waste, Biomass 5 mm Cow Waste 5 mm Poultry Waste 5 mm Maize Slush
Tab 2. The Capital costs of Mobile and Integrated Biogas power generation
Unit Cost, $ Mobile 25000 tons/y
Integrated 500.000tons/y Biowaste bins: 4 20.000 60.000
Trash bin: $ 10.000 60.000
Waste mix bins: 4 5.000 15.000 Pressed trash bin: $ 5.000 15.000
Coal fine bin: $ 5.000 15.000
Feeder Stoker Belt: $ 5.000 45.000
CoalBrulors 2: $ 2.000 20.000
Biowaste Auger feeder: $ 1.000 15.000 Biowaste drying chamber: : $ 40.000 400.000 ALFA KAZAN combustion
stoker -10 mm: $ 500.000 4.400.000 Secondary combustion Brulors 2: $ 20.000 200.000 Secondary Combustion Chamber (ALFA KAZAN) : $
100.000 1.200.000
Ash Auger 2: 2*50 000$ 10.000 100.000 Bio waste shredder -10 mm 1
Adet: $
20.000 150.000
Gaz Cyclones 4: $ 40.000 400.000 Ash Dispose Belts: 12 $ 10.000 150.000 Centrifuge Dust Separator 2 :
2*150.000 $
30.000 300.000
Combustion Fan 60.000 600.000
Filter bag units : 12*50.000 $ 60.000 600.000 Dust Collector Units:
3*250.000 $ 150.000 750.000 Alkali reactor 6 : 6*150.000 $ 90.000 900.000 Alkali ponds 3: 3*50.000 $ 15.000 150.000 Alkali pumps 4: : 4*50.000 $ 20.000 200.000 CAT Excavator 2: 2*500.000 $ 500.000 1.000.000
FORD Lorry 30 TON 3: 3*400.000 $
500.000 1.200.000
Automation Control System 200.000 1.200.000
Field Cost 500.000 4.500.000
Engineering Project 1.400.000 4.400.000
Power Plant 5.900.000 28.000.000
TOTAL :$ 10.218.000 51.045.000
For Integrated facility the capital investment cost of
500 thousand tons/year capacity was 51 million$, while 1 million tons/year capacity for exit doubled. Already region for high-capacity incinerators are not considered due to the impossibility of obtaining funds is not feasible. For mobile 25000 tons/year capacity plant, depending on the companies' unit costs was determined as 10 million$ (as given in Table 2). Mobile plant and integrated plant operating costs were calculated based on the present prices. As Table 2 also given mobile plant labor, it will provide advantages in terms of reactive maintenance. Mobile plant operating cost approximately 25 TL/ton is defined as garbage. This integrated facility cost rose to 63TL/ton with landfills.
Mobile plant and integrated plant operating costs and energy production (70% and 60% thermal efficiency fuel efficiency) was calculated to be connected. mobile plant as given in Figure 7, while in a period of their capital investment in 22 months, after a period of 36 months will generate more revenue for the integrated plant operating costs will be advantageous investment capital back to paying (Figure 7).
Fig 7. Change of the capital Cost and Revenue of Mobile/Integrated Biomass Power Plant vs month.
IV. Investment Risk Modeling of Power Generation from Geothermal and Biomass Model data trends observed in the average of approaches were examined and evaluated as a very well-parametric analysis of costs. It has been expanded by recent model costs. This risk analysis and plant construction, investors can provide insurance companies for risk assessment and decision-makers geothermal wells. Thus, the risk analysis will help in calculating the correct budgeting and insurance premiums. The installed capacity of the planned plant was about 2 million kWh/year and flow rate of water in the entire unit in energy production
0 20000000 40000000 60000000 80000000 100000000 120000000 140000000 160000000 180000000 200000000 0 20 40 60 Cap ital Co st, R e ve n u e o f B io Pow e r Pl an t .TL Month Total Revenue Total Profit Capital Cost
5 was 220 l/s. Drilling cost risk values calculated regarding 4 well drills at averagely different rock types and depths are given in Table 3.
The cost calculation of the plant,
Calculation of unit cost of the facility, Calculation of the investment costs of the
facility at which it will go into production, Plant operating costs and the calculation
of the annual income,
is the total cost, is tax, F is the interest, is maintanance cost, D is share rate, cm is capacity factor, K is the unit capacity. As given below;
(1)
(2)
The cost need to be calculated in three stages. (3) (4) (5) (6)
where R is the revenue, Q is the capacity, P is the sale price, r is the interest rate, m is month, n is the integer of month, E is investment cost, f is debt rate, cm is capacity factor, L is the debt, u cost function, t is time, is the hybrid unit parameter.
Gaussian normal distribution of risk probability values defines the value of the investment in data-intensive midpoint. Drilling cost estimation is obtained as given by the following equation (Table 3).
(7)
Tab 3. Correlation and variable values in Drilling depth with the cost of investment. RİSK Point Weak Rock s Mid Rock Hard Rock 500m 1500 m 2500 m Depth,m 1 3 6 1 4 8 Advance Rate 0.071 0.21 0.71 0.71 0.11 0.071 Drilling Period 12 59 112 42 122 333 Investment s 121 145 223 222 678 2311 Risk 1 3 6 1 4 8 Risk Error −0.26 6 -0.24 5 -0.29 8 -0.21 3 -0.344 -0.41 Correlation Coefficient −0.26 6 -0.14 -0.57 -0.25 6 -0.679 -0.053
The ORC plant has planned for hybrid parallel power generation, so that every units may not decrease enthalpy yields in series generation, using geothermal, biomass and biogas combustion and CSP solar units. The system basicly is shown in Fig 8. Especially low heat sources may not be feasible in power generation, but hybrid parallel operation shoul be advantageous in the Southeastern Anatolian region. The projected Batman and Siirt case plants were considered regarding the potentials of biomass/CSP and geothermal sources/CSP, and the ORC proposed plant parameters using hot oil (or R112 liquids) are given in Table 4.
For Batman and Siirt case potentials of biomass/CSP and geothermal sources/CSP, the cost values of proposed 35 MW hybrid power plants are given in Table 5.
Fig 8. ORC Use for Low Heat Geothermal and Biomass sources in energy and risks of Capital Investment costs in Turkey
Tab 4. The planned values of the variables of projected Organic Rankine Cycle for the Batman and Siirt Geothermal and Biomass energy sources
Organic Rankine Cycle Variables Batman
Geothermal Siirt Geothermal Batman Biomass Siirt Biomass
Geothermal hot water temperature, oC 120 oC 95 oC 135 oC 145 oC
Geothermal hot water flow rate in kg / s 100 130 230 230
Organic condenser exit temperature, 92 oC 74 oC 92 oC 94 oC
Organic mass flow rate kg / s 33 25 33 25
Organic return rate, kg/saat,% 33 25 33 25
Mass flow rate of water consumption kg/h 13 12 13 12
Organic Turbine Output pressure drop,bar 13 11 14 14
Power conversion efficiency,net h 37 36 39 39
Condenser total energy MWh 2 1 5 5
Power cycle / TES pump power MWh 1 1 1 1
Gross electricity production MWh 130 120 430 460
Net Electricity production MWh 110 103 110 103
Organic Thermal Power Generation MWh 300 250 300 250
Thermal Power Generation MWH 110 103 110 103
Total pipe heat loss MWh 7 5 7 5
Return cold geothermal waste heat loss MWh 11 12 11 12
Organic spin cycle heat loss MWh 200 140 200 140
Total Thermal Loss MWh 211 150 211 150
External heat consumption MWh 5 19 5 19
Tab 5. Organic Rankine Cycle Variables for Geothermal and Biomass energy capital cost risk Projected Cost
and Revenues
Batman Geothermal
Siirt Geothermal Batman
Biomass
Siirt Biomass Cost
Risk Batman Cost Risk Siirt Net Electricity kWh 137,000,000 132,000,000 137,000,000 132,000,000 4 4 Average Annual Sale TL 0,26 0,26 0,26 0,26 5 5 Production Cost nominal 0,21 0,21 0,21 0,21 5 5 Production Cost actual 0,11 0,11 0,11 0,11 4 4 Return rate ,% 36 33 36 33 3 3 Annual Net Profit 22,000,000.TL 21,000,000.TL 22,000,000.TL 21,000,000.TL 3 3 Calculated Sale price change,% 14 14 14 14 3 3 Calculated debt rate,% 22 21 22 21 2 2 Capacity factor 1 1 1 1 2 2 Land cost 1,6 1,6 1,6 1,6 2 2 System performance factor 21 19 21 19 3 3
Toatal field, acre 4 4 4 4 1 1
Cogeneration Sellective Sellective Sellective Sellective 1 1
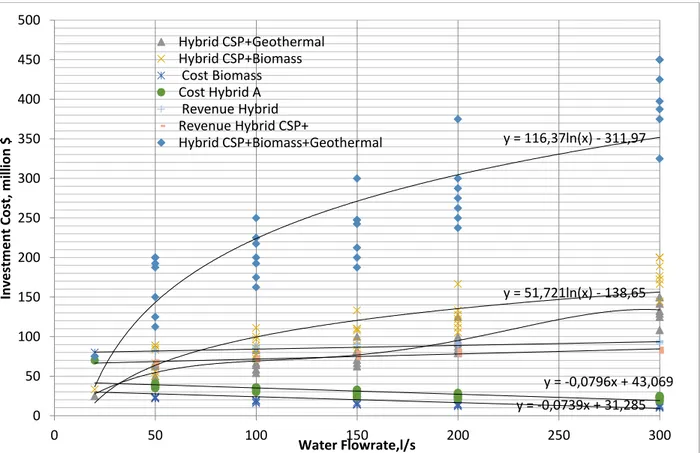
7 Reservoir characteristics of low heat geothermal resources provided over 6 point in risk analysis, the presence of hybrid biomass and biogas combustion became a great support in power generation even waste sources evaluated. However, the hybrid power plants need more capital and complex power generation units due to heat recovery and absorption; so that specific oils or liquids high heat conductive materials are preferred. Aditionally, possible heat sources, storing, availability of these resources and logistics, price should be determined prior to parametric cost analysis. Assessment made after the Table 5 investment cost values and energy revenue and energy cost analysis vs steam flowrate are shown in Fig 9 for hybrid plants. Cost values per electricity kwh increased with CSP hybrid plants over 2$/kwh with probability approach, and the best approach cost risk analysis hybrid plant returns in 90 months are very critical in terms of interest rates and taxes. The use of the ORC unit outcomes high cost of energy production and increase the capital cost of every hybrid unit.
V. Conclusions
Reservoir characteristics of geothermal resources in addition risk analysis, the presence of natural mineral waters, the investigation of possible heat sources, development, protection, to be eligible on these resources and rights transfer, are discussed in parametric cost analysis management in the most efficient manner compatible with the environment. Assessment made after the necessary cost risk
analysis (the number of wells, depths, locations determined costs may be produced suitable ORC power with geophysical work. Cost parameters probability approach, Gaussian, Markovian, and the best approach cost risk analysis are discussed. The use of the ORC unit outcomes high cost of energy production and increase the risk of opening the analysis of deep drilling. In addition, it is another parameter that increases the cost of the environmental risk of water contamination.
Benefaction from biowastes in the various parametric combustion systems, in order to receive clean energy and higher enthalpy yield could be generated in low temperature combustion. It is also advised that the high amount of formation of flue gas will be managed at higher combustion temperatures over 700 oC and extracts more environmental friendly gaseous products. Biomass combustion carried out with Şırnak asphaltite in 30mm size distribution showed sufficient enthalpy yields from corn biowaste between to 700-800 oC and even other type of biowastes showed similar trend, the higher enthalpy yields of 54-67 % at lower combustion temperatures.
In the research works production of clean energy with the design of the addition of high-quality coal biowaste mixtures are processed and biomass fuels could be an alternative clean fuel sources. Clean energy sources may be supplied in South East Anatolian region in Turkey. Hence, those clean alternative resources will further enhance the industrial development in the region.
Fig 9. The capital investment for ORC Use for Low Heat Geothermal and Biomass sources in energy and cost risks of Hybrid power plant in Turkey
y = 51,721ln(x) - 138,65 y = -0,0739x + 31,285 y = -0,0796x + 43,069 y = 116,37ln(x) - 311,97 0 50 100 150 200 250 300 350 400 450 500 0 50 100 150 200 250 300 In ve stm e n t Co st, m ill io n $ Water Flowrate,l/s Hybrid CSP+Geothermal Hybrid CSP+Biomass Cost Biomass Cost Hybrid A Revenue Hybrid Revenue Hybrid CSP+ Hybrid CSP+Biomass+Geothermal
References
Akpınar, N , Şen, M, Kentsel katı atıklardan enerji üretimi, Enerji Enstitüsü
Anonymous a, 2015, Mobile incinerators,
http://www.incinerators-ati.com/mobile-incinerator.php, ATİ Şirketi
Anonymous b, 2015, Yakma Kazanları, http://www.alfakazan.com.tr, Alfa Kazan ve Makine AŞ,Ankara
Anonymous c, 2015, Kalina Cycle, http://www.imparator enerji.com.tr, İmparator Enerji, GeoPower, İstanbul
Anonymous d, 2015, Akışkan Yataklı Yakma Kazanı, http://www.mimsan.com.tr, Mimsan A.Ş. , İstanbul
Anonymous e, 2015,http://www.atlasinc.dk/
Anonymous f, 2015,http://www.santes.com.tr/
Anonymous g, 2015, http://www.ottusa.com/mobile_ systems/ mobile_systems.htm
Bell D.A. Towler B.F., Fan M., 2011, Coal Gasification and Applications, ISBN: 978-0-8155-2049-8, Elsevier Inc., Oxford
Cherubini, F. Bargigli, S. Ulgiati, S. 2009, Life cycle assessment (LCA) of waste management strategies: landfilling, sorting plant and incineration, Energy, 34, pp. 2116–2123
Çakal, G.Ö. H. Yücel, A.G. Gürüz, 2007, Physical and chemical properties of selected Turkish lignites and their pyrolysis and gasification rates determined by thermogravimetric analysis, Journal of Analytical and Applied Pyrolysis, Volume 80, Issue 1, 262–268
Donskoi, E.& McElwain, D.L.S., 1999, Approximate modelling of coal pyrolysis, Fuel, 78 , pp. 825–835
IEA, 2007, IEA Coal Research Ltd, Clean Coal Technology Report, ( A.J. Minchener and J.T. McMullan)
IEA, 2012, World Energy Outlook
Jess A, Andresen A-K. Influence of mass transfer on thermogravimetric analysis of combustion and gasification reactivity of coke. Fuel.; 2009. doi:10.1016/j.fuel 2009.09.002 Kajitani S, Suzuki N, Ashizawa M, et al. CO2 gasification rate analysis of coal char in entrained flow coal gasifier. Fuel. 2006;85:163-169.
Kajitani S, Suzuki N, Ashizawa M, et al. CO2 gasification rate analysis of coal char in entrained flow coal gasifier. Fuel. 2006;85:163-169.
Karakaya, İ.,2008, İstanbul için stratejik kentsel katı atık Yönetimi yaklaşımı, Yüksek LisansTezi , İTÜ FBE Çevre Müh.Böl.
Kreith, F Tchobanoglous, G 2002, Handbook of Solid Waste Management
Lentsch D, Schubert A, , 2013 "Risk Assesmment for Geothermal Wells- A probabilistic Approach to Time and Cost Estimation CRC Transactions, Vol 37, p 971-977 Lin C.T. and Lee, C.S.G., 1996 “Neural Fuzzy Systems: A
Neuro-Fuzzy Synergism to Intelligent Systems”, Prentice
Hall
Liu, C., 1997 “Intelligent system applications to power systems”, IEEE Computer Applications in Power, Vol.10, No.4, pp. 21-24, October.
Liu, G., Benyon, P., Benfell, K.E., Bryant, G.W., Tate, A.G., Boyd R.K., 2002, The porous structure of bituminous coal chars and its influence on combustion and gasification under chemically-controlled conditions, Fuel, 79, pp. 617–626
Mahmoudi, S.. Gholamian, E. Zare V, 2015, Exergy analysis of a new configuration of trigeneration system based on biomass gasifier, ECRES2015, Antalya
Richard A. Denison, John Ruston, 1990, Recycling and Incineration: Evaluating the Choices
Ron Isaacson, 1990, Methane from Community Wastes (Elsevier Applied Biotechnology Series)
Schora F.B., 1967, Fuel Gasification, 152nd Meeting of American Chemical Society, New York
Schurtz R, Fletcher TH. Pyrolysis and gasification of a sub-bituminous coal at high heating rates, 26th Annual Int Pittsburgh Coal Conf, Sept. 20-23, 2009.
Shadle LJ, Monazam ER, Swanson ML. Coal gasification in a transport reactor. Ind Eng Chem Res. 2001;40:2782-2792 Shadle LJ, Monazam ER, Swanson ML. Coal gasification in a transport reactor. Ind Eng Chem Res. 2001;40:2782-2792 Sharma A, Saito I, Takanohashi T. Catalytic steam gasification reactivity of hypercoals produced from different rank of coals at 600-775 oC. Energy & Fuels. 2008;22:3561-3565.
TAM, 2014,Tarım ve Köy İşleri Bakanlığı İstatistikleri, http://www.tarim.gov.tr
TEFM, 2008, Orman biyokütlesinden yakıt ve enerji üretimi, (Kahveci, O) TC. Çevre ve Orman Bakanlığı Orman genel müdürlüğü http://www.ogm.gov.tr
TEFM, 2009, Orman Genel Müdürlüğü’nde Biyoenerji Konusunda Yapılan Çalışmalar, Orman Genel Müdürlüğü, Biyoenerji Çalışma Grubu, Orman ve Enerji, Ankara, www.ogm.gov.tr
TKI, 2009, The Turkish Ministry of Energy, Energy, Dept., Lignite Coal Report
Tosun YI , 2012, Semi-fused Salt-Caustic Mixture Leaching of Turkish Lignites - Sorel Cement Use for Desulfurization, Proeedings of XIIIth International Mieral Processing Symposium, Bodrum, Turkey.
Tosun YI , 2012, Semi-fused Salt-Caustic Mixture Leaching of Turkish Lignites - Sorel Cement Use for Desulfurization, Proeedings of XIIIth International Mieral Processing Symposium, Bodrum, Turkey.
TSI,2014, Türkiye İstatistik Kurumu Verileri, 2014, http://www,tuik.gov.tr
TTK, 2009, The Turkish Ministry of Energy, Energy, Dept., Hard Coal Report
Wei-Biao F., Quing-Hua, W. 2001, A general relationship between the kinetic parameters for the gasification of coal chars with CO2 and coal type, Fuel Processing Technology, 72, pp. 63–77
Wiktorsson L.P., W. Wanzl, 2000, Kinetic parameters for coal pyrolysis at low and high heating rates—a comparison of data from different laboratory equipment, Fuel, 79 , pp. 701–716