Full Terms & Conditions of access and use can be found at
http://www.tandfonline.com/action/journalInformation?journalCode=mree20
Download by: [Bilkent University] Date: 04 October 2017, At: 00:37
ISSN: 1540-496X (Print) 1558-0938 (Online) Journal homepage: http://www.tandfonline.com/loi/mree20
Football and the Risk-Return Relationship for a
Stock Market: Borsa Istanbul
M. Hakan Berument , Nildag Basak Ceylan & Bahar Onar
To cite this article: M. Hakan Berument , Nildag Basak Ceylan & Bahar Onar (2013) Football and the Risk-Return Relationship for a Stock Market: Borsa Istanbul, Emerging Markets Finance and Trade, 49:2, 19-30
To link to this article: http://dx.doi.org/10.2753/REE1540-496X490202
Published online: 07 Dec 2014.
Submit your article to this journal
Article views: 60
View related articles
Emerging Markets Finance & Trade / March–April 2013, Vol. 49, No. 2, pp. 19–30.
© 2013 M.E. Sharpe, Inc. All rights reserved. Permissions: www.copyright.com ISSN 1540–496X (print) /ISSN 1558–0938 (online)
DOI: 10.2753/REE1540-496X490202
Stock Market: Borsa Istanbul
M. Hakan Berument, Nildag Basak Ceylan, and Bahar Onar
ABSTRACT: We hypothesize that results of football (soccer) teams affect the risk perception
of people. People choose riskier investments after a win and less risky investments after a loss; this leads to higher (lower) returns in the stock market. These hypotheses are tested for the international matches of Turkey’s three most popular teams (Bes*iktas*, Fenerbahçe, and Galatasaray). The empirical findings suggests that the teams’ wins led to higher asset returns and lower risk aversion on the following business day of the Borsa Istanbul and lower returns and higher risk aversion after a loss or a tie.
KEY WORDS: behavioral finance, football, psychology, stock market returns.
How behavioral attributes affect decision making is widely discussed in the literature. There is a set of evidence that broad-level mood-altering phenomena (such as hours of sunshine, changes in sleeping patterns, and outcomes of sports events) can affect eco-nomic and financial variables (such as industrial production, lottery ticket purchases, exchange rates, and stock market performance).1 Based on psychological evidence of
the role of individuals’ emotional states during decision making, various finance stud-ies incorporate investors’ feelings as inputs to financial decision-making processes. In particular, evidence regarding the effects of sports events (wins/losses) on stock market returns has been established at the national and international levels (Berument et al. 2006a; Edmans et al. 2007). This paper builds on a recent study by Edmans et al. (2007) that used the results of sporting events as an indicator of financial investors’ emotional states.2 Employing results in football (soccer) games as the measure of emotion, we
con-sider their possible effects on stock market returns. In this paper, in addition to concon-sider- ing wins and losses on stock market returns, following Garrett et al. (2005), we consider the possible effects of football supporters’ emotions on their risk perception and incorporate this information into the risk-return relationship. None of the existing studies (1) looks at the effects of wins, ties, and losses simultaneously on stock market returns, (2) accounts for the role of risk when assessing the role of sporting events on stock market return (except for Berument et al. 2006a), or (3) considers the possible effects of sporting event results on investors’ risk perceptions or on the risk-return relationship. Rather, all the existing studies on sports events assess the effect of these events on stock market returns on an ad hoc basis. This study explicitly incorporates the role of risk, assesses the role of risk measure in a return equation, and shows that
M. Hakan Berument ([email protected]) is a professor in the Department of Economics at Bilkent University, Ankara, Turkey, and a research fellow at the Economic Research Forum in Cairo, Egypt. Nildag Basak Ceylan ([email protected]) is an associate professor of finance in the Department of Banking and Finance at Yildirim Beyazit University, Ankara, Turkey. Bahar Onar ([email protected]) is an instructor in the Department of Economics at Bilkent University, Ankara, Turkey. The authors thank Rana Nelson and the anonymous referee for valuable comments.
the risk-return relation (risk perception) is the mechanism that affects stock market returns of a win (loss).
The outcomes of international sporting competitions can serve as good proxies for investors’ moods. It has been shown that the results of sporting events unambiguously affect fans’ moods and their decision-making processes. Fans’ moods and self-esteem are positively correlated with their team’s performances; further, after a win, fans are generally more optimistic about their own future task performances (Hirt et al. 1992). Wann et al. (1994) observed that fans report positive emotions following a win and nega-tive emotions following a loss. Schwarz et al. (1987) and Schweitzer et al. (1992) also reported positive mood changes following a win. In Schwarz et al. (1987), West German men reported higher satisfaction with their lives after the success of their national team in the World Cup playoffs; a tie failed to produce similar results. In Schweitzer et al. (1992), fans of the winning team were found to be less stressed than fans of the losing team concerning a possible war with Iraq and the loss of life that might arise in the case of war. These studies establish the role of football match results as an important factor affecting mood.
Edmans et al. (2007) provided one of the studies that use international sporting suc-cess as the mood variable of financial investors. Gathering evidence from thirty-nine countries, they found that losses in international sporting events (football, cricket, rugby, and basketball) had significant negative effects on daily stock returns, but there was no statistically significant correlation between wins and returns. Berument et al. (2006a) found a positive statistically significant effect of football wins against foreign rivals for Turkey. Ashton et al. (2003) focused on the London Stock Exchange and showed that national football performance affected returns in both directions; wins were associated with positive returns and losses were associated with negative returns. Boyle and Walter (2003) considered the international rugby results of New Zealand but could not find any effect on stock returns in either direction. Football as a proxy for mood and its effects on economic variables other than stock market variables have also been considered in the literature. Pollard (2002) found a strong connection between World Cup success and economic growth of the winning countries. In various studies, Berument and his colleagues found a positive relation between industrial growth and wins in international games (Berument et al. 2003; Berument et al. 2006b; Berument and Yucel 2005). Eker et al. (2007) also found evidence of a favorable win effect on the Turkish exchange rate. The current study, by gathering evidence from psychology, incorporates the role of emo-tions in altering risk perception and explains how the risk-return relaemo-tionship changes after a win or loss.3
To assess the effect of international football matches, we gathered data from Turkey. Football is Turkey’s most popular sport, and it has an almost perfect association with the term “sports” there (Sert 2000). The extensive media coverage devoted to football in Turkey is a good indication of its popularity; football dominates sports news because it attracts audiences and thus increases ratings (Berument and Yucel 2005; Berument et al. 2006b). Although there are more than fifty teams competing in several divisions in Turkey, the most popular and historically most successful teams are the national teams Bes*iktas*, Fenerbahçe, and Galatasaray. In addition to supporting their local teams, Turkish people are usually fans of one of these three big teams, and it can be safely expected that the successes and failures of these teams in international competitions have a considerable effect on the mood of the Turkish people. The effect of football successes can thus be realized across Turkey, and their effect on the stock market can be observed.
Theory
Loewenstein et al. (2001) argued that when faced with uncertainty, individuals weigh objective probabilities subjectively; their emotions at the time of decision making affect their probability weighting function, which then, if people are making decisions about the stock market, affects the returns. Johnson and Tversky (1983) also claimed that mood affects how people judge risks. In two related experiments, they found that after reading sad newspaper articles, individuals reported higher risk estimates and that their willingness to take risks increased after reading a good news article and decreased after reading a bad news article. In a similar study, however, Isen et al. (1988) concluded that while individuals’ risk estimates were more optimistic when they were in a good mood, they became relatively more risk averse to protect their good mood. Shu (2010) showed how investors’ better (worse) moods affected equity prices positively (negatively) within Lucas’s (1978) general equilibrium asset pricing model. He argued that change in the marginal rate of substitution between future and current consumption after a mood change is the main reason for this price change. He noted that misattribution theory in psychol-ogy suggests that people tend to misattribute their feelings when they are in good mood (Schwarz and Clore 1983). For example, people in a good mood stemming from good weather may attribute their feelings to favorable life prospects. Nofsinger (2005) argued that people in a good mood are more willing to invest in riskier assets.
Shu (2010) also noted that evaluating the “true” value of an asset requires a set of complex tasks. Heuristic theory suggests that people take shortcuts when evaluating assets, either by using partial information or by dealing with information in incomplete ways. Forgas (1995) argued that the higher the complexity and the greater the uncertainty of a task, the greater the influence of emotions on decision making. Shu (2010) combined this time-changing preference with good (bad) mood and showed that good (bad) moods are associated with over- (under-)estimating future events and with higher (lower) prices.4
Even if the emotions that arise from wins or losses are observed on an individual level, we assess that affect transfer works on a national scale. It is hard to measure on a national level the effects of wins; however, there is a set of studies that elaborate on how this transcendence could occur. Olson (2006) noted that the collection of individual moods is the social mood. A society might be decomposed to supporters and nonsupport-ers of a winning (losing) team (nonsupportnonsupport-ers constitute people that support other teams or are indifferent to football). If supporters of a team are in a better (worse) mood after a win (loss), they may affect the stock market. For Turkey, 60.9 percent of the popula-tion is supportive of a team, and 89.2 percent of these fans are supportive of one of the three big teams that we incorporate into our analysis: 39.3 percent support Galatasaray, 32.1 percent support Fenerbahçe, and 17.8 percent support Bes*iktas*.5
Data and Methodology
Using the data on international football matches for the three major Turkish football teams (Bes*iktas*, Fenerbahçe, and Galatasaray), this study investigates the effects of football game results on stock returns and investors’ risk perceptions based on the daily returns of the Borsa Istanbul (BIST). We chose these teams because most Turkish people are supporters of one of the teams; thus, supporters are dispersed in every region of Turkey more or less evenly. People who support one of these teams would not support the other two teams, because the competition among the teams is too fierce (see Berument et al. 2009; GENAR 2005).
The data set uses the daily closing prices of the BIST for the period between Decem-ber 28, 1990, and May 31, 2011. Data after DecemDecem-ber 28, 1990, are available, and the sample ends with the last business day of the 2010–11 football season. To measure BIST performance, we use the daily closing prices of the BIST Return Index.6 The series are
obtained from the BIST Web site. Unlike the regular benchmark BIST 100 Index, the BIST 100 Return Index incorporates dividends, splits, and increases in capital. The return series are calculated as the logarithmic first difference of the daily closing prices, that is,
Rt= [log(BISTR100t) − log(BISTR100t−1)] × 100, where BISTR100 is the daily closing
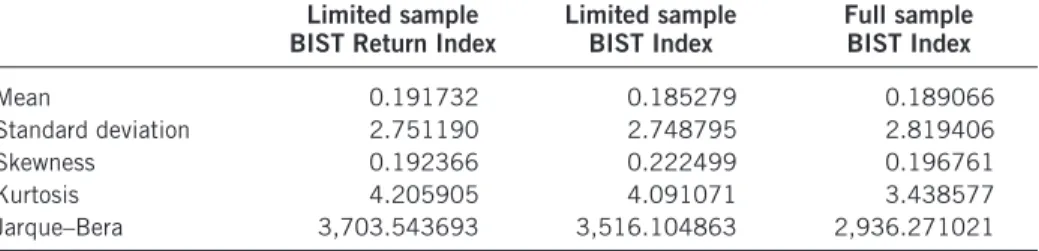
price of the BIST 100 Return Index. We also employ a benchmark BIST 100 Index for the sample period of the BIST 100 Return Index as a second data set. Data after July 3, 1987, are available for the BIST 100 Index; thus, a sample from July 3, 1987, to May 31, 2011, for the BIST 100 Index is used as the third sample. Descriptive statistics on stock market returns measures are provided in Table 1. The negative skewness, a kurtosis greater than 3, and the statistically significant Jarque–Bera test suggest a departure from normal-ity and a time-varying variance for the stock return series that we consider. Here, the level of significance is at 5 percent (unless otherwise specified, the level of significance is taken as 5 percent in the paper).
The data on football game outcomes are obtained from Durupinar (2002), Tanrikulu (2002), and Tuncay (2001), and similarly to Demir and Danis (2011), was updated using information provided on the Turkish daily newspaper Radikal ’s Web site (www.radikal. com.tr). We consider only the effects of international game results on stock market returns and on investors’ risk perceptions. The scores obtained from Turkey’s national league would not be a good proxy for the general mood of investors because a win against a domestic team decreases the morale of the opposing teams’ supporters and thus would have a neutralizing effect. Only a win (loss) against a foreign rival would have a strong increasing (decreasing) effect on the mood of investors. Table 2 reports the three teams’ number of wins, losses, and ties in international matches. These statistics are reported for each day of the week, and the totals are reported across each day of the week, considering two sample periods for the analyses (December 28, 1990, to May 31, 2011, and July 3, 1987, to May 31, 2011). All the games are played after closing time of the BIST, so the earliest the outcomes can be assessed is the next business day, when the analyses are performed. The majority of the games were played on days for which the next calendar day was also the next business day, most games being on Tuesdays, Wednesdays, and Thursdays. Only four games were played when the next day was not a business day: three games were played on a Friday and one game was played on a Saturday. Turkey experienced two financial crises during the period under consideration, one in April 1994 and one in February 2001. To control for the adverse effects of these crises, we added two dummy variables to our model.
Table 1. Descriptive statistics for stock market returns on the Borsa Istanbul
Limited sample
BIST Return Index Limited sample BIST Index Full sample BIST Index
Mean 0.191732 0.185279 0.189066
Standard deviation 2.751190 2.748795 2.819406
Skewness 0.192366 0.222499 0.196761
Kurtosis 4.205905 4.091071 3.438577
Jarque–Bera 3,703.543693 3,516.104863 2,936.271021
To test for the effects of good mood on stock returns and on investors’ risk percep-tions, we employed the following exponential generalized autoregressive conditional heteroskedastic (EGARCH) specification:
Rt = bxt + lht + fw wint+ fl losst+ ft tiet+ jw wint ht+ jl losst ht+ jt tiet ht+ et (1)
logh logh . h E h h t t t t t t t t = + + − + − − − − − − − κ δ 1 γ ε 1 ε χ ε 1 1 1 1 1 (2)
Equation (1) gives the specification for the stock market returns (Rt). xt is a set of exogenous variables including daily dummies, the lagged values of the return variable, and the dummies of the 1994 and 2001 financial crises. The inclusion of the five daily dummies in the return specification is essential to isolate the possible effect of wins, losses, and ties from the well-known day-of-the-week effect that is apparent in stock market returns. The autoregressive terms are included to account for the persistency in returns. Here, wint, losst, and tiet are the dummy variables for the wins, losses, and ties, respectively; since all games are played after the operating hours of the BIST, the dummy variables take a value of one for the first trading day following a win, loss, or tie and a value of zero otherwise. The coefficients of wint, losst, and tiet are of primary interest; the expected coefficient of wint is positive, of losst is negative, and we do not have any prior expectations for tiet (the reason for this will be discussed later). The conditional variance
ht measures the volatility in returns and is generated using the EGARCH specification given in Equation (2). Since there is a risk-return trade-off in the case of risk aversion, we would expect the risk premium parameter l to be positive. Greater risk is endured only for a greater return on investment, that is, if investors hold riskier assets, the returns associated with these assets should be higher.7 The interactive dummy variables of win
t,
losst, and tiet with ht are intended to capture the change in the risk-return relationship after a game. If the good (bad) mood created by the win (loss) causes a decrease (increase) in investors’ risk aversion, then a relatively lower (higher) risk premium can be accepted for the same level of risk following the win (loss) and the coefficient for the interactive term would be negative (positive). The expected sign of the tie coefficient may depend on how a tie is perceived. If it is perceived as a good result, the estimated coefficient of
tiet is positive, but the estimated coefficient of tiet ht is negative. But if a tie is perceived
Table 2. Number of wins, losses, and ties for each day of the week and for the limited and full samples
Limited sample Full sample
Total Win Loss Tie Total Win Loss Tie
Monday 1 1 1 1 Tuesday 85 22 43 20 85 22 43 20 Wednesday 163 67 55 41 182 73 65 44 Thursday 111 49 34 28 112 49 34 29 Friday 3 3 3 3 Saturday 1 1 1 1 Sunday 1 1 1 1 Total 365 144 132 89 385 150 142 93
as bad, then the estimated coefficient of tiet is negative but the estimated coefficient of
tiet ht is positive.8
Analyses
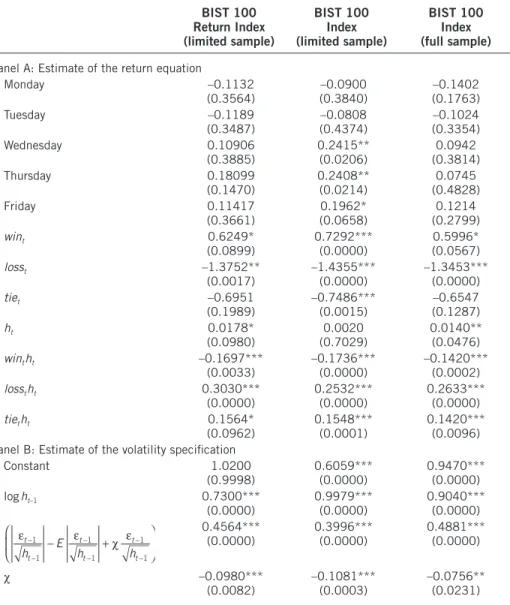
Table 3 reports the estimates of Equations (1) and (2) for the three samples, namely, returns of (1) the BIST 100 Return Index for the limited sample (December 28, 1990, to May 31, 2011), (2) the BIST 100 Index for the same limited sample (December 28, 1990, to May 31, 2011), and (3) the BIST 100 Index for the full sample (July 3, 1987, to May 31, 2011). Here, to save space, we do not report the estimated coefficients for the lag values of the returns or for the crisis dummy variables. We first discuss the evi-dence from the BIST 100 Return Index (column 1 of Table 3). Panel A reports the return specification as given in Equation (1). Note that the estimated coefficient for Mondays and Tuesdays is negative and for Fridays is positive. Next, in order to assess the presence of the day-of-the-week effect, we test whether the estimated coefficients for the daily dummy variables are the same for these five coefficients; the null hypothesis that there is no day-of-the-week effect is rejected.
The effect of wins on stock market returns is captured by the coefficient estimates for the win dummy variable (wint). We observe positive coefficients for wins, which indicates that stock market returns increase after wins. The good mood of investors following wins leads them to value existing assets more; higher prices of assets lead to higher stock market returns. This effect is statistically significant at the 10 percent level. The effect of losses, on the other hand, is negative and statistically significant, which indicates that stock market returns decline after losses. The bad mood of investors after a loss results in their assessing their assets as less valuable, which makes stock market returns lower. Note that the estimated coefficient for a loss is higher than for a win in the absolute sense; this means that agents respond more to a loss than to a win. Last, the estimated coefficient for a tie is negative but not statistically significant. This may suggest that agents are disappointed when a tie occurs and thus stock market returns decrease, but not as much as when a loss occurs.
The coefficient of the conditional variance (ht) is positive and the effect is statistically significant at the 10 percent level. As suggested by mainstream asset pricing models, a premium is needed for risk-averse investors to hold riskier assets, that is, higher returns are associated with riskier assets.
The coefficients for the interactive dummy (wint ht) is negative and statistically sig-nificant at the 1 percent level. This suggests that agents are willing to be compensated by lower returns after a win for bearing the same amount of risk. The coefficients for the interactive dummies (losst ht) and (tiet ht) are positive and statistically significant at the 1 percent level for a loss, and at the 10 percent level for a tie. This suggests that agents are willing to be compensated by higher returns after a loss or a tie for bearing the same amount of risk. Moreover, as in the estimated coefficients for win and loss, for the interactive terms, the estimated coefficient of the loss is higher than the estimated coefficient of the win.
The estimates for the conditional variance as given in Equation (2) are reported in Panel B. The coefficients of interest are statistically significant and have the signs sug-gested by the theory. The positive and statistically significant coefficient for the lagged value of the conditional variance suggests volatility clustering or the existence of high-volatility periods following high high-volatility, and low-high-volatility periods following low
volatility. Since this coefficient has a value smaller than one for all the periods under consideration, the nonexplosiveness of the conditional variance is satisfied. The estimated coefficient for χ is negative and statistically significant, which suggests the presence of asymmetric effects of negative and positive shocks on volatility—often called the leverage effect. A value for this coefficient that is smaller than one in the absolute value suggests that negative shocks increase volatility more than positive shocks.
Column 2 of Table 3 repeats the exercise using the benchmark BIST 100 Index rather than BIST 100 Return Index for the same sample period as in the previous column.
Table 3. The effects of wins and losses on returns and the volatility specification BIST 100 Return Index (limited sample) BIST 100 Index (limited sample) BIST 100 Index (full sample)
Panel A: Estimate of the return equation
Monday –0.1132 (0.3564) –0.0900 (0.3840) –0.1402 (0.1763) Tuesday –0.1189 (0.3487) (0.4374)–0.0808 (0.3354)–0.1024 Wednesday 0.10906 (0.3885) 0.2415**(0.0206) (0.3814)0.0942 Thursday 0.18099 (0.1470) 0.2408**(0.0214) (0.4828)0.0745 Friday 0.11417 (0.3661) (0.0658)0.1962* (0.2799)0.1214 wint 0.6249* (0.0899) 0.7292*** (0.0000) 0.5996* (0.0567) losst –1.3752** (0.0017) –1.4355***(0.0000) –1.3453***(0.0000) tiet –0.6951 (0.1989) –0.7486***(0.0015) (0.1287)–0.6547 ht 0.0178* (0.0980) (0.7029)0.0020 0.0140**(0.0476) wint ht –0.1697*** (0.0033) –0.1736***(0.0000) –0.1420***(0.0002) losst ht 0.3030*** (0.0000) 0.2532*** (0.0000) 0.2633*** (0.0000) tiet ht 0.1564* (0.0962) 0.1548***(0.0001) 0.1420***(0.0096)
Panel B: Estimate of the volatility specification
Constant 1.0200 (0.9998) 0.6059*** (0.0000) 0.9470*** (0.0000) log ht–1 0.7300*** (0.0000) 0.9979***(0.0000) 0.9040***(0.0000) εt ε χ ε t t t t t h E h h − − − − − − − + 1 1 1 1 1 1 0.4564*** (0.0000) 0.3996*** (0.0000) 0.4881*** (0.0000) χ –0.0980*** (0.0082) –0.1081***(0.0003) –0.0756**(0.0231)
Notes: p-values are in parentheses. *** Statistical significance at the 1 percent level; ** statistical significance at the 5 percent level; * statistical significance at the 10 percent level.
Estimates for the win, loss, and tie coefficients and their interactive terms have the same signs as the estimates reported in the column 1, and the level of significance improved, especially for ties. Thus, we claim that the estimates are robust. Column 3 reports the same model by using the BIST 100 Index with a longer time span, beginning on July 3, 1987. The estimates again are robust. The estimates of specifications other than football match results are also parallel to the estimates reported in column 1 on the day-of-the-week effect and the leverage effect. Thus, we claim that the basic conclusion that we gather from column 1 is robust.
Discussion
Empirical evidence for the estimated coefficients of Monday through Friday are in line with the day-of-the-week-effect literature; Monday returns are lower than Friday returns. Moreover, Monday and Tuesday returns are consistently negative, and Wednesday, Thurs-day, and Friday returns are consistently positive. These results are especially similar to those of Balaban (1995) and Berument et al. (2006a), who found similar day-of-the-week patterns for the BIST. We also observe the so-called leverage effect; a negative shock to the stock market increases volatility more than a positive shock. This finding is in line with that of Engle and Ng (1993), Nelson (1991), and Pagan and Schwert (1990). The estimated coefficient for the additive dummy variable for win is positive and for loss and tie is negative. This suggests that good mood boosts morale and is associated with higher returns, and that bad mood decreases morale and is associated with lower returns. These results are parallel to Berument et al. (2006a) and Edmans et al. (2007). These parallel findings for the existing regularities support the validity of our specification. We also perform a battery of robustness statistics (not reported), which seems satisfactory.
Unlike the previous literature that looks at the effect of football results on stock market returns, this study explicitly incorporates a risk to the return equation and also allows the risk-return relation to change with football results; the return equation includes ht and its interactive terms with win, tie, and loss (wint ht , losst ht , and tiet ht ). The estimated coefficients for stock market volatility (ht) are consistently positive in all samples and statistically significant in two out of the three cases at the 10 percent and 5 percent levels. These results support the proposition that domestic investors want to be compensated for bearing riskier positions. The estimated coefficient for (wint ht) is negative and sta-tistically significant. The estimated coefficient for (losst ht) and (tiet ht) are positive and statistically significant. These results clearly suggest that agents become more risk avid after a win and more risk averse after a tie or a loss. Note that a negative coefficient for
tiet and a positive coefficient for (tiet ht) may suggest that the public was expecting a win so a tie was not satisfactory and thus decreased the public’s mood. We also observe that the estimated coefficients for losses are higher than the estimated coefficients for wins in the absolute value for all three samples that we consider, as well as for the additive and interactive terms. This observation means that agents are more sensitive to losses than to wins, which might be explained by the house money theory (Thaler and Johnson 1990). (It is argued that agents will have few “emotional reserves” after a loss to help in tolerating further losses, but that they can “stockpile” a cushion of emotional strength after a gain.)
We also investigate whether the effect of wins, ties, and losses lasts more than a day. When we perform the analysis for the BIST 100 Return Index, it seems that there is a degree of persistency up to three days for wins only; the effects of ties and losses seem
to disappear after one day. The estimates for the other two samples do not reveal whether there is an effect of more than a day after a win, tie, or loss; thus, we cannot conclude that the effect of football results may persist for more than a day. (These statistics and other estimates that are discussed but not reported here to save space are available from the authors upon request.)
Berument et al. (2006a) and this paper use similar data sets, but it may seem that there is a discrepancy between the results. Berument et al. (2006a) could only find the win effect on the BIST for one team: Bes*iktas*. When we include an additive dummy for the three big teams’ wins, we do not find this effect at the 9 percent level. However, in this paper we observe that there is a win effect through a lower return-volatility relationship; the Berument et al. (2006a) paper did not incorporate the effect of wins on the return-volatility relation. Thus, although these two studies use similar data sets, this paper shows that the return-volatility relation decreases after a win due to higher risk tolerance.
Conclusions
Football is considered one of the most important, or possibly the most important, sport in the world. Football results, then, greatly affect the moods of its fans. Mood is a psycho-logical factor that may alter how people perceive a future event or risk. A mood change after a major football game may change how football fans perceive future risks and value existing stock prices. In domestic matches, the mood of the winning team’s fans may improve, but because the mood of the losing team’s fans may deteriorate, these two effects may cancel each other out regarding their net effect on economic and financial variables. For this reason, we consider only international matches of the three most popular Turkish football teams (Bes*iktas*, Fenerbahçe, and Galatasaray) in order to assess how football match results affect stock market performance. Particular attention is paid to how the risk-return relationship (risk perception) changes after a football match after accounting for the effect of football match results exogenously. To assess this effect, we use the daily returns of the BIST for the period between December 28, 1990, and May 31, 2011, within an EGARCH framework. The estimated coefficients for the win dummy variables are positive, and are negative for the loss and tie dummy variables. The estimated coefficients for the interactive terms of wins with the risk measure are negative and for losses and ties are positive, and they are all statistically significant for wins and losses. The last part of the results is important, suggesting that wins affect returns through changes in risk per-ception; it is the decrease in investors’ risk aversion (or the increase in risk appetite) that drives higher stock returns. Similarly, losses and ties increase risk aversion and decrease stock market returns. Thus, this paper provides empirical evidence from Turkey regarding the transmission mechanism, which has hitherto not been explored, about the effects of mood changes on stock market returns via risk tolerance changes. Moreover, this paper reports that losses affect returns more than wins, which is in line with the house money theory, which suggests agents are more sensitive to losses than gains.
The effect of ties on stock market returns is not well documented in the literature; it may depend on whether agents perceive a tie as a success or a failure. The evidence from Turkey suggests that ties have an adverse effect, like losses, on returns. When we model stock market return and volatility, we also end up with estimates that are parallel to existing studies on the day-of-the-week effect on stock market returns as well as the leverage effect on stock market volatility (negative return shocks increase volatility more than positive return shocks). These two effects further support our specifications. All of
the results reported in this section are also robust to an alternative BIST return measure as well as an alternative time period.
Notes
1. See Stracca (2004) for further discussion of this issue.
2. See also Lai et al. (2010) and Luo and Li (2008) on the various effects of investor psychol-ogy on asset returns.
3. There are a limited number of studies that incorporate the role of ties (see Scholtens and Peenstra 2009 and Schwarz et al. 1987; neither could find supporting evidence for whether ties affect mood). For completeness, we also incorporate the role of ties into the model.
4. See Shu (2010) and references cited therein for an excellent theoretical review of this topic. See Stracca (2004) for alternative theoretical explanations from behavioral finance on the effect of mood changes on asset prices and risk perception.
5. See http://spor.milliyet.com.tr/en-cok-taraftar-kimde-/spor/spordetay/18.03.2009/1072522/ default.htm.
6. The official name of the index that we use is the Borsa Istanbul Return Index. We calculate the return of this index (the return of the BIST Return Index), so in order to preempt confusion, we use Return (with an uppercase R) to designate the name of the index, but we use return (lowercase r) to capture the logarithmic first difference of the index.
7. See Enders (2004, pp. 108–143) for the specifications and estimation algorithms of the EGARCH procedure.
8. We did not include win, tie, or loss dummy variables in the variance equation because of the perfect multicollinearity problem.
References
Ashton, J.K.; B. Gerrard; and R. Hudson. 2003. “Economic Impact of National Sporting Suc-cess: Evidence from the London Stock Exchange.” Applied Economics Letters 10, no. 12: 783–785.
Balaban, E. 1995. “Day of the Week Effects: New Evidence from an Emerging Market.” Applied
Economics Letters 2, no. 5: 139–143.
Berument, H., and E. Yucel. 2005. “Long Live Fenerbahce: Production Boosting Effects of Soc-cer in Turkey.” Journal of Economic Psychology 26, no. 6: 842–861.
Berument, H.; N.B. Ceylan; and E. Gozpinar. 2006a. “Performance of Soccer on the Stock Mar-ket: Evidence from Turkey.” Social Science Journal 43, no. 4: 695–699.
Berument, M.H.; N.B. Ceylan; and G. Ogut-Eker. 2009. “Soccer, Stock Returns and Fanaticism: Evidence from Turkey.” Social Science Journal 46, no. 3: 594–600.
Berument, H.; A. Inamlik; and E. Yucel. 2003. “The Effect of Football on Productivity.” Iktisat,
Isletme ve Finans 18, no. 213: 51–62 (in Turkish).
Berument, H.; O. Ince; and E. Yucel. 2006b. “Success in Soccer and Economic Performance: Evidence from Bes*iktas*-Turkey.” International Review of Economics and Business 53, no. 2: 260–274.
Boyle, G., and B. Walter. 2003. “Reflected Glory and Failure: International Sporting Success and the Stock Market.” Applied Financial Economics 13, no. 3: 225–235.
Demir, E., and H. Danis. 2011. “The Effect of Performance of Soccer Clubs on Their Stock Prices: Evidence from Turkey.” Emerging Markets Finance & Trade 47, supp. 4 (September– October): 58–70.
Durupinar, M. 2002. History of Besiktas with Its Legends, Heroes and Numbers. Istanbul: Yapi Kredi Cultural Press (in Turkish).
Edmans, A.; D. Garcia; and Ø. Norli. 2007. “Sport Sentiment and Stock Returns.” Journal of
Finance 62, no. 4: 1967–1998.
Eker, G.; H. Berument; and B. Dogan. 2007. “Football and Exchange Rates: Empirical Support for Behavioral Economics.” Psychological Reports 101, no. 2: 643–654.
Enders, W. 2004. Applied Econometric Time Series, 2d ed. Hoboken, NJ: Wiley.
Engle, R.F., and V.K. Ng. 1993. “Measuring and Testing the Impact of News on Volatility.”
Jour-nal of Finance 48, no. 5: 1749–1778.
Forgas, J.P. 1995. “Mood and Judgment: The Affect Infusion Model, AIM.” Psychological
Bul-letin 117, no. 1: 39–66.
Garrett, I.; M.J. Kamstra; and L.A. Kramer. 2005. “Winter Blues and Time Variation in the Price of Risk.” Journal of Empirical Finance 12, no. 2: 291–316.
GENAR. 2005. “Research of Football Perception in Turkish Society.” Istanbul (available at www.genar.com.tr/files/2004-%20HAZIRAN-turk_toplumunda_furbol_algisi.pdf) (in Turkish).
Hirt, E.R.; G.A. Erickson; C. Kennedy; and D. Zillmann. 1992. “Costs and Benefits of Alle-giance: Changes in Fans’ Self-Ascribed Competencies After Team Victory Versus Defeat.”
Journal of Personality and Social Psychology 63, no. 5: 724–738.
Isen, A.M.; T.E. Nygren; and F.G. Ashby. 1988. “Influence of Positive Affect on the Subjective Utility of Gains and Losses: It Is Just Not Worth the Risk.” Journal of Personality and Social
Psychology 55, no. 5: 710–717.
Johnson, E.J., and A. Tversky. 1983. “Affect, Generalization, and the Perception of Risk.”
Jour-nal of PersoJour-nality and Social Psychology 45, no. 1: 20–31.
Lai, H.-W.; C.-W. Chen; and C.-S. Huang. 2010. “Technical Analysis, Investment Psychol-ogy, and Liquidity Provision: Evidence from the Taiwan Stock Market.” Emerging Markets
Finance & Trade 46, no. 5 (September–October): 18–38.
Loewenstein, G.F.; E.U. Weber; C.K. Hsee; and N. Welch. 2001. “Risk as Feelings.”
Psychologi-cal Bulletin 127, no. 2: 267–286.
Lucas, R. 1978. “Asset Prices in an Exchange Economy.” Econometrica 46, no. 6: 1429–1445. Luo, J.-S., and C.-A. Li. 2008. “Futures Market Sentiment and Institutional Investor Behavior in
the Spot Market: The Emerging Market in Taiwan.” Emerging Markets Finance & Trade 44, no. 2 (March–April): 70–86.
Nelson, D. 1991. “Conditional Heteroskedasticity in Asset Returns: A New Approach.”
Econo-metrica 59, no. 2: 347–370.
Nofsinger, J.R. 2005. “Social Mood and Financial Economics.” Journal of Behavioral Finance 6, no. 3: 144–160.
Olson, K.R. 2006. “A Literature Review of Social Mood.” Journal of Behavioral Finance 7, no. 4: 193–203.
Pagan, A.R., and G.W. Schwert. 1990. “Alternative Models for Conditional Stock Volatilities.”
Journal of Econometrics 45, nos. 1–2: 267–290.
Pollard, P.S. 2002. “Grooowwwth!” International Economic Trends, Federal Reserve Bank of St. Louis, July (available at http://research.stlouisfed.org/publications/aiet/20020701/cover .pdf).
Scholtens, B., and W. Peenstra. 2009. “Scoring on the Stock Exchange? The Effect of Foot-ball Matches on Stock Market Returns: An Event Study.” Applied Economics 41, no. 25: 3231–3237.
Schwarz, N., and G.L. Clore. 1983. “Mood, Misattribution, and Judgments of Well-Being: Informative and Directive Functions of Affective States.” Journal of Personality and Social
Psychology 45, no. 3: 513–523.
Schwarz, N.; F. Strack; D. Kommer; and D. Wagner. 1987. “Soccer, Rooms and the Quality of Your Life: Mood Effects on Judgments of Satisfaction with Life in General and with Specific Domains.” European Journal of Social Psychology 17, no. 1: 69–79.
Schweitzer, K.; D. Zillmann; J.B. Weaver; and E.S. Luttrell. 1992. “Perception of Threatening Events in the Emotional Aftermath of a Televised College Football Game.” Journal of
Broad-casting and Electronic Media 36, no. 1: 75–82.
Sert, M. 2000. Scorer Is Winner: A Sociological View of Soccer. Istanbul: Baglam Yayinlari (in Turkish).
Shu, H.C. 2010. “Investor Mood and Financial Markets.” Journal of Economic Behavior and
Organization 76, no. 2: 267–282.
Stracca, L. 2004. “Behavioral Finance and Asset Prices: Where Do We Stand?” Journal of
Eco-nomic Psychology 25, no. 3: 373–405.
Tanrikulu, A. 2002. History of Fenerbahce with Its Legends, Heroes and Numbers. Istanbul: Yapi Kredi Cultural Press (in Turkish).
Thaler, R.H., and E.J. Johnson. 1990. “Gambling with the House Money and Trying to Break Even: The Effect of Prior Outcomes on Risky Choice.” Management Science 36, no. 6: 643–660.
Tuncay, B. 2001. History of Galatasaray with Its Legends, Heroes and Numbers. Istanbul: Yapi Kredi Cultural Press (in Turkish).
Wann, D.L.; T.J. Dolan; K.K. McGeorge; and J.A. Allison. 1994. “Relationships Between Spectator Identification and Spectators’ Perceptions of Influence, Spectators’ Emotions, and Competition Outcome.” Journal of Sport and Exercise Psychology 16, no. 4: 347–364.
To order reprints, call 1-800-352-2210; outside the United States, call 717-632-3535.