WHY EXTREME UNDERPRICINGS OCCURRED?: EVIDENCE FROM JAPANESE IPO MARKET
Berna Kırkulak*
Abstract
This paper empirically examines the determinants of increase in the first day return of Japanese initial public offerings (IPOs) during 1997-2001 in TSE, Jasdaq, Mothers, Hercules (former Nasdaq Japan) and regional stock exchange markets. Initial return investigation focuses on pre-market conditions during the filing procedures. The findings show that the highest limit stocks are positively correlated with initial returns. The boom of high-tech IPO firms affects pre-market activities and high initial returns make pre-markets competitive for underwriters. Further analysis confirms that shareholders avoid wealth losses by offering few shares due to high underpricing expectations.
JEL Classification: G32; G24
Keywords: Initial Offer Pricing, Underpricing
Öz
Bu çalışma ampirik olarak 1997-2001 tarihleri arasında Japonya’daki TSE, Jasdaq, Mothers, Hercules (önceden Nasdaq Japan) ve yerel sermaye piyasalarında halka arzlarda ilk gün getirilerindeki artışın nedenlerini ampirik olarak incelemektedir. İlk gün getiri incelemesi dosyalandırma dönemindeki ön piyasa koşulları üzerine odaklanmaktadır. Bulgular, ilk getirilerin yüksek limit hisseleri ile pozitif korelasyonlu olduğunu göstermektedir. Yüksek teknolojili IPO firmalarının sayısındaki patlayış ve yüksek getiriler ön piyasaları aracı kurumlar icin rekabetçi yapmaktadır. Daha sonraki analizler göstermektedir ki hissedarlar yüksek getiri beklentilerinden dolayı hisse arzında daha az hisse önererek kazanç kaybını önlemektedirler.
JEL Sınıflandırması: G32; G24
Anahtar Kelimeler: İlk Arz Fiyatlandırması, Düşük Fiyatlandırma
* Dr., Graduate School of Business Administration of Dokuz Eylul University, Tinaztepe Kampusu, Izmir,Turkey, E-mail: [email protected]
I. Introduction
Many researchers have been showing interest to initial public offerings (IPOs), the literature on equity offerings focuses on the determinants of underpricing.1IPO underpricing is incessantly being discussed from several points of views. Theories and empirical studies of initial return emphasize partial price adjustment during the filing procedure. Collected pre-market indications of interest induce revisions in the IPO’s offer price and in the share allocation. Considerations suggest that price revision is directly related to underpricing.
A concern in the price adjustment is the informative role of the book-building. In particular, shareholders concern about the price revisions and those with high underpricing expectations intend to sell few shares. Selling behavior of shareholders is not only related to price revisions in the offer price range but also related to the characteristics of the issuing firms such as; age, management structure, financial strength. A decline in the number of new shares offered relative to pre-IPO shares is associated with shareholders’ expectations to avoid wealth losses in the secondary and primary shares.
This paper contributes to IPO literature on the Japanese IPO market in two ways. First, the current study provides an evidence of bubble underpricing by investigating the industries, offer price range and pre-IPOs’ accounting information in several exchange markets including TSE, Jasdaq, Mothers, Hercules and regional stock markets.2 Studying new markets, Mothers and Hercules, enables us to understand high underpricing. The reason is that most of the high-tech firms preferred going public on recently established stock markets due to reduced listing requirements. The sample consists of hybrid IPOs; auction and book-building. The early literature in the Japanese IPO market focuses on auction regime. An additional advantage of the time period used in this study is that the majority of sample is collected from book-building IPOs (almost 90%). This feature gives further insight into offer price position. Although this has been widely studied in the U.S., there is not much study addressing this issue due to regulations. Therefore, this empirical study fills this gap and shows that offer price position has a significant effect on underpricing in the Japanese IPO market. Second, this paper investigates IPO returns for each industry and shows how heavily underpriced IPOs shifted to IT stocks.
The organization of the paper is as follows: Section II provides literature review, followed by Section III which explains the data used in the empirical study. Subsequently Section IV explains the variables and the model used. Section V shows the empirical findings and Section VI concludes.
1 Underpricing, initial return and first-day return are used as synonyms in this paper. 2 Firms listed in Osaka, Nagoya, Sapporo, Fukoka, Hiroshima
II. Literature Survey
IPO literature offers many explanations for underpricing phenomenon; the winner’s curse, informational cascades, leaving good taste in investors’ mouth. The winner’s curse model, proposed by Rock (1986) focuses on information asymmetries, informed and uninformed investors. The model posits that underwriters compensate uninformed investors with a high level of underpricing in order to attract their attention to an issue. Ibbotson (1975), Ritter (1998) point out that IPOs are underpriced to leave a good taste in investors’ mouths so that future underwritings from the same issuer could be sold at attractive prices. Allen & Faulhaber (1989) suggest that large underpricing increases the likelihood of receiving publicity for issuing firm in which the IPO will be followed by a seasoned offering. Grinblatt and Huang (1989), Welch (1989) view underpricing as a tool used by firms to signal their quality.
In their paper, Benveniste and Spindt (1989) explain that when investors reveal good information with high demand, the final offer price will exceed the expected offer price. The predictions of their model show the degree of underwriting to the level of interest in the pre-market. In addition, Hanley (1993) confirms that underpricing is positively related to revisions in the offer price from the filing of the preliminary prospectus to the offer date. Level of underpricing depends on the last offer price which is revised by an underwriter.
An extensive IPO literature examines the relationship between shareholders’ offerings and underpricing. Existing explanations for selling behavior of shareholders focus on level of underpricing that arise during the book building. Habib and Ljungqvist (2001), Bradley and Jordan (2002) examine first-day return and report that firms offering larger shares, including more selling shareholders, have less underpricing. In their investigation of German Neuer Markt IPO pricing process Aussenegg et al (2002) find that initial returns are negatively related to fraction of issuers’ shares in the IPO. They emphasize the importance of market return in determining the number of shares offered. Changes in the market during the filing of the preliminary prospectus effect offer size of the issue. In the argument of wealth-maximizing behavior of shareholder selling, Ang and Brau (2003) find that shareholders tend either to increase secondary shares disproportional to new shares, or to reduce new shares to conceal the increase in the secondary shares offered.
The willingness of selling shareholders depends on several conditions such as; trend in the market, revealed information by shareholders, convincing power of underwriters, operating performance and characteristics of IPO companies. In recent IPOs, reduction in the secondary shares is associated high underpricing. Ljungqvist and William (2003) discuss that highly underpriced firms are the ones that are young
and engaged in technology products. In their study, Loughran and Ritter (2001) also find similar results showing an increase in the number and in the initial returns of young American IPO firms.
Loughran & Ritter (2002) recently came up with a discussion of leaving money on the table (MOT) and the reasons why issuers do not get upset about underpricing. They argue that revision in the offer range is related to MOT which is the amount of wealth transfer from issuing company and its pre-issue shareholders to investors. The number of shares sold includes all shares sold both by the company and by selling shareholders.3 Recent evidence on MOT suggests that low offer prices result more MOT that investors enjoy too much.
Concerning Japanese IPOs, performance and characteristics of IPO firms have changed over years. Cai and Loughran (1998), Kutsuna and Smith (2001) study investment and operating performance of Japanese equity offerings. Their findings support the industry fads hypothesis, which suggests that performance of IPOs is concentrated in few industries that become hot. Kutsuna et al (2000) examine ownership structure and operating performance of Japanese pre- and post-IPOs. Their empirical evidence indicates that operating performance of IPOs is negatively related to age of the firms and results are robust to adjustment for across industries.
A review of literature about Japanese IPOs reveals the fact that the underpricing of young firms is more severe than that of old firms. Kutsuna et al (2002) figure out the mean age of 31 for Jasdaq and 39 for TSE firms during 1995-1996. Hamao et al (2000) provide supporting evidence by using 456 IPOs data from 1989 to 1995. They document mean age of 35 for Jasdaq offerings. Pettway and Kaneko (1997) report an average 12.7% initial return for 69 Tokyo IPOs for that identical period. In the later years a sharp increase is observed in the initial returns of Japanese stocks. Kaneko and Pettway (2003) compare initial returns of auction versus book-building IPOs and find that the average initial return is 11.40% for auction IPOs and it is 47.60% for book-building IPOs from 1993 through 2001.
III. Data
689 IPOs issued from 1997 through 2001 are used in this study. The sample consists of new shares and selling shareholders in which shareholders sell some of their shares in the offering. The sample excludes re-listings and transfers from another stock market or market tier. The number of the shares offered is obtained from Nomura Securities. Industry classification of each IPO firm is defined in Kaisha Shiki Ho (Japan Company Handbook. The industry classification is matched with Nomura Securities’ data base. Offer price range information is provided from UFJ Tsubasa Securities. Offer range of each IPO includes minimum and maximum offer price ranges.
In this study there is a mix of auction and book-building methods. 90% of the sample is book-building IPOs and the rest is auction ones. In Japan, in September 1997 the book-building method was started and then all the issuers switched to this method. Till September 1997 all the IPOs in the sample were auction IPOs. Both in the auction and in the book- building, there is a time lag between negotiations and initial trading of stock which usually takes 2 weeks. Therefore, prior return of market is calculated over the 15 trading days before the offer date. Value-weighted Jasdaq index is used as proxy for benchmark choice. The allocation of IPOs is as follows; 61.39% from Jasdaq, 11.09% from TSE, 4.93% from Mothers, 10.74% form Hercules and 11.04% from regional stock exchange markets. Since the majority of the sample is from Jasdaq, the value-weighted Jasdaq index is used as a benchmark choice to indicate market movement.
IV. Variables and Methodology
In this empirical study the models comprise of descriptive statistics, non-parametric approach and regression models. Selection of variables depends on the characteristics of IPOs and market conditions. In order to test the extreme IPO underpricing sample size is divided into 3 sub-periods; 1997-1998, 1999, 2000-2001. Initial return (IR) is the return of the stock i at time t, calculated as the percentage change of the price of stock i from offer price(pi,o) to the first
day price at time t
(
p
i,t)
IR i,t = o i t i p p , , - 1 (1)
The ex ante risk of an issue is measured as both the percent width of the offer range and expected size of the offering. Offer price is stated in a range including the lowest limit price and the highest limit price pl, ph respectively. Here, P states the situations of offer price, po, in the offer range.
P1,2,3= = < < = ph po ph po pl pl po (2)
Expected offer price, pe, is the midpoint of the range. P states the situations of po according to pe.
P 1,2,3=
>
=
<
pe
po
pe
po
pe
po
, wherepe
=
(
pl
+
ph
)
/
2
(3) The variables used in non-parametric and regression models are listed here:AGE: is the natural logarithm of the age of the company, calculated by subtracting the foundation year of the firm from the year of IPO.
SAL: is the natural logarithm of sales of firm in the year preceding the IPO.
MAJ: is the dummy variable which takes on the value of 1 if firm’s CEO and owner is same person, 0 for others.
DIL: is the number of primary shares sold relative to pre-IPO shares outstanding. PAR: is the number of the secondary shares sold relative to pre-IPO shares outstanding.
SS: is the natural logarithm of number of shares offered by shareholders of IPO companies.
JSDQ: shows % change in the value-weighted JASDAQ index during the filing of the preliminary prospectus effect offer price of the issue which is usually 15 working days of time lag.
OP: is offer price position, calculated as the percentage difference between the expected offer price and final offer price.
∆ WDT: is the width of the offer price range. It shows percentage change between the lowest and the highest offer (pl, ph) prices.
UND: is the percentage of lead-underwriter, showing how much percentage the lead underwriter has underwritten for each IPO.
SRV: is a dummy variable which takes 1 if the firm is in service industry and 0 otherwise.
ELT: is a dummy variable which takes 1 if the firm is in electronics industry and 0 otherwise.
CMN: is a dummy variable which takes 1 if the firm is in communication industry and 0 otherwise.
B99: is a dummy variable which takes on the value of 1 if firm went to public in the year of 1999.
Multiple regression is used to figure out the determinants of underpricing.
it it it it it it it it it it it it it it
u
B
CMN
ELT
SRV
SS
PAR
DIL
AGE
UND
WDT
OP
JDSQ
IR
++
+
+
+
+
+
+
+
+
∆
+
+
+
=
99
12 11 10 5 9 8 7 6 4 3 2 1 0ϕ
ϕ
ϕ
ϕ
ϕ
ϕ
ϕ
ϕ
ϕ
ϕ
ϕ
ϕ
ϕ
(4)There is a dramatic decrease in the number of selling shareholders’ offerings. It is possible that owners, who expect underpricing to be high, may decide to sell fewer shares. Endogeneity may arise as the result of simultaneous determination of number of shares offered by shareholders and underpricing. In that case, SS variable may be correlated with the stochastic error term, that OLS coefficient would be biased and inconsistent. Selection bias may cause to overstate the effect of SS on initial return. To check whether SS regressor is truly endogenous to the equation Durbin-Wu-Hausman (1978) test is applied. SS is instrumented for sales and manager major shareholder. The reason is that, in practice, recently young companies going public rarely have high sales and their shareholders are supposed to avoid wealth loss more.
In the presence of endogeneity, SS can be written as:
it it it
Z
e
SS
=Θ' +( )
uit =E(
Zituit)
=0 E (5) where Z is a vector of instrumental variables SAL and MAJ are uncorrelated with u (Equation 4), Θdenotes the vector of respective unknown coefficients ande
is a random error. Inclusion of the estimated residuals e) of SS is additional explanatory variable, will test for endogeneity.it it it it it it it it it it it it it it e B CMN ELT SRV S S PAR DIL AGE UND WDT OP JDSQ IR ) + + + + + + + + + + ∆ + + + = 99 ˆ 12 11 10 5 9 8 7 6 4 3 2 1 0
ϕ
ϕ
ϕ
ϕ
ϕ
ϕ
ϕ
ϕ
ϕ
ϕ
ϕ
ϕ
ϕ
(6) In Wu testH
ois rejected, alternative hypothesis shows that there is a misspecification(
χ
2=7.31, p=0.03). In order to correct bias, 2SLS regression is employed, allowing for the simultaneity of selling shareholder. In the first stage, exogenous characteristics are used to identify selling shareholder regression. The purpose of the first stage is to create new dependent variables, which do not violate OLS regression's recursivity assumption. OLS regression is employed for SS on SAL and MAJ instrumentals (Z) and get predictions for SS, sayS
S
)
. To asses how good the instruments are,R
2to generate e)from the first stage of 2SLS should be examined, if these are lower than 0.1 then the instruments are most likely to be inappropriate. Using instrumental variables, SAL and MAJ have positive effects on the number of shares offered by shareholders. In the second stage, the predicted value,S
S
)
, is used in estimating IR equation.V. Empirical Results
The analysis is carried out in two parts. In the first part descriptive statistics, in the second part regression analysis are given.
A concern of bubble underpricing in cohort years and in several stock markets is shown in Table 1.
Table 1: Descriptive Statistics of IPO Initial Return
Panel A: IR Distribution from 1997 to 2001
Year # IPOs Mean Median Std Dev Min Max IR97 136 3.97 2.52 19.54 -35.75 185.71 IR 98 86 20.67 10.39 38.54 -41.41 271.43 IR 99 106 111.29 58.49 156.2 -20.83 809.09 IR 00 201 18.00 5.88 49.87 -64.29 300.00 IR 01 160 43.64 20.71 77.63 -72.5 496.77 IR 97-98 222 10.43 4.00 29.51 -41.41 271.43 IR 99 106 111.29 58.49 156.2 -20.83 809.09 IR 00-01 361 29.36 8.57 64.86 -72.5 496.77 IR 97-01 689 35.87 9.09 85.50 -72.50 809.09
Panel B: IR Distribution in Japanese Stock Markets Stock Market Number of IPOs % of IPOs Age Mean Median IR % Mean Median Jasdaq 423 61.39 25.37 24.00 39.82 10.44 TSE 82 11.90 34.09 31.50 15.65 4.69 Mothers 34 4.93 6.91 5.00 32.12 1.25 Hercules 74 10.74 11.22 10.00 53.22 14.64 Others 76 11.04 32.37 29.50 20.47 7.63 Total 689 100.00 24.75 22.00 35.87 9.09
In Table 1, Panel A shows the distribution of IPOs and IR for each year. Initial returns are examined by comparing mean returns and their standard deviations. IPO years are subdivided into 3 periods. Corresponding results provide evidence that there was a sharp increase in the initial returns of 1999. Loughran & Ritter (2001) present evidence of 71.7% IR for American IPOs in 1999 whereas the result of this paper shows an initial return of 111.3% for Japanese IPOs for the cohort year. Panel B reports the distribution of IR in several Japanese stock markets. Initial returns in Mothers and Hercules stock exchanges exceed the returns in TSE and regional stock markets.
Average First-Day Returns by Age of Firms at Time of IPO
Age of Firms at Time of IPO
90 80 70 60 50 40 30 20 19 18 17 16 15 14 13 12 11 10 9 8 7 6 5 4 3 2 1 A ve ra g e F ir s t-D a y R e tu rn % 140 120 100 80 60 40 20 0
Figure 1 summarizes the age of IPO companies. Age scale of the firms is pretty long; from 1 year old to 95 years old. High IR is associated with young IPOs. The results suggest that even 1 year old firms had an average of 20% IR during 1997-2001. During the year of 1999 young firms were more likely to go public in Jasdaq and Mothers stock markets. In contrast to this, mature firms preferred TSE and other markets for going public decision.
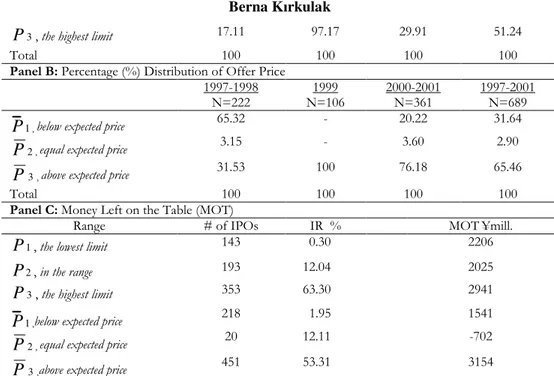
Table 2: Offer Price Range
Panel A: Percentage (%) Distribution of Offer Price 1997-1998 N=222 1999 N=106 2000-2001 N=361 1997-2001 N=689 1
P , the lowest limit 45.95 - 11.36 20.76
2
3
P , the highest limit 17.11 97.17 29.91 51.24
Total 100 100 100 100
Panel B: Percentage (%) Distribution of Offer Price 1997-1998 N=222 1999 N=106 2000-2001 N=361 1997-2001 N=689
P
1, below expected price 65.32 - 20.22 31.64 2P
, equal expected price 3.15 - 3.60 2.90 3P
, above expected price 31.53 100 76.18 65.46Total 100 100 100 100
Panel C: Money Left on the Table (MOT)
Range # of IPOs IR % MOT¥mill.
1
P , the lowest limit 143 0.30 2206
2
P
, in the range 193 12.04 20253
P , the highest limit 353 63.30 2941
P
1,below expected price 218 1.95 1541 2P
, equal expected price 20 12.11 -702 3P
,above expected price 451 53.31 3154Money left on the table (MOT) is defined as the difference between closing price on the first day and offer price, multiplied by the number of shares sold. IR and MOT values are given in mean values in column C.
It is worth noting that underpricing has been increasing over years among young IPO companies. The reason for this increase is due to settlement in the offer price range. To test whether there is a positive relation between pricing and initial return equations (2) and (3) are used. Table 2 exhibits pricing range. Panel A and B present clear evidence of positive relation between the highest limit and underpricing. In 1999, all final offer prices were higher than expected offer prices. This finding suggests that the highest limit IPOs result higher underpricing. Panel C provides calculation of MOT within the scope of offer price range. MOT has negative value for
P
2 .The reason is that closing price is lower than final offer price (=expected offer price). Consequently, there is no wealth transfer from IPO firms to investors in the case ofP
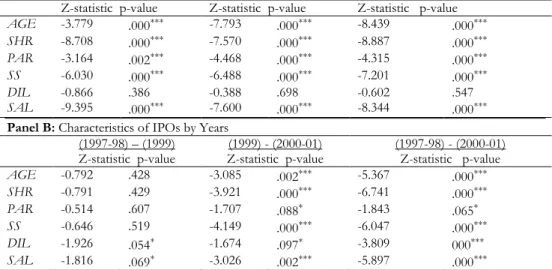
2.Table 3: Characteristics of Japanese IPOs
Panel A: Characteristics of IPOs by Markets
Z-statistic p-value Z-statistic p-value Z-statistic p-value AGE -3.779 .000∗∗∗ -7.793 .000∗∗∗ -8.439 .000∗∗∗ SHR -8.708 .000∗∗∗ -7.570 .000∗∗∗ -8.887 .000∗∗∗ PAR -3.164 .002∗∗∗ -4.468 .000∗∗∗ -4.315 .000∗∗∗ SS -6.030 .000∗∗∗ -6.488 .000∗∗∗ -7.201 .000∗∗∗ DIL -0.866 .386 -0.388 .698 -0.602 .547 SAL -9.395 .000∗∗∗ -7.600 .000∗∗∗ -8.344 .000∗∗∗ Panel B: Characteristics of IPOs by Years
(1997-98) – (1999) Z-statistic p-value (1999) - (2000-01) Z-statistic p-value (1997-98) - (2000-01) Z-statistic p-value AGE -0.792 .428 -3.085 .002∗∗∗ -5.367 .000∗∗∗ SHR -0.791 .429 -3.921 .000∗∗∗ -6.741 .000∗∗∗ PAR -0.514 .607 -1.707 .088∗ -1.843 .065∗ SS -0.646 .519 -4.149 .000∗∗∗ -6.047 .000∗∗∗ DIL -1.926 .054∗ -1.674 .097∗ -3.809 000∗∗∗ SAL -1.816 .069∗ -3.026 .002∗∗∗ -5.897 .000∗∗∗
In panel A, the sample size covers of 689 IPOs from 1997 to 2001; JSDQ (N=423), TSE (N=82), MOTH (N=34), HERC (N=74). In Panel B, the sample is distributed as; 1997-1998(N=222), 1999(N=106), 2000-2001(N=361).
∗
10 % significance level ; ∗∗ 5% significant level ; ∗∗∗ 1% significant level
Mann Whitney non parametric test helps visualizing the characteristics of IPOs in sub-periods and stock markets. The results of U test with the level of significance are given in Table 3. The results of U test reject the null hypothesis almost for all cases in Panel A. The observed difference in age, number of shares offered, participation ratio, and selling shareholders are statistically significant at 1% significance level for Jasdaq, TSE, Mothers and Hercules IPOs. Z statistic shows that among all exchange markets TSE IPOs offer more number of shares than those of others (z= -8.708, -7.570, -8.887). The number of shares offered by other exchanges is relatively low. Unreported descriptive statistics also support the fact that IPO firms on regional markets offer large number of shares.
In the first column of Panel B, AGE, SHR, PAR and SS are not significant. These results appear to imply that both the number of shares offered and the characteristics of IPO firms were similar in 1997, 1998 and 1999. Unreported results confirm that age of IPO firms did not differ in these years. Establishment of new stock markets, Mothers and Hercules, induced an increase in the initial return of young and high-tech IPO firms. The significant coefficients of variables in the third column suggest that young IPO firms with the influence of new stock markets tended to offer few shares in the expectations of underpricing.
IR IR
Technology Companies Non-Technology Companies
Model 1 Model 2 Model 3 Model 4 Model 5 Model 6 Intercept 2.91∗ (2.51) 3.66∗∗∗ (2.94) 2.88∗∗∗ (2.97) -0.08 (-0.32) 0.39 (1.17) 0.32 (1.29) JSDQ 4.67∗∗∗ (5.78) 5.11∗∗∗ (6.08) 2.75∗∗∗ (3.02) 1.57∗∗∗ (3.49) 1.74∗∗∗ (3.82) 1.33∗∗∗ (3.08) OP 1.64∗∗∗ (4.91) 1.01∗∗∗ (3.09) 0.52∗ (1.74) 1.39∗∗∗ (5.81) 1.23∗∗∗ (5.50) 0.93∗∗∗ (4.16) ∆ WDT -1.05∗∗∗ (-3.21) -1.28∗∗∗ (-3.44) -0.85∗∗∗ (-3.19) 0.09 (0.51) 0.06 (0.35) 0.06 (0.32) UND -3.46∗ (-1.93) -3.55∗ (-1.95) -2.68∗ (-1.84) 0.51 (1.32) 0.47 (1.25) 0.52 (1.42) AGE -0.01∗∗∗ (-2.56) -0.009∗∗ (-2.39) -0.004∗∗∗ (-2.58) -0.004∗∗∗ (-2.75) DIL -0.34 (-0.35) -0.95 (-1.14) -0.29 (-0.70) -0.33 (-0.75) SS -0.08∗∗ (-2.37) -0.08∗∗∗ (-3.09) -0.05∗∗∗ (-3.14) -0.05∗∗∗ (-3.62) B99 1.41∗∗∗ (3.93) 0.34∗∗∗ (3.44) IR (Mean) % 50.79 13.48 26.25 7.14 (Median) Adjusted R2 0.20 0.24 0.37 0.14 0.19 0.23 # of IPOs 270 270 270 419 419 419
T-ratios are computed using White’s (1980) heteroskedascity-adjusted standard errors. T-ratios are shown in parentheses.
∗ 10 % significance level; ∗∗ 5% significant level; ∗∗∗ 1% significant level
Table 4 presents summary statistics on initial returns for sub-samples of IPOs. The average initial returns of technology companies are higher than those of non-technology companies. The average initial return is 50.79 % for high-tech issues and it is 26.25 % for non-high-tech issues. Adjusted R2 is higher for technology stocks.
Technology companies are generally involved in service, electronic and communication industries. Initial return is dependent variable. The explanatory variables are chosen on the basis of their associations with initial return. When either technology IR or non-technology IR is employed, expansion of the model from (1) to (6) is sufficient to explain that estimates of coefficients for age, dilution and selling shareholders are always negative.
The coefficient of market return is positive and significant. This positive coefficient on the market return during the filing procedure gives strong explanatory power for hot market condition. A rising market in the period before the issue is brought to market is an important determinant of underpricing.
Empirical results suggest that offer price position in the range is considerably effective in explaining the initial return of IPOs. Offer price position is positive and significant showing that a higher offer price position induces to a greater level of underpricing. Positive correlation reflects the high demand of investors to stimulate the underwriters to revise the offer price position and set the offer price above the expected price during the pre-market activities. It is imported to note that unlike the U.S., the offer prices can not be set below and above the offer price range because of the administrative guidance by MOF (Ministry of Finance). Regulation by Ministry of Finance strictly forbids offer price adjustments above and below the offer price range. However, in the U.S., underwriter can revise the offer price and adjusts the offer price above the maximum offer price in the filing range in the case of excess demand.
Findings show that ∆ WDT explanatory variable is significant at 1% level for technology industries whereas it is not significant for non-technology industries. Offer price range is not too wide for service, electronic and communication industries. This narrow width can be interpreted as the confidence of underwriters while setting minimum and maximum prices. According to high demand from investors underwriters are likely to set narrow offer ranges.
The market share of lead underwriter is used to indicate the interest of underwriter for each IPO. The coefficients of UND explanatory variable differ for both technology and non-technology firms. The negative and significant coefficient of underwriters, particularly for technology industries, shows a tough competition among underwriters that makes market share of lead underwriter lower. The high interest of underwriters in the underwriting syndicate lowers the lead underwriter share.
The coefficient for the age variable is negative and significant. This shows the relationship between the uncertainty and underpricing. Hence, the issues of younger firms have higher initial returns on average.
Dilution is inversely related to initial return but not significant for both technology and non-technology IPOs. In all industries, shareholders tend to offer few shares. It is possible, however, that the higher negative coefficient is due to expected level of underpricing. Table 5: Regression Results for Determinants of Underpricing in Japan
IR OLS SS OLS IR 2SLS Model 7 Model 8 Model 9 Model 10 Model 11 Model 12 Intercept 1.18∗∗ (2.12) 1.91∗∗∗ (3.14) 1.71∗∗∗ (2.98) 1.48∗∗∗ (2.91) -0.31 (-0.37) 1.85 ∗∗∗ (2.99) JSDQ 2.65∗∗∗ (5.74) 3.02∗∗∗ (6.35) 3.16∗∗∗ (6.60) 2.21∗∗∗ (4.89) 0.39 (0.52) 2.26∗∗∗ (4.99) OP 1.58∗∗∗ 1.18∗∗∗ 1.12∗∗∗ 0.69∗∗∗ -1.98∗∗∗ 0.45∗∗
(7.99) (6.53) (6.09) (3.71) (-3.79) (2.07) ∆ WDT -0.40∗∗ (-2.22) -0.68∗∗∗ (-3.25) -0.66∗∗∗ (-3.51) -0.44∗∗∗ (-2.82) -0.33∗∗ (-0.92) -0.49∗∗∗ (-3.01) UND -1.22 (-1.40) -1.33 (-1.53) -1.20 (-1.36) -0.98 (-1.23) 0.80 (0.84) -0.99 (-1.26) AGE -0.008∗∗∗ (-4.16) -0.006∗∗∗ (-3.81) -0.006∗∗∗ (-3.95) 0.001∗∗∗ (2.85) -0.004∗∗∗ (-2.31) DIL -0.45 (-0.83) -0.56 (-1.08) -0.74 (-1.50) -7.27 ∗∗∗ (-6.75) -1.49∗∗ (-2.06) PAR -0.89∗ (-1.80) -0.96∗ (-1.95) -0.84∗ (-1.74) 17.85∗∗∗ (8.72) 1.07 (0.91) SS -0.06∗∗∗ (-2.97) -0.05∗∗∗ (-2.68) -0.06∗∗∗ (-3.52) -0.16∗∗ (-2.36) SAL 0.37∗∗∗ (6.68) MAJ 0.34∗∗∗ (3.03) SRV 0.11∗ (1.68) 0.13∗ (1.93) -0.23∗ (-1.65) 0.09 (1.29) ELT 0.15∗ (1.93) 0.17∗∗ (2.27) 0.23 (0.59) 0.19 ∗∗ (2.40) CMN 1.45∗ (1.84) 1.35∗ (1.89) -1.07∗∗ (-2.88) 1.25∗ (1.71) B99 0.69∗∗∗ (5.13) 0.38∗∗ (2.25) 0.73∗∗∗ (5.30) Hausman
χ
2=7.31 p=0.03 Adjusted R2 0.13 0.19 0.23 0.30 0.51 0.29 # of IPOs 689 689 689 689 689 689 T-ratios are computed using White’s (1980) heteroskedascity-adjusted standard errors.T-ratios are shown in parentheses. ∗ 10 % significance level; ∗∗ 5% significant level; ∗∗∗ 1% significant level
An inverse significant relationship between initial return and selling shareholder is observed. This finding supports the hypothesis that shareholders tend to offer few shares in order to decrease wealth loss.
B99 is used as a categorical variable for the boom. The coefficient of this variable is positive and significant showing that high initial returns occurred particularly in 1999. The high initial returns come from the booming markets for mobile communications services and the Internet.It is true that Internet stocks were overpriced when so many firms went public during this period. Entrepreneurs have been shown to be overly optimistic and tried to benefit from the positive atmosphere. Year 1999 was a starting point for Mothers stock market. Light listing requirements stipulated many firms to access equity markets easily.
Table 5 summarizes the determinants of underpricing In Model (7), initial return is controlled for market return, offer price position, width and market share of lead underwriter. High initial return is positively associated with market return and offer price position (p< 0.01), consistent with the hypothesis that there is a hot market.
The theory states that there is a positive relation between ex ante uncertainty and expected initial return. The reason for this positive relation is that it is difficult for investors to predict the actual initial returns on risky issues. This assumption is violated during the boom of high-tech issues. The ex ante risk of an issue is measured with the percent of width. Underwriters, who receive excess demand from institutional investors, particularly for high-tech issues, are likely to set narrow offer ranges. Width of the offer price range in model (7), (8), (9), (10), and (12) correlates negatively with initial return. The finding is consistent with the results of Table 4.
Concerning the industry variables, SRV, ELT, CMN, Model (9) and Model (10) reveal positive significant relation with initial return. In addition to this, bubble variable is significant (p<0.01), consistent with the univariate results in Table 1 indicating a considerable increase in the initial returns in 1999.
The analysis shows that shareholders tend to avoid selling more shares so that their wealth losses become less. In Model (9), (10), and (11) there again is an evidence of decline in the shareholders’ offerings. Findings are robust to specification test. Model (12) treats the selling shareholder variable as endogenous. Sales (SAL) and manager shareholder (MAJ) serve as instruments. One of the problems in using the sales as an instrumental variable is that sales may have effect on initial return. However, as discussed in the methodology section, low sales companies are the ones that are young and would prefer issuing rather than selling existing shares. Moreover, it is worth noting that age and sales are statistically significant to explain SS in Model (11) while controlling for offer characteristics. Further, the results reveal the fact that SAL instrumental variable is not affecting the efficiency of model. The second instrumental variable, manager shareholder shows the sensitivity in offering the shares during IPO. To test for consistency, Durbin-Wu-Hausman test is used. Wu test is significant at 0.05 level (
χ
2=7.31, p=0.03) and fails to reject the exogeneity of selling shareholder (SS) variable. Instrumental variables are valid to generate exogenous variation in shareholders’ offerings. OLS estimate reported in Model (7,8,9,10) is not consistent anymore.In Model (11) the coefficients estimates of SAL and MAJ variables are significant. Empirically, there is a positive relation between shareholders’ offerings and sales. Interestingly, the effect of manager shareholder is positive and significant, suggesting that non-manager shareholders avoid offering shares more. The logic behind this finding can be explained by the attitudes of young firms. As young firms
consider accessing to equity markets, major shareholders may be asked by underwriters to sell more shares to convince the potential investors during the IPO.
The negative effect of dilution on SS supports the fact that the number of the primary shares sold relative to pre-IPO shares of issuing companies increases when SS decreases. Decision of offering secondary shares is closely associated with industry. Consistent with the results in Table 4, negative coefficient estimates of SRV and CMN show that shareholders reduce size of secondary offerings in high-tech IPOs. IPO firms in 2000-2001, mostly high tech IPOs with higher IR expectations referring to bubble, were the ones those tried to avoid selling more secondary shares.
Model (12) reports 2SLS estimates that treat selling shareholder as endogenous. Using the predicted selling shareholder (
S
S
)
) , this model provides consistent estimates of selling shareholder on the initial return. Comparing column (10) with column (12) the overestimated effect of SS is reduced. However, the coefficient remains significant (p=0.03) and negative, it is not significant at 1% anymore. Further, participation ratio becomes insignificant, and dilution factor becomes significant. The coefficient sign of participation ratio becomes positive. Negative significant coefficient of DIL is a result of high underpricing expectations. In others words, dilution ratio decreases as underpricing increases. After removing the endogenous bias the coefficient estimates of age and offer price position variables become lower. The reason of slight decrease in the age and offer price position coefficient is that many non-technology IPOs in 1999 were priced at the highest offer price.VI. Conclusion
In this paper, sample of 689 firms from 1997 to 2001 excluding seasoned equity offerings is examined. The evidence shows that there is a remarkable increase in the initial return of Japanese IPOs during the sample period. This increase can be attributed to boom of high-tech IPOs and can be linked to interest of the investors for IT and communication stocks. Therefore, pre-IPO market for underwriters became competitive and market share for underwriters declined particularly in 1999. Further, examination of offer price range reveals the fact that underpricing is positively related to offer price position from the filing prospectus to the offer date. The highest limit stocks are the indicator of heavy demand from the institutional investors and they are positively correlated with underpricing.
Increase in the initial returns has a direct impact on money left on the table and shareholders’ offerings. Money left on the table increases when the final offer price exceeds the expected offer price. Shareholders reduce number of secondary shares in order to avoid wealth loss. after the bubble 1999, company owners with high underpricing expectations tried to maximize their wealth. The positive atmosphere and greater expectations towards high-tech issues continued in 2000 and 2001. Although
there was not extreme underpricing in 2000-2001 as there was in 1999, the reduction of secondary shares and primary sales was remarkable in this period. The reason why issuers had high underpricing expectations during 2000-2001 might be the influence of high initial returns in 1999. Investors as well as the underwriters expected to have continuing earnings. Market conditions and slow down in the economy might be reasons for relatively low underpricing after 1999.
Acknowledgement
Thanks to Professor Yasuyuki Hamada for providing data from Nomura Securities. I gratefully acknowledge support of Professor Endo Kaeru from Otaru University of Commerce, Koichi Sato and Masahiro Tamura to provide me data from UFJ Tsubasa Securities.
References
Allen, F., and Faulhaber, R. G., (1989). Signaling by underpricing in the IPO market, Journal of Financial Economics, No: 23, pp.303-323.
Ang, S. J., and Brau, C. J., (2003). Concealing and confounding adverse signals: insider wealth-maximizing behavior in the IPO process, Journal of Financial Economics, No: 67, pp. 149-172.
Aussenegg, W., Pegaret, P., and Alex, S., (2002). IPO Pricing with Bookbuilding and When-Issued Market, Working paper, Vienna Technical University.
Benveniste, L.M., and Spindt P.A., (1989). How investment bankers determine the offer price and allocation of new issues, Journal of Financial Economics, No: 24, pp. 343-361.
Bradley, D. J., and Bradford, D. J., (2002). Partial Adjustment to Public Information and IPO underpricing, Journal of Financial and Quantative Analysis, No: 37, pp. 595-616.
Cai, J., and Laughran, T., (1998). The performance of Japanese seasoned equity offerings, 1971-1992, Pacific-Basin Finance Journal, No: 6, pp. 395-425.
Green, W.H., (1997). Econometric Analysis, 3rd edition, Prentice-Hall, Englewood Cliffs, N.J.
Grinblatt, M., and Huang, C.Y., (1989). Signalling and the Pricing of New Issues, Journal of Finance, No: 44, pp. 393-420.
Habib, M., and Ljungqvist, A., (2001). Underpricing and entrepreneurial wealth losses in IPOs: Theory and evidence, Review of Financial Studies, No: 14, pp. 433-458.
Hamao, Y., Packer, F., and Ritter, J., (2000). Institutional affiliation and the role of venture capital: Evidence from initial offerings in Japan, Pacific-Basin Finance Journal, No: 5, pp. 529-558.
Hanley, W. K., (1993). The underpricing of initial public offerings and partial adjustment phenomenon, Journal of Financial Economics, No: 34, pp. 231-250. Hausman, J.A., (1978). Specification Tests in Econometrics, Econometrica, No: 46,
pp. 1251-1271.
Ibbotson, R. G., (1975). Price performance of common stock issues, Journal of Financial Economics, No: 2, pp, 235-272.
Kaneko, T., and Pettway, R., 2003. Auctions versus book building of Japanese IPOs. Pacific-Basin Finance Journal, 11, 439-462.
Kutsuna, K., and Smith R., (2001). Why does book building drive out Auction Methods of IPO Issuance? Evidence and Implications from Japan, Working paper, Claremont Colleges.
Kutsuna, K., Cowling, M., and Westhead, P., (2000). The short-run performance of JASDAQ companies and venture capital involvement before and after IPO, Venture Capital, An International Journal of Entrepreneurial Finance, No: 2, pp. 1-25.
Kutsuna, K., Okamura, H., and Cowling, M., (2002). Ownership structure pre- and post-IPOs and the operating performance of JASDAQ companies, Pacific-Basin Finance Journal, No: 10, pp. 163-181.
Ljungqvist, A., P., and Wilhelm, J., 2003. IPO pricing in the dot-com bubble. Journal of Finance 58, 723-752.
Loughran, T., and Ritter J., (2001). Why has IPO Underpricing Increased Over Time, Working paper, Florida University.
Loughran, T., and Ritter, J., (2002). Why Don’t Issuers get upset about leaving money on the table in IPOs?, Review of Financial Studies,No: 15, pp. 413-443. Pettway, R., and Kaneko, T., (1997). A comparison of impacts of the partial auction
system of Japanese IPOs versus the U.S. discretionary allocation system, Working paper, University of Missouri.
Ritter, J., (1998). Initial Public Offerings, Contemporary Finance Digest, Vol.2, No.1, pp. 5-30.
Rock, K., (1989). Why New Issues are underpriced, Journal of Financial Economics, No: 15, pp. 187-212.
Welch, I., (1989). Seasoned Offerings, Imitation Costs and the Underpricing of Initial Public Offerings, Journal of Finance, No: 44, pp. 421-449.
White, H., (1980). A heteroscedasticity-consistent covariance matrix and a direct test for heteroscedasticity, Econometrica, No: 48, pp. 721-746.