https://doi.org/10.1177/2158244020924434 SAGE Open April-June 2020: 1 –22 © The Author(s) 2020 DOI: 10.1177/2158244020924434 journals.sagepub.com/home/sgo
Creative Commons CC BY: This article is distributed under the terms of the Creative Commons Attribution 4.0 License (https://creativecommons.org/licenses/by/4.0/) which permits any use, reproduction and distribution of
the work without further permission provided the original work is attributed as specified on the SAGE and Open Access pages (https://us.sagepub.com/en-us/nam/open-access-at-sage).
Original Research
Introduction
Unfair income distribution and poverty are among the most important issues on the world economic agenda. As a result of unfair income distribution, not every unit of the society can benefit equally from health, education, housing, and nutrition. As can be seen here, unfair income distribution is not only an economic but also a social problem. On the con-trary, it is accepted that there is a positive relationship between income distribution and poverty. When income is distributed unfairly in a country, there is an increase in the number of poor in that country. This situation will negatively affect the national economy (Leong et al., 2018). Furthermore, crime rates are likely to increase in a country with a lot of poor people. Therefore, when poverty increases, social prob-lems in the country may increase. In summary, the solution of these problems is important for the social welfare of coun-tries (Blau, 2018; Frank, 2019).
There are many different factors that cause these prob-lems. For example, the rapid increase in population growth is
thought to cause inequality in income distribution. In addi-tion, it is accepted that the informal economy causes this problem in the country as it reduces the tax revenues of the state (Halvarsson et al., 2018; Solt, 2016). On the contrary, in a country where inflation is high, the purchasing power of low-income people is decreasing more which leads to income inequality. Unbalanced wealth distribution is also seen as one of the reasons of inequality in personal income distribu-tion. The level of education and technological development in a country are other important issues affecting the justice in income distribution (Jenkins, 2015).
1Xi’an University of Posts & Telecommunications, China
2Istanbul Medipol University, Turkey
Corresponding Author:
Hasan Dinçer, School of Business, Istanbul Medipol University, Istanbul 34810, Turkey.
Email: [email protected]
IT2-Based Hybrid Approach for
Sustainable Economic Equality:
A Case of E7 Economies
Shubin Wang
1, Junsheng Ha
1, Hakan Kalkavan
2,
Serhat Yüksel
2, and Hasan Dinçer
2Abstract
This study aims to identify the factors affecting economic inequality in emerging seven (E7) countries. Within this framework, first, a wide literature review has been made and 12 different criteria which are thought to affect economic inequality have been determined. These criteria were weighted according to their importance with the help of interval type-2 (IT2) fuzzy Decision-Making Trial and Evaluation Laboratory (DEMATEL) method. Then, by using these weighted criteria, the E7 countries were ranked according to economic equality performance with IT2 fuzzy Multi-Objective Optimization by Ratio Analysis (MOORA) and IT2 fuzzy Technique for Order Preference by Similarity to Ideal Solution (TOPSIS) methods. The findings show that fair taxation, the equality of education provided by the state, and the uncontrolled growth of financial markets have a significant effect on the economic inequality. On the other side, Russia and China are the most successful countries in terms of economic equality, whereas India and Brazil have the worst performances. While considering these results, it can be said that the taxation system must be fair to eliminate the economic inequality. For this purpose, E7 countries should implement direct taxes, such as wealth tax to transfer funds from the rich to middle- and low-income groups. In addition, these countries should offer equal education opportunities to all citizens which affects their future income level. Finally, legal authorities should make the necessary arrangements and prevent excessive risk of financial system in the country so that the financial system in the country can be maintained in a healthy manner.
Keywords
Countries take many different measures to solve unfair income distribution and poverty problems. For example, social assistance provided by the state is an important prac-tice preferred in the fight against poverty. Thanks to the state’s social assistance to poor citizens, it will be possible to contribute to the reduction of poverty in the country. However, the state also tries to prevent income injustice through tax policies (Halvarsson et al., 2018). With the col-lected taxes, the state can help the poor people, and thus, it is aimed to redistribute the income. On the contrary, the state can set a minimum level for the wages of workers. This will prevent workers from receiving very low wages. In addition, the state can reduce economic inequality in the country through effective education and health policies (Ceddia, 2019).
In this framework, the important issue is to ensure sus-tainability in solving these problems. In a situation where the population increases in a country, it is not possible to reduce income injustice with social assistance provided only by the state (Nallareddy et al., 2018). At some point, these benefits will significantly increase costs in the state budget. Likewise, without focusing on other problems, setting a lower limit on workers’ wages will not be sufficient for a long-term solution of income inequality. Therefore, to solve the income inequal-ity problem, the factors causing this problem must be clearly identified. In this way, it will be possible to ensure continuity in the solution of the problem in question (Mattauch et al., 2018).
There are different criteria used to determine the distri-bution of income in a country. The Lorenz curve, which shows the cumulative share of national income obtained by different segments of society in a country, is often preferred in the measurement of income distribution. With this curve, the percentage shares of a certain percentage of the society from national income can be determined. The more the Lorenz curve deviates from the line of complete equality, the more unjustly the income is distributed in the country (Y. Chen et al., 2018; Pavkova et al., 2016). The state where this deviation is expressed numerically is called the Gini coefficient. This coefficient can take values between 0 and 1. Hence, the closer this coefficient is to 1, it means that the worse the income distribution (Romero et al., 2016; Valbuena et al., 2016). The Atkinson criterion measure and Theil index are other methods used for this purpose (Yuan & Liu, 2018).
However, there are many criticisms in the literature regarding these measurement methods. Some of the research-ers criticize the definition of income discussed in these meth-ods. Income varies according to the ownership of companies or individuals. Therefore, different measurement of each income group is required. Nevertheless, the income gener-ated by the informal sector is also ignored in these calcula-tions. The ratio of the informal economy is quite high, especially in developing countries. Therefore, the exclusion of this issue is considered a significant deficiency.
In addition, it is claimed that these methods do not make a precise measurement of income inequality. For example, it is possible that the two countries may have the same Gini coef-ficient, while the level of income inequality is different (Bishop et al., 1989; Newbery, 1970).
On the contrary, these applications for measuring income distribution only show the result. In other words, it provides information about how fair or unfair the distribution of income of a country is. These methods do not provide any guidance for solving the causes of income inequality in a country. However, to solve this problem in the country in the long term, it is necessary to identify the main factors causing this problem and to take specific actions. In this context, the adequacy of the method to be used is very important. Multi-criteria decision-making methods are preferred approaches for many different subjects in the literature for this purpose. These methods are very helpful in reaching a solution in the case of complex environment in which there are many differ-ent alternatives.
In this study, the factors that cause economic inequality of countries are examined. In this context, emerging seven (E7) countries were included in the scope of the review. The anal-ysis process of the study has three different stages. First, similar studies in the literature were examined in detail, and the dimensions and criteria that could lead to economic inequality of countries were determined. The dimensions and criteria were then weighted using the interval type-2 (IT2) fuzzy Decision-Making Trial and Evaluation Laboratory (DEMATEL) method. In this way, the importance weights of the mentioned items are determined. The main advantage of fuzzy DEMATEL approach over the similar methodologies is to construct the impact-relation map as well as influencing degrees among the factors. In the final stage of the analysis process, E7 countries were ranked according to economic equality by using IT2 fuzzy Multi-Objective Optimization by Ratio Analysis (MOORA) and IT2 fuzzy Technique for Order Preference by Similarity to Ideal Solution (TOPSIS) methods. According to the results of the analysis, it will be possible to develop strategies for the sustainability of eco-nomic equality in these countries. After that, another analysis is also performed by including both E7 and G7 economies to see the appropriateness of the ranking results. The main advantage of fuzzy MOORA method is to consider both pos-itive and negative items together. In addition, fuzzy TOPSIS has several advantages in the ranking process by defining the similarity to ideal solution. Similarly, our proposed models with IT2 fuzzy sets get advantages by providing more accu-rate and comprehensive results than conventional fuzzy methods with trapezoidal fuzzy numbers under the complex decision-making problem.
This study is thought to contribute to the literature in many respects. First, the factors that have the greatest impact on the economic inequality of E7 countries will be identified. These results guide both policy practitioners and academi-cians in the countries concerned. In addition to this situation,
according to World Inequality Report in 2018, there is sig-nificant income inequality in E7 economies. Therefore, the recommendations to be presented in this study are important to prevent income inequality in these countries. On the con-trary, IT2 fuzzy DEMATEL, IT2 fuzzy MOORA, and IT2 fuzzy TOPSIS approaches were taken into consideration together for the first time in the measurement of income inequality. Hence, it is thought that this situation has an important contribution to the originality of this study. Moreover, by making ranking both IT2 fuzzy MOORA and IT2 fuzzy TOPSIS approaches, it will be possible to make comparative analysis. In addition, by making robustness check while including Group of Seven (G7) countries, the appropriateness of the analysis results can be evaluated.
This study consists of four different parts. In this first part, some important concepts such as income injustice and pov-erty are shared. In the second part of the study, the literature has been searched based on the factors affecting the eco-nomic injustice of the countries. In addition, theoretical information about the methods used in the analysis process is explained in the third part of the study. On the contrary, the next part contains the results of the analysis. Finally, sugges-tions are underlined.
Determinants of Economic Inequality
Background
Economic inequality is one of the major problems facing countries in economic terms. This problem is defined as the difference in economic prosperity among individuals in a country. There are many causes of economic inequalities in society. The misplaced workforce planning and the country’s economic or social difficulties can be given as an example for this problem. On the contrary, it is possible to mention many negative effects of economic inequality. For example, increasing economic inequality makes the unemployment problem permanent and adversely affects long-term eco-nomic growth. For this situation, the significant point is how this inequality is measured.
Macroeconomic factors are important in economic inequalities. For example, unemployment, gross domestic product (GDP) growth, inflation, and the effectiveness of the financial system are quantitative elements that give informa-tion about countries’ economic inequality. Within this con-text, in case of high unemployment, it is thought that economic inequality increases because people, who do not have regular income, become poorer. Similar to this situa-tion, GDP per capita is also accepted as another significant indicator of economic equality. As this ratio focuses on eco-nomic performance of the country by number of people, it is believed that it is a good measurement of standard of living. In addition, when there is high inflation, uncertainty in the market goes up. This situation has a decreasing effect on
economic equality because it leads to decrease in the invest-ment amount.
However, it is also considered that qualitative factors are also important in measuring economic inequality. In this framework, factors such as corruption, democratic transpar-ency, educational equality, and legal justice also play an important role in the context of economic inequality. When there is corruption in the country, foreign investors become unwilling to make new investment to this country. This situ-ation causes higher economic inequality. Parallel to this aspect, if the country does not provide educational equality to its citizens, a large number of people will lose the oppor-tunity to find a suitable job. This will not only harm the eco-nomic situation of individuals but will also lead to an increase in economic inequality within the country.
GDP Per Capita Data of E7 Economies
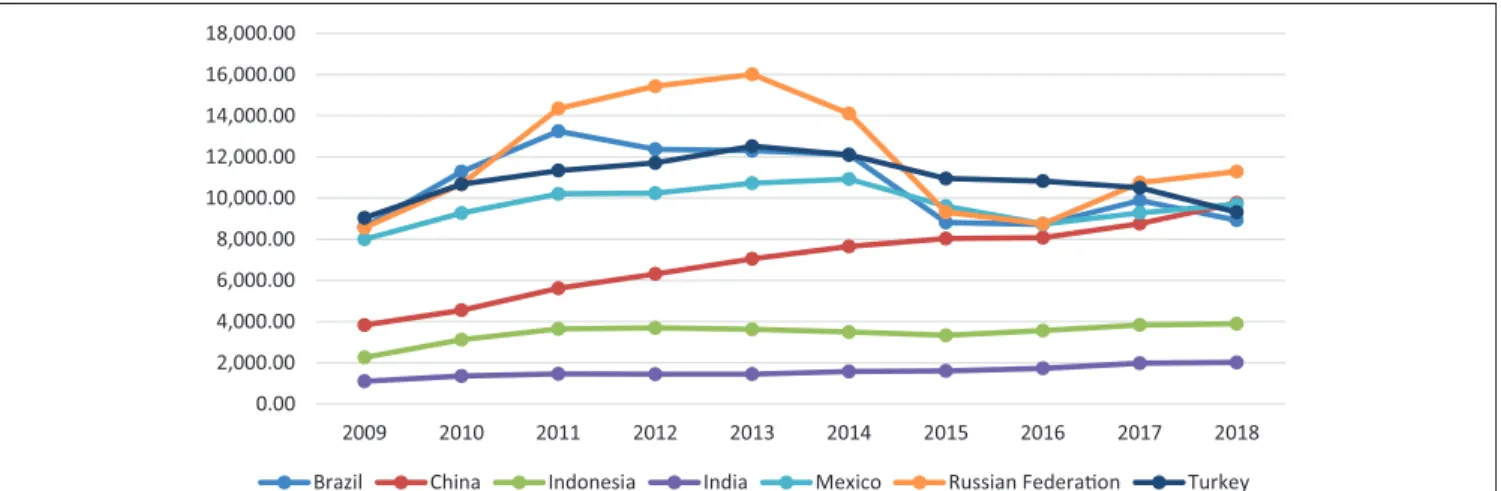
E7 economies consist of Brazil, China, India, Indonesia, Mexico, Russia, and Turkey. They aim to have higher eco-nomic development. To reach this objective, they take many different actions, such as giving tax or location incentives to the investors to make investment. On the contrary, it is known that economic growth does not always eliminate inequality in the country. Therefore, to understand the level of inequality in the country, many different factors need to be addressed together. GDP for capita data of E7 countries over the years is given in Figure 1.
Figure 1 indicates that GDP per capita data of India and Indonesia are much lower than other E7 countries. Another significant point in this figure is that this value has a very increasing trend in China. Russia was the best country for this variable for the periods between 2011 and 2014. However, because of the sharp devaluation of Russian Ruble in 2014, this variable decreased very much. However, in the last year, Russia has once again become the country with the highest GDP per capita value.
Literature Review for the Determinants
of Economic Inequality
The concept of economic equality includes both equality of income and equality of wealth. In other words, if there is an inequality in any of the income or wealth, it indicates that there is economic inequality in that country. An important part of the studies examining the issues affecting economic inequality in the literature focused on income inequality. However, it is seen that many studies address the issue of wealth inequality. In this part of the article, the current and important ones in the mentioned studies will be explained according to the subject headings below.
In a significant part of the studies, it is stated that there is a very important relationship between fair taxation of the state and economic equality. Within this framework, Oishi
et al. (2018), Nallareddy et al. (2018), and Lundberg and Waldenström (2018) tried to understand the main indicators of economic inequality and mainly concluded that any decrease in corporate tax leads to higher income inequality. On the other side, Piketty and Cantante (2018), Mattauch et al. (2018), Milanovic (2016), and Saez and Zucman (2016) underlined that there should be tax for the wealth of the peo-ple to have economic equality. Wealth tax covers all assets of taxpayers in the form of securities, real estate, cash, and receivables (De Nardi & Yang, 2016; Killewald et al., 2017; Piketty; 2014). Moreover, Alvaredo et al. (2017) also indi-cated that wealth returns are growing faster than economies, and this situation significantly increases the difference between rich and poor. In addition, Kaymak and Poschke (2016) and Boserup et al. (2016) are also other studies which focused on fair taxation implementation, such as wealth tax to solve economic inequality in the countries.
Some researchers have also focused on the emphasis on the development of the financial system in the country and economic inequality. In this context, there are different views in the literature. A significant part of the studies argues that the development in the financial system increases the eco-nomic inequality (Garbinti et al., 2018; Kacperczyk et al., 2019; Van Velthoven et al., 2019). In this context, Erauskin and Turnovsky (2019), Turegano and Herrero (2018), and Leong et al. (2018) emphasized that liberal policies are fol-lowed for the development of financial system. This situa-tion causes uncontrolled growth of the financial system in the country (Blau, 2018; Chiu & Lee, 2019; Khan et al., 2018). Uncontrolled growing financial system also carries many risks, thus becoming an important threat for the national economy (Jauch & Watzka, 2016; Lee et al., 2018). This is accepted as the main reason of the financial crises in the world in recent years. De Haan and Sturm (2017) also identified that this situation leads to an increase in income
inequality in the country. Furthermore, Hartmann et al. (2017) determined that economic complexity is an important determinant of income inequality.
In some of the studies, the relationship between the devel-opment of the financial system in the country and economic inequality is discussed from a different perspective. For example, Park and Shin (2017), Lusardi et al. (2017), and Domanski et al. (2016) defined that financial development is very important for the economic development of the country. This is because a money stream is provided from the fund provider to the fund seeker. Thus, to some extent, financial development is thought to reduce economic inequality. However, after some point, if this development in the finan-cial system is not controlled, this will affect income inequal-ity in the country. In other words, these authors argue that if the development of the financial system can be controlled, it has a significant contribution to the economic equality. However, in case of not having effective control on the finan-cial system, it leads to income and wealth equality.
Some researchers have argued that regional differences in the country can also lead to economic inequality. For instance, Hertz and Silva (2018) and Ceddia (2019) tried to identify which factors are significant for income and wealth inequality in the countries. For this purpose, they made an analysis for the United States and Latina American countries. They concluded that rising national inequality is driven by rising inequality within both urban and rural areas. On the other side, Tammaru et al. (2020) and Vakulabharanam and Motiram (2018) made a similar analysis for different country groups. They determined that investment differences in dif-ferent regions of the country can cause income inequality. Therefore, governments should implement necessary poli-cies for the development of less developed regions. The sig-nificance of this situation was also underlined by Florida and Mellander (2016). In addition to these studies, Alam and
0.00 2,000.00 4,000.00 6,000.00 8,000.00 10,000.00 12,000.00 14,000.00 16,000.00 18,000.00 2009 2010 2011 2012 2013 2014 2015 2016 2017 2018
Brazil China Indonesia India Mexico Russian Federa on Turkey
Figure 1. GDP per capita of E7 countries (current US$).
Source. World Bank.
Paramati (2016) also stated that tourism development in the country leads to income inequality especially for the devel-oping economies. The main reason is that certain groups interested in tourism in the country will earn a lot of income compared with others and this situation will increase the income inequality in the country.
Entrepreneurship is another concept in the literature which can affect economic inequality. In this framework, Halvarsson et al. (2018) and D’Onofrio and Giordani (2019) made a study to understand this relationship. They mainly reached the conclusion that entrepreneurship has a polarizing effect on inequality. In other words, they argue that entrepre-neurship leads to higher income inequality in the country. On the other side, Kaulihowa and Adjasi (2018) and Aghion et al. (2018) identified that the type of the investment is important for this situation. They state that direct investment reduces economic inequality by creating employment, decreasing poverty, and developing the industries, such as education and health. On the other side, they defined that portfolio investment can cause income inequality. In addition to these studies, Zhou and Shaw (2019), Caminada et al. (2019), and Chu and Cozzi (2018) also underlined the sig-nificance that government should make necessary regula-tions to minimize the negative impacts of the entrepreneurship on the income inequality.
In addition, in some of the studies, it was stated that the education system will affect the economic inequality in the country. In this context, Coady and Dizioli (2018), Qazi et al. (2018), and Esposito and Villaseñor (2018) made an evalua-tion related to this subject for different regions, such as Pakistan and Mexico. They identified that making invest-ment on the education lowers income inequality. Furthermore, Maliti (2019) stated that the vast majority of individuals in the society find employment according to their level of edu-cation. In other words, their educational level has an effect on their salaries. Therefore, if people cannot benefit from the education service in a fair way, this situation causes eco-nomic inequality in the country in the long term. Moreover, Torraco (2018) and Milanovic (2016) identified that to elimi-nate the economic inequality in the country, first of all, equality of opportunity in education should be ensured by the government. Also, Goldrick-Rab et al. (2016), Killewald et al. (2017), and Uslaner and Rothstein (2016) concluded that there should be public education. They stated that educa-tion in private schools causes differences between children, and this situation separates the society.
On the contrary, the relationship between effective health system and economic equality was also discussed by many different researchers. Christopher et al. (2018) tried to explain this issue for United States. They mainly concluded that all citizens should reach necessary health care services. Maskileyson (2019) and Vahedi et al. (2018) stated that if people with low income pay their own medi-cal expenses, this will be a major burden on the budget of them. This situation causes poor people becoming poorer
which increases income inequality among citizens in the country. Similar to these studies, Ataguba (2019) also reached the conclusion that there should be an effective universal health coverage to minimize economic inequal-ity in the country.
Some researchers also emphasized the significance of political and governmental issues for economic inequality. Within this framework, Frank (2019), Thomas (2019), and Graafland and Lous (2018) defined that the development of the legal system in a country contributes to the reduction of income inequality in that country. Parallel to these studies, Friesen (2020) and Piketty and Cantante (2018) also deter-mined that government should make necessary regulation to increase the effectiveness of the legal system so that eco-nomic inequality can be decreased. On the other side, Leong et al. (2018), Ippolito and Cicatiello (2019), and Uslaner (2019) also defined that corruption has an increasing role on income inequality. Moreover, Alvaredo et al. (2017), Scheve and Stasavage (2017), and Grotti and Scherer (2016) deter-mined that there should be higher democratic transparency for this purpose. Similarly, Killewald et al. (2017) argued that if there is no democratic transparency, investors will be unwilling to make new investments. Because this situation decreases job opportunities, it leads to higher economic inequality. Also, Kaymak and Poschke (2016) underlined the importance of social transfer policies of the government to manage the problem of economic inequality.
Finally, unlimited asset ownership and inequality of labor incomes are accepted as important determinants of eco-nomic inequality. In this framework, Milanovic (2016) and Garbinti et al. (2017) discussed that unless everyone has unlimited assets, there is a gain without labor. This will lead to differentiation of income levels among people. Therefore, certain restrictions should be imposed on the asset owner-ship of persons with the aim of decreasing economic inequality. On the other side, Alvaredo et al. (2017), Aguiar and Bils (2015), and Benhabib et al. (2017) made a study related to this issue. They reached the conclusion that inequality in labor incomes is the main cause of the eco-nomic inequality of the country. If labor incomes are not defined in a fair manner, saving and consumption amount of the people will not be equal. Because of these differences among people, there will be economic inequality. Hence, it is important that the government makes the necessary legal arrangements on this issue.
It is identified that there are lots of studies in the literature regarding economic equality. These studies mainly aim to understand the indicators of income and wealth inequality. For this purpose, these researchers considered different methodologies, such as regression and Granger causality analysis. It is obvious that a new study could be very helpful in which both financial and nonfinancial determinants of economic equality are taken into consideration. In addition, different methodology should be used to make this evalua-tion. In this study, IT2 fuzzy DEMATEL, IT2 fuzzy MOORA
methods, and IT2 fuzzy TOPSIS are considered first to understand the main determinants of economic equality. Also, with the help of fuzzy logic, both financial and nonfi-nancial issues can be considered.
Method
In this study, IT2 fuzzy DEMATEL approach is used to iden-tify the significance of the dimensions and criteria that lead to economic inequality. On the other side, to understand the relative performance of E7 countries with respect to eco-nomic equality, IT2 fuzzy MOORA and IT2 fuzzy TOPSIS methods are taken into consideration. In this section of the study, the theoretical information of these two methods is given.
IT2 Fuzzy DEMATEL
DEMATEL approach tries to define the weighted signifi-cance of the criteria. Moreover, it is also possible to identify the causal relationship of these factors with the help of this model (Tooranloo et al., 2017; Wang et al., 2019). In the lit-erature, it can be seen that DEMATEL approach can be con-sidered with classical and IT2 fuzzy logic. First of all, the evaluations of the experts related to the dimensions and cri-teria are obtained. After that, these evaluations are converted to the fuzzy sets. In the second step of this evaluation pro-cess, initial direct relation matrix is generated with Equations (1) and (2):
Z
z
z
z
z
z
z
n n n n=
0
0
0
12 1 21 2 1 2
,
(1) Z Z Z Z Z n n = 1+ 2+ 3+ + . (2) Third, this matrix is normalized by using Equations (3), (4), and (5): X x x x x x x x x x n n n n nn = 11 12 1 21 22 2 1 2 , (3)
x
z
r
Z
r
Z
r
Z
r
Z
r
H z
H z
ij ij a b c d ij U ij U ij ij ij ij=
=
( ) ( )
´ ´ ´ ´,
,
,
;
1,
2
( ) ( )
,
,
,
,
;
,
Z
r
Z
r
Z
r
Z
r
H z
H z
e f g h ij L ij L ij ij ij ij ´ ´ ´ ´ 1 2
,
(4) r i n Z Z j n d i nj n d ij ij = ≤ ≤ = ≤ ≤ =∑
∑
max max1 max
1 1 1
´ , ´ .
(5) The fourth step includes the generation of the total influ-ence fuzzy matrix. Equations (6) to (10) are taken into con-sideration in this process:
X a a a a a a a n n n n ′= 0 0 0 12 1 21 2 1 2 ’ ’ ’ ’ ’ ’ = ′ , ,… X h h h h h h h n n n n 0 0 0 12 1 21 2 1 2 ’ ’ ’ ’ ’ ’ , (6) T X X X k k = + + + → lim , ∞ 2 (7) T t t t t t t t t t n n n n nn = 11 12 1 21 22 2 1 2 , (8) t a b c d H t H t e f ij ij ij ij ij ijU ijU ij =
(
’’ ’’ ’’ ’’( ) ( )
)
’’ , , , ; , , , 1 2 ’’’ ’’ ’’ ij ij ij ij L ij L g h H t H t , , ; 1( ) ( )
, 2 ,(
)
(9) a’’ij Xa I Xa h’’ij Xh I Xh = ′× −(
′)
−1 = ′× −(
′)
−1 , , . (10)Finally, Equations (11) and (12) are used to calculate the influence degrees:
Di t j n ij n = = ×
∑
1 1 , (11) Ri t i n ij n = = ×∑
1 1 ’ . (12) In these equations, the sum of all vector rows is repre-sented by Di. Moreover, Ri gives information about thesum of all vector columns. Hence, the total degree of the influence among criteria is demonstrated as (Di +Ri). In the
next phase, Equations (13) to (16) are used for the defuzzifi-cation process: DefT U U U U U U U U U L L L L L u l m l m l l u l m l = −
(
)
+(
× −)
+(
× −)
+ +(
−)
+ × − β α β 1 2 1 4((
)
+(
× −)
+ αL L L L m l l 2 4 2 , (13) DefT ij n n T t i j n = = = … × , , 1 2, , , , (14) Di r t r r r r j n ij n i n i n def = = =( )
=(
… …)
= × ×∑
1 1 1 1, , , , , (15) Ridef y t y y y y i n ij n j n i n = = =( )
=(
… …)
= × ×∑
1 1 1 1 ’ ’ , , , , . (16)IT2 fuzzy DEMATEL was considered in the studies for different purposes. For instance, Abdullah and Zulkifli (2015) and Tooranloo et al. (2017) focused on the effective-ness of the human resource management process by using this method. In addition, Hosseini and Tarokh (2013) com-bined this method with others in their studies. Also, Zargar et al. (2011) evaluated technology acceptance model, Çelik and Akyüz (2016) focused on the effectiveness of the mari-time transportation, Pishdar (2015) considered this approach for strategy selection, and Dinçer et al. (2019) evaluated the financial services by IT2 fuzzy DEMATEL.
IT2 Fuzzy MOORA
The MOORA is mainly used to reach the solution under the complex environment. The main benefit of this approach by comparing with the similar ones is that both positive and negative factors can be considered in the analysis process. Hence, this method ranks different alternatives based on these criteria (Brauers & Zavadskas, 2006). First, the
decision matrix is created by considering the opinions of the experts (E). This matrix is demonstrated on Equation (17). In this matrix, Am gives information about different alternatives, whereas Cn represents the criteria:
C1 C2 C3 . . . Cn X A A A A x x x x x x x x x x x x x ij m n n n = 1 2 3 11 12 13 1 21 22 23 2 31 32 33 3 m m1 xm2 xm3 xmn . (17)
In this process, there are k different decision makers and evaluations of them are calculated by looking at Equation (18): x k x i m ij e n ij e = = … =
∑
1 1 , 1 2 3, , , , . (18)Second, the defuzzified values are calculated with Equations (19) to (22). In these equations, M Ap(ij)
indi-cates the average of the elements aipj and a i p
j
( +1). On the
other side, S Aq(ij) gives information about the standard
deviation of these elements. In addition, H Ap(ij) shows the
membership value: Def x Rank x M A M A M A M A ij ij m n i U i L i U i L
( )
=( )
=( )
+( )
+( )
+( )
× 1 1 2 2 ++( )
+( )
−( )
+( )
+( )
+( )
+ M A M A S A S A S A S A i U i L i U i L i U i L 3 3 1 1 2 2 1 4 SS A S A S A S A H A H A i U i L i U i L i U 3 3 4 4 1 1 ( )
+( )
+( )
+( )
+( )
+ ii L i U i L H A H A( )
+ 2( )
+ 2( )
, (19) Mp Aij a a ip j i p j ( )
= + ( +1), 2 (20) S Aq ij a a k q q ik j k q q ik j ( )
= − = + = +∑
∑
1 2 1 2 1 1 2 , (21)where S Aq(ij) is the standard deviation of the elements aiq j and ai qj( +1), 1 ≤ ≤q 3, S Aij a a k ikj k ikj 4 1 4 1 4 2 1 4 1 4
( )
= − = =∑
∑
. (22)The normalization of the defuzzified decision matrix is occurred in the next stage by using Equation (23):
X X X ij ij ij j m * = =
∑
2 1 . (23)On the other side, the positive and negative effects are computed in the fourth step with Equation (24):
Yi X X j h ij j h n ij = − = = +
∑
∑
1 1 * *. (24) In addition, the weighted values are computed in the fifth step. For this purpose, Equation (25) is considered:yi w x w x j h j ij j h n j ij *= *− * = = +
∑
∑
1 1 . (25)In the final step, alternatives are ranked. Fuzzy MOORA approach was preferred for different purposes, such as indus-trial engineering sector selection (Akkaya et al., 2015), per-formance evaluation of airline industry (Dinçer et al., 2017), materials selection (Hafezalkotob et al., 2016), and the best fuel selection (Erdoğan et al., 2019). On the contrary, the studies that considered IT2 fuzzy MOORA are limited in the literature (Dinçer et al., 2019; Dorfeshan et al., 2018; Stanujkic, 2016).
IT2 Fuzzy TOPSIS
TOPSIS methodology is another multi-criteria decision-making model. This approach is mainly used to select the best alternatives among different possibilities. In the analysis process of this model, the best and worst ideal solutions are determined to reach the objective (Hwang & Yoon, 1981). In the first stage of the analysis, the fuzzy positive and negative ideal solutions (A A+, −) are calculated. In this process,
Equation (26) is considered:
A+=max
(
v v v1, , , ,2 3 vn)
, A−=min(
v v v1, , , ,2 3 vn)
.(26) After that, D+ and D− values are computed with Equations (27) and (28): Di v A i m i i + = + =
∑
(
−)
1 2 , (27) Di v A i m i i − = − =∑
(
−)
1 2 . (28)In the last stage of the analysis, different alternatives are ranked. To reach this purpose, closeness coefficient (CCi) value is calculated with the help of Equation (29):
CCi i i i D D D = + − + −. (29)
TOPSIS methodology is very popular in the literature. Samaie et al. (2020) used this method regarding the develop-ment of the electric vehicles in Tehran. Also, Kaul et al. (2020) tried to select the best television channel by using fuzzy TOPSIS. Huseyinov and Tabak (2020) evaluated the computer algebra systems. In this study, a comparative anal-ysis was made by using both fuzzy analytic hierarchy pro-cess (AHP) and fuzzy TOPSIS.
An Application on E7 Economies
Important factors of the income inequality are aimed to be identified in this study. Therefore, the analysis process con-sists of three different steps. First of all, the dimensions and criteria, which influence income inequality, are determined based on literature review. In the second step, IT2 fuzzy DEMATEL is used to find the most significant factors of economic equality. In the final step, E7 countries are evalu-ated with IT2 fuzzy MOORA and IT2 fuzzy TOPSIS.
Identifying Criteria List
The analysis is constructed by selecting the items for measur-ing economic equality. For this purpose, four dimensions and 12 criteria are defined for analyzing the economic equality of the emerging economies. Table 1 represents the list of dimen-sions and criteria for measuring the economic equality.
Experts’ opinions are used for measuring the relative impor-tance of each criterion and alternative. For that, linguistic scales Table 1. List of the Dimensions and Criteria Regarding Economic Equality.
Sociopolitical (Dimension 1) Financial (Dimension 2) Budgeting (Dimension 3) Governmental (Dimension 4) Democratic transparency (C1) Financial development (C4) Educational equality (C7) Social transfer policies of government (C10) Inequality of labor incomes (C2) Entrepreneurship (investment) (C5) Fair taxation (income and wealth) (C8) Regional differences (C11)
and their IT2 fuzzy numbers are used for the dimensions, crite-ria, and alternatives. Tables A1 and A2 in the appendix part present the linguistic scales and fuzzy numbers for the factors and alternatives, respectively. Three experts made evaluations based on the linguistic scales. Tables A3 to A7 in the appendix part illustrate the evaluations. Decision makers also give their linguistic choices for each alternative with respect to the crite-ria. Table A8 shows the evaluation results to construct the deci-sion matrix. By considering the linguistic evaluations, the fuzzy evaluations are obtained to weight and rank the items. Hence, linguistic evaluations are turned into IT2 fuzzy num-bers, and analysis results are summarized in the following sec-tion accordingly.
Weighted Results of Dimensions and Criteria
First, the direct relation matrix is created with the average values of decision makers’ choices. Table A9 indicates the direct relation matrix. After that, normalized matrix is cre-ated. Moreover, Table A10 illustrates the analysis results of this issue. Total relation fuzzy matrix is created which is given in Table A11. At the final step, the defuzzification pro-cedure is employed for obtaining the impact-relation degrees of the dimensions and criteria as well as the weights of them. Table 2 gives the defuzzified values and the weighting results of the dimensions.
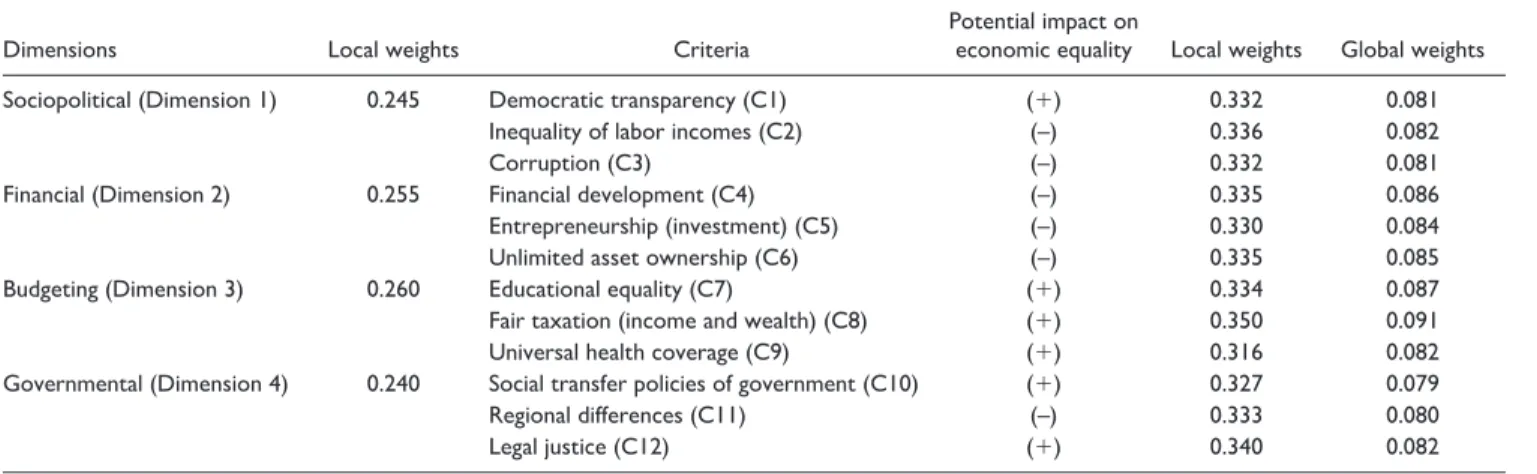
Similar procedure is also applied for the criteria of each dimension separately and then local and global results of the criteria are provided as seen in Table 3.
According to the results, budgeting (Dimension 3) is the most important dimension, while governmental issue (Dimension 4) has the weakest importance among the dimen-sion set. In addition, fair taxation (Criterion 8) has the high-est weight in the criteria. In addition, educational equity (C7) and financial development (C4) are other significant issues that affect economic inequality of E7 economies. On the other side, social transfer policies of government (Criterion 10) has relatively the lowest degree of importance in the global weighting results.
Ranking E7 Economies for Economic Equality
At the second stage of the analysis, linguistic evaluations are converted into the IT2 fuzzy numbers, and Table A12 gives the averaged values of decision matrix for the emerging economies. Ranking method is considered to apply the defuzzification procedure. The results are shown in Table A13. After the defuzzified values of decision matrix, dimen-sionless numbers of the matrix are calculated to get the ben-efit and cost criteria of dataset. Table A14 presents the results of the dimensionless numbers. At the final step, benefit and cost criteria are computed by using the weighted matrix Table 2. Defuzzified Total Relation Matrix and the Weights for the Dimensions.
Dimensions D1 D2 D3 D4 r y r + y r – y Weights D1 0.23 0.27 0.24 0.36 1.11 1.85 2.97 –0.74 0.24 D2 0.59 0.26 0.38 0.58 1.81 1.28 3.09 0.53 0.26 D3 0.65 0.49 0.25 0.64 2.04 1.11 3.15 0.92 0.26 D4 0.38 0.26 0.24 0.22 1.10 1.81 2.91 −0.71 0.24
Table 3. Dimension and Criterion Weights.
Dimensions Local weights Criteria Potential impact on economic equality Local weights Global weights
Sociopolitical (Dimension 1) 0.245 Democratic transparency (C1) (+) 0.332 0.081
Inequality of labor incomes (C2) (–) 0.336 0.082
Corruption (C3) (–) 0.332 0.081
Financial (Dimension 2) 0.255 Financial development (C4) (–) 0.335 0.086
Entrepreneurship (investment) (C5) (–) 0.330 0.084
Unlimited asset ownership (C6) (–) 0.335 0.085
Budgeting (Dimension 3) 0.260 Educational equality (C7) (+) 0.334 0.087
Fair taxation (income and wealth) (C8) (+) 0.350 0.091
Universal health coverage (C9) (+) 0.316 0.082
Governmental (Dimension 4) 0.240 Social transfer policies of government (C10) (+) 0.327 0.079
Regional differences (C11) (–) 0.333 0.080
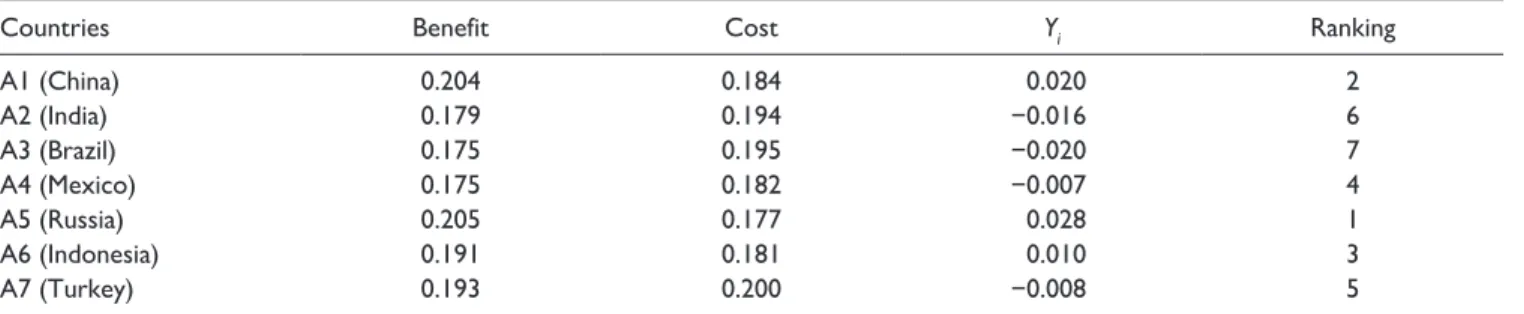
values. And then, the values of Yi are calculated to rank the alternatives. Table 4 shows the ranking results of each alternative.
Ranking results demonstrate that Russia (Alternative 5) is the best in the performance results of economic equality. Furthermore, China (Alternative 1) and Indonesia (Alternative 6) are other successful countries according to economic equality performance. On the contrary, Brazil (Alternative 3) has the worst seat among the emerging econ-omies. Moreover, India (Alternative 2) and Turkey (Alternative 7) are other countries that have lower perfor-mance for this issue in comparison for the others. This analy-sis is also made by using IT2 fuzzy TOPSIS. The results are given in Table 5.
Table 5 indicates that ranking results of IT2 fuzzy MOORA are the same with the results of IT2 fuzzy TOPSIS. This situation gives an idea about the appropriateness of the ranking results.
Robustness Check With G7 Countries
After that, robustness check of the analysis results is per-formed. In this study, E7 economies are taken into consider-ation. In the first stage, the criteria list is created, and these items are weighted. In the final stage, E7 economies are ranked based on these weighted criteria. In this part of the study, robustness check of these ranking results is made. For this purpose, G7 economies and E7 economies are ranked together by using both IT2 fuzzy MOORA and IT2 fuzzy
TOPSIS according to these criteria. G7 countries have the biggest economies which are the United States, the United Kingdom, Italy, France, Germany, Japan, and Canada. Input data are given in Table A15, whereas the ranking results are given in Tables 6 and 7.
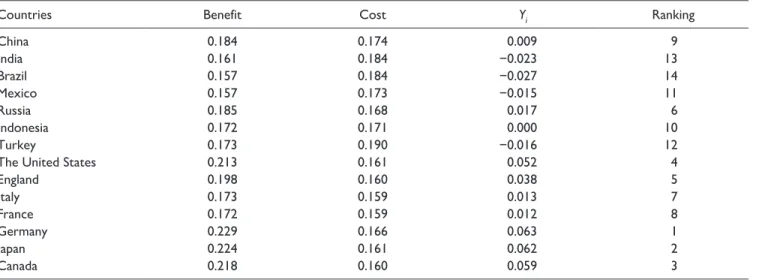
These tables give information that G7 economies are bet-ter than E7 economies with respect to the economic equality. This situation explains that the criteria are selected appropri-ately in this study. The main reason is that the countries, which have better macroeconomic conditions, take the best places by calculating with IT2 fuzzy multi-criteria decision-making methodologies. Another important conclusion of these tables is that the results of both IT2 fuzzy TOPSIS and IT2 fuzzy MOORA are almost similar.
Discussion and Conclusion
In this study, the main causes of economic inequality in E7 countries are tried to be determined. In this context, the analysis process consists of three different stages. In the first stage of the analysis, the studies in the literature were exam-ined in detail and 12 different criteria that could affect eco-nomic inequality were determined. In the second stage, these items are evaluated by IT2 fuzzy DEMATEL method according to their importance. In the final stage of the analy-sis process of the study, E7 countries were ranked according to their economic equality success. In this process, IT2 fuzzy MOORA and IT2 fuzzy TOPSIS methods are considered.
Table 4. Ranking Results With IT2 Fuzzy MOORA.
Countries Benefit Cost Yi Ranking
A1 (China) 0.204 0.184 0.020 2 A2 (India) 0.179 0.194 −0.016 6 A3 (Brazil) 0.175 0.195 −0.020 7 A4 (Mexico) 0.175 0.182 −0.007 4 A5 (Russia) 0.205 0.177 0.028 1 A6 (Indonesia) 0.191 0.181 0.010 3 A7 (Turkey) 0.193 0.200 −0.008 5
Note. IT2 = interval type 2; MOORA = Multi-Objective Optimization by Ratio Analysis.
Table 5. Ranking Results With IT2 Fuzzy TOPSIS.
Countries D+ D− Ci Ranking A1 (China) 0.270 0.441 0.621 2 A2 (India) 0.418 0.221 0.346 6 A3 (Brazil) 0.429 0.216 0.335 7 A4 (Mexico) 0.403 0.297 0.424 4 A5 (Russia) 0.162 0.468 0.743 1 A6 (Indonesia) 0.269 0.336 0.555 3 A7 (Turkey) 0.370 0.246 0.399 5
According to the results of IT2 fuzzy DEMATEL, fair taxation has the greatest effect on the economic inequality of a country. In addition, the equality of education provided by the state and the uncontrolled growth of financial markets are other important factors. However, it was understood that the social transfer policies of the states and regional differences have the lowest importance. As a result of the analysis using IT2 fuzzy MOORA method, it is concluded that Russia and China are the most successful countries in terms of economic equality. Indonesia and Mexico are the other countries located in the upper row in this context. On the contrary, India and Brazil have the worst performances. This situation is also quite similar with the results of IT2 fuzzy TOPSIS. Furthermore, a robustness check is also performed by includ-ing both G7 and E7 economies together in the analysis
process. The results demonstrate that the countries, which have better macroeconomic conditions, take the best places.
Another important point is that the countries, which have highest GDP per capita value, have the highest performance related to economic equality. In other words, it can be said that the results of this study demonstrate the parallel issues regarding this macroeconomic value. This situation is also similar with respect to the inflation rate. Russia and China are the best countries in this study regarding economic equal-ity, and these countries have also the minimum inflation rates in 2018 (2.87% and 2.07%). On the other side, according to World Bank data, Brazil has the highest unemployment rate (12.21%) in 2019 among these seven countries. Similar to this situation, this country has the lowest performance in the ranking of economic inequality by IT2 fuzzy MOORA and Table 6. Ranking Results for E7 and G7 Countries With IT2 Fuzzy MOORA.
Countries Benefit Cost Yi Ranking
China 0.184 0.174 0.009 9 India 0.161 0.184 −0.023 13 Brazil 0.157 0.184 −0.027 14 Mexico 0.157 0.173 −0.015 11 Russia 0.185 0.168 0.017 6 Indonesia 0.172 0.171 0.000 10 Turkey 0.173 0.190 −0.016 12
The United States 0.213 0.161 0.052 4
England 0.198 0.160 0.038 5 Italy 0.173 0.159 0.013 7 France 0.172 0.159 0.012 8 Germany 0.229 0.166 0.063 1 Japan 0.224 0.161 0.062 2 Canada 0.218 0.160 0.059 3
Note. IT2 = interval type 2; MOORA = Multi-Objective Optimization by Ratio Analysis.
Table 7. Ranking Results for E7 and G7 Countries With IT2 Fuzzy TOPSIS.
Countries D+ D− Ci Ranking China 0.483 0.441 0.477 7 India 0.659 0.221 0.251 13 Brazil 0.695 0.216 0.237 14 Mexico 0.663 0.297 0.309 11 Russia 0.438 0.468 0.516 6 Indonesia 0.535 0.336 0.386 10 Turkey 0.587 0.246 0.295 12
The United States 0.173 0.651 0.790 4
England 0.290 0.556 0.657 5 Italy 0.527 0.471 0.472 8 France 0.512 0.434 0.459 9 Germany 0.139 0.749 0.843 2 Japan 0.116 0.727 0.862 1 Canada 0.136 0.695 0.836 3
IT2 fuzzy TOPSIS. As a result, it can be concluded that anal-ysis results of this study are quite coherent with the macro-economic data of these countries.
Considering the findings, the taxation system must be fair to eliminate the economic inequality. In this context, it is important that the authorities make the necessary legal arrangements. Taxes are mainly handled in two groups as indirect and direct taxes. Taxes related to expenditure are called as indirect taxes, whereas taxes related to income and wealth are named as direct taxes. As can be seen here, the burden on indirect taxes is predominantly on people in the middle- and low-income groups. In this framework, reducing the share of indirect taxes in particular will contribute to the reduction of economic inequality in the country. On the con-trary, with the increase in the share of direct taxes, there will be fund transfers from the rich to middle- and low-income groups, which provides higher economic equality. Within this context, it will be possible to reduce this problem for E7 countries with the application of wealth tax to be imposed on people’s securities, real estate, and cash assets.
This topic was also discussed by different people. For instance, Emran and Stiglitz (2005) focused on the effects of indirect tax reforms in developing countries. In this study, doubts related to these reforms were explained. They mainly argue that so as to minimize economic inequality, indirect tax burden should be reduced. In addition, Bibi and Duclos (2007) tried to make an analysis related to the indirect tax reforms on Tunisia. They also highlighted the importance of decreasing indirect tax to reduce poverty. Moreover, Piketty et al. (2013) claimed that the distribution of income and wealth has deteriorated in favor of capital and against labor especially after the world wars. Therefore, they propose a global wealth tax to improve this situation. Lundberg and Waldenström (2018) also reached the similar conclusion. On the other side, there are also criticisms related to the wealth tax. For example, Viard (2019), Villios (2012), and Rakowski (2000) indicated that wealth tax has a decreasing effect on the economic performance of the countries.
Based on the results of this study, it is understood that E7 countries should establish an effective education system to reduce economic inequality. The education of the individuals is decisive in terms of their future professions and their income. In this context, it is important that states offer equal education opportunities to all citizens in the country. Especially the children of middle- and low-income families should receive the necessary education without any financial burden, which will positively affect their future income. For
this process to be carried out more effectively, it is important that policy makers make the necessary legal arrangements. This situation will play an important role in reducing the eco-nomic inequality in the country.
Neoliberal policies on economic inequality associate with the deregulation, global tendencies at trade zones, increasing the role of private sector in emerging economies. These poli-cies could lead to develop the foreign direct investments that increase the employment rate and production. However, these regulations could also dramatically raise the portfolio investments that affect the financial system. If the funds from the portfolio investments are used for the long-term produc-tion of real sector, the economic equality of emerging coun-tries could be provided due to the sustainable production potential. Accordingly, to prevent economic inequality in E7 countries, the financial system in these countries should not grow uncontrollably. The financial system plays an impor-tant role in the efficient flow of funds in the country. For this reason, maintaining the existence of the financial system in a healthy way is important for the economic development of the country. However, the uncontrolled growth of the finan-cial system in this process increases the risks in the system considerably. Therefore, legal authorities should make the necessary arrangements and prevent excessive risk of finan-cial system in the country. In this way, the finanfinan-cial system in the country can be maintained in a healthy manner. This will contribute to the reduction of economic inequality.
In this study, the main causes of economic inequality in E7 countries are analyzed. Within this framework, a comprehen-sive research was conducted, and a list of dimensions and cri-teria affecting economic inequality was established and these factors were weighted according to their importance. One of the most important limitations is to analyze E7 and G7 coun-tries comparatively, and another limitation is to apply a hybrid decision-making approach based on the IT2 fuzzy sets. However, for future studies, the criteria and dimensions could be revised by adding different topics of economic inequality, and also different country groups such as Mexico, Indonesia, Nigeria, and Turkey (MINT) and OECD (Organisation for Economic Cooperation and Development) are used for rank-ing the performance of alternatives. Alternatively, sample countries could be widen with several country groups by the convergence and divergence of demographic specifications, such as education, health, and population. Other decision-making methods such as AHP and analytic network process (ANP) could be also applied for providing the comparative weighting results.
Appendix
Table A1. IT2 Fuzzy Numbers for Dimensions and Criteria.
Linguistic scales IT2 fuzzy numbers Very very low (VVL) ((0,.1,.1,.2;1,1), (.05,.1,.1,.15;.9,.9)) Very low (VL) ((.1,.2,.2,.35;1,1), (.15,.2,.2,.3;.9,.9)) Low (L) ((.2,.35,.35,.5;1,1), (.25,.35,.35,.45;.9,.9)) Medium (M) ((.35,.5,.5,.65;1,1), (.4,.5,.5,.6;.9,.9)) High (H) ((.5,.65,.65,.8;1,1), (.55,.65,.65,.75;.9,.9)) Very high (VH) ((.65,.8,.8,.9;1,1), (.7,.8,.8,.85;.9,.9)) Very very high (VVH) ((.8,.9,.9,1;1,1), (.85,.9,.9,.95;.9,.9))
Source. S. C. Chen and Lee (2010).
Note. IT2 = interval type 2.
Table A2. IT2 Fuzzy Numbers for the Alternatives.
Linguistic scales IT2 fuzzy numbers Very low (VL) ((0,0,0,.1;1,1), (0,0,0,.05;.9,.9)) Low (L) ((0,.1,.1,.3;1,1), (.05,.1,.1,.2;.9,.9)) Medium low (ML) ((.1,.3,.3,.5;1,1), (.2,.3,.3,.4;.9,.9)) Medium (M) ((.3,.5,.5,.7;1,1), (.4,.5,.5,.6;.9,.9)) Medium high (MH) ((.5,.7,.7,.9;1,1), (.6,.7,.7,.8;.9,.9)) High (H) ((.7,.9,.9,1;1,1), (.8,.9,.9,.95;.9,.9)) Very high (VH) ((.9,1,1,1;1,1), (.95,1,1,1;.9,.9))
Source. S. C. Chen and Lee (2010).
Note. IT2 = interval type 2.
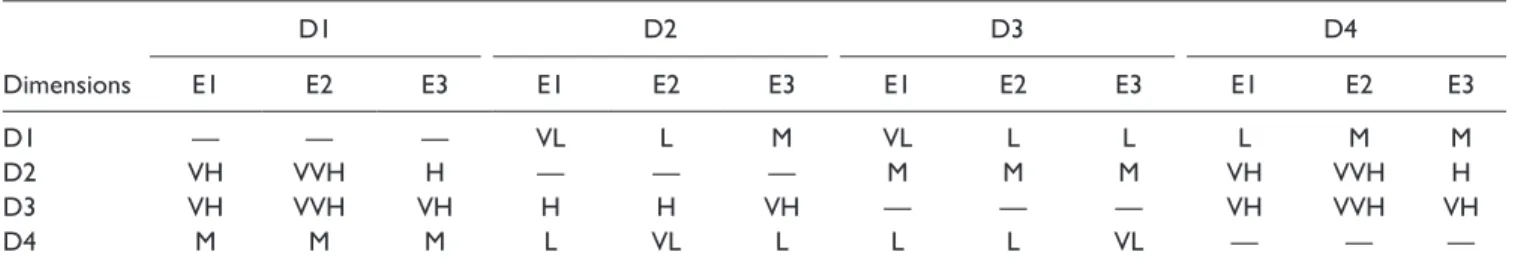
Table A3. Input Data for the Dimensions.
D1 D2 D3 D4 Dimensions E1 E2 E3 E1 E2 E3 E1 E2 E3 E1 E2 E3 D1 — — — VL L M VL L L L M M D2 VH VVH H — — — M M M VH VVH H D3 VH VVH VH H H VH — — — VH VVH VH D4 M M M L VL L L L VL — — —
Note. VL = very low; L = low; M = medium; VH = very high; VVH = very very high; H = high.
Table A4. Input Data for the Criteria of Dimension 1.
C1 C2 C3
Criteria E1 E2 E3 E1 E2 E3 E1 E2 E3
C1 — — — M M H M M H
C2 M H H — — — M H M
C3 M M H H H M — — —
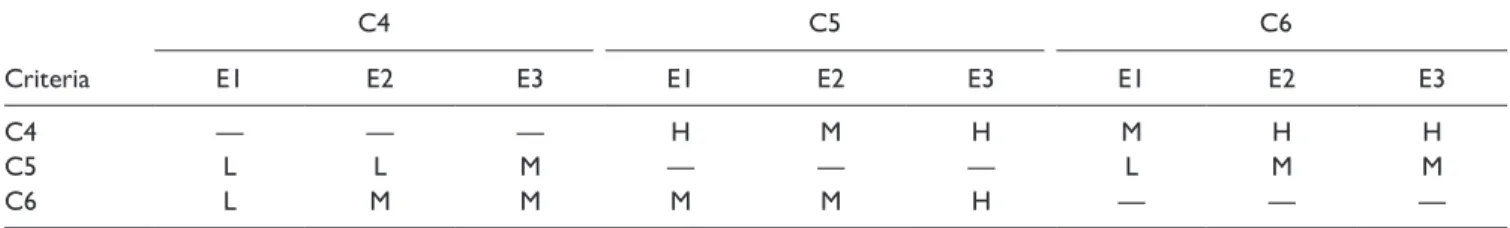
Table A5. Input Data for the Criteria of Dimension 2. C4 C5 C6 Criteria E1 E2 E3 E1 E2 E3 E1 E2 E3 C4 — — — H M H M H H C5 L L M — — — L M M C6 L M M M M H — — —
Note. H = high; M = medium; L = low.
Table A6. Input Data for the Criteria of Dimension 3.
C7 C8 C9
Criteria E1 E2 E3 E1 E2 E3 E1 E2 E3
C7 — — — M M M M M H
C8 H VH H — — — VH VVH VH
C9 L L L VL L VL — — —
Note. M = medium; H = high; VH = very high; VVH = very very high; L = low; VL = very low.
Table A7. Input Data for the Criteria of Dimension 4.
C10 C11 C12
Criteria E1 E2 E3 E1 E2 E3 E1 E2 E3
C10 — — — M M H H VH H
C11 H M M — — — H H H
C12 M M M H H M — — —
15
Table A8.
Input Data for the Alternatives.
Alternative 1 Alternative 2 Alternative 3 Alternative 4 Alternative 5 Alternative 6 Alternative 7 Criteria E1 E2 E3 E1 E2 E3 E1 E2 E3 E1 E2 E3 E1 E2 E3 E1 E2 E3 E1 E2 C1 MH M M M M MH MH MH M M M M MH M M MH MH M MH MH C2 ML M MH MH H MH MH MH M M ML M ML M MH MH M M MH MH C3 MH M MH MH MH MH MH MH M M ML M MH M MH M ML ML M M C4 M M MH ML M MH ML ML M M M MH M M MH M M M M MH C5 MH MH MH M M MH M M M MH M MH MH MH MH MH M M M MH C6 M MH M M M MH M M MH M ML M M MH M MH MH M MH H C7 M ML M M M M M M ML H H VH M ML M M MH MH M MH C8 M M MH M ML M M M M MH M MH M M MH M M MH M M C9 ML M M M M M M M M MH MH H ML M M M MH MH M MH C10 M M MH M MH M M M M MH H M M M MH M MH M M M C11 MH H MH M MH MH MH M M MH M M MH H MH MH M M MH MH C12 MH M M M ML M ML M M M MH MH MH M M MH M M M MH Note. MH = medium high; M = medium; ML = medium low.
Table A9. Direct Relation Matrix for the Dimensions.
Dimensions Dimension 1 Dimension 2 Dimension 3 Dimension 4 D1 ((0,0,0,0;1,1), (0,0,0,0;.90,.90)) (.27,.35,.35,.45;.90,.90))((.22,.35,.35,.50;1,1), (.22,.30,.30,.40;.90,.90))((.17,.30,.30,.45;1,1), (.35,.45,.45,.55;.90,.90))((.30,.45,.45,.60;1,1), D2 ((.65,.78,.78,.90;1,1), (.70,.78,.78,.85;.90,.90)) (0,0,0,0;.90,.90))((0,0,0,0;1,1), (.40,.50,.50,.60;.90,.90))((.35,.50,.50,.65;1,1), (.70,.78,.78,.85;.90,.90))((.65,.78,.78,.90;1,1), D3 ((.70,.83,.83,.93;1,1), (.75,.83,.83,.88;.90,.90)) (.60,.70,.70,.78;.90,.90))((.55,.70,.70,.83;1,1), (0,0,0,0;.90,.90))((0,0,0,0;1,1), (.75,.83,.83,.88;.90,.90))((.70,.83,.83,.93;1,1), D4 ((.35,.50,.50,.65;1,1), (.40,.50,.50,.60;.90,.90)) (.22,.30,.30,.40;.90,.90))((.17,.30,.30,.45;1,1), (.22,.30,.30,.40;.90,.90))((.17,.30,.30,.45;1,1), (0,0,0,0;.90,.90))((0,0,0,0;1,1),
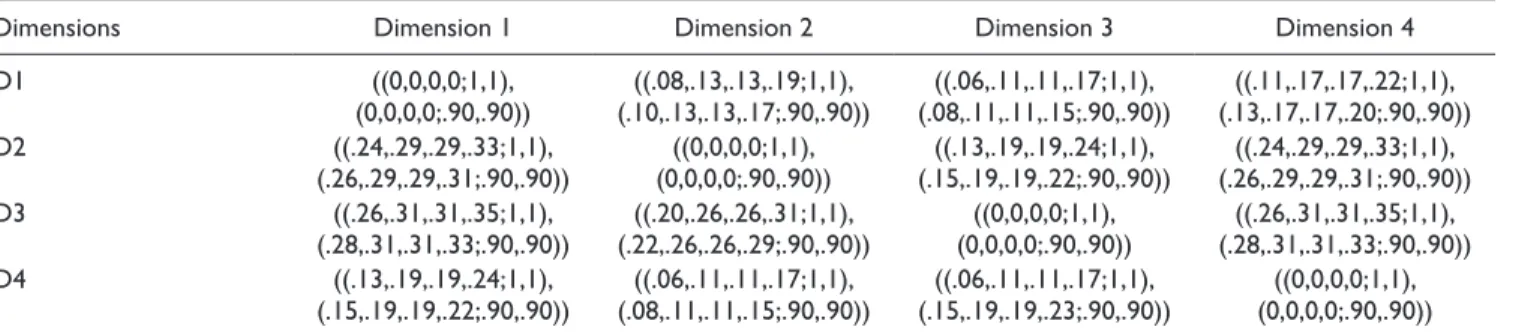
Table A10. Normalized Matrix for the Dimensions.
Dimensions Dimension 1 Dimension 2 Dimension 3 Dimension 4 D1 ((0,0,0,0;1,1), (0,0,0,0;.90,.90)) (.10,.13,.13,.17;.90,.90))((.08,.13,.13,.19;1,1), (.08,.11,.11,.15;.90,.90))((.06,.11,.11,.17;1,1), (.13,.17,.17,.20;.90,.90))((.11,.17,.17,.22;1,1), D2 ((.24,.29,.29,.33;1,1), (.26,.29,.29,.31;.90,.90)) (0,0,0,0;.90,.90))((0,0,0,0;1,1), (.15,.19,.19,.22;.90,.90))((.13,.19,.19,.24;1,1), (.26,.29,.29,.31;.90,.90))((.24,.29,.29,.33;1,1), D3 ((.26,.31,.31,.35;1,1), (.28,.31,.31,.33;.90,.90)) (.22,.26,.26,.29;.90,.90))((.20,.26,.26,.31;1,1), (0,0,0,0;.90,.90))((0,0,0,0;1,1), (.28,.31,.31,.33;.90,.90))((.26,.31,.31,.35;1,1), D4 ((.13,.19,.19,.24;1,1), (.15,.19,.19,.22;.90,.90)) (.08,.11,.11,.15;.90,.90))((.06,.11,.11,.17;1,1), (.15,.19,.19,.23;.90,.90))((.06,.11,.11,.17;1,1), (0,0,0,0;.90,.90))((0,0,0,0;1,1),
Table A11. Total Relation Fuzzy Matrix for the Dimensions.
Dimensions Dimension 1 Dimension 2 Dimension 3 Dimension 4 D1 ((.07,.20,.20,.53;1,1), (.11,.20,.20,.37;.90,.90)) (.16,.25,.25,.42;.90,.90))((.12,.25,.25,.56;1,1), (.13,.22,.22,.37;.90,.90))((.09,.22,.22,.50;1,1), (.22,.34,.34,.53;.90,.90))((.17,.34,.34,.70;1,1), D2 ((.35,.57,.57,1.01;1,1), (.42,.57,.57,.80;.90,.90)) (.13,.23,.23,.41;.90,.90))((.09,.23,.23,.57;1,1), (.23,.35,.35,.55;.90,.90))((.18,.35,.35,.71;1,1), (.41,.56,.56,.78;.90,.90))((.35,.56,.56,1.00;1,1), D3 ((.40,.63,.63,1.09;1,1), (.47,.63,.63,.86;.90,.90)) (.33,.47,.47,.68;.90,.90))((.28,.47,.47,.86;1,1), (.12,.23,.23,.40;.90,.90))((.08,.23,.23,.57;1,1), (.46,.62,.62,.85;.90,.90))((.39,.62,.62,1.07;1,1), D4 ((.19,.36,.36,.72;1,1), (.24,.36,.36,.55;.90,.90)) (.14,.23,.23,.40;.90,.90))((.10,.23,.23,.54;1,1), (.13,.22,.22,.37;.90,.90))((.09,.22,.22,.50;1,1), (.10,.19,.19,.36;.90,.90))((.07,.19,.19,.51;1,1),
17
Table A12.
Fuzzy Decision Matrix.
Criteria Alternative 1 Alternative 2 Alternative 3 Alternative 4 Alternative 5 Alternative 6 C1 ((.30,.50,.50,.70;1,1), (.40,.50,.50,.60;.90,.90)) ((.37,.57,.57,.77;1,1), (.47,.57,.57,.67;.90,.90)) ((.37,.57,.57,.77;1,1), (.47,.57,.57,.67;.90,.90)) ((.43,.63,.63,.80;1,1), (.53,.63,.63,.72;.90,.90)) ((.30,.50,.50,.70;1,1), (.40,.50,.50,.60;.90,.90)) ((.43,.63,.63,.80;1,1), (.53,.63,.63,.72;.90,.90)) (.53,.63,.63,.72;.90,.90)) C2 ((.17,.37,.37,.57;1,1), (.27,.37,.37,.47;.90,.90)) ((.30,.50,.50,.70;1,1), (.40,.50,.50,.60;.90,.90)) ((.57,.77,.77,.93;1,1), (.67,.77,.77,.85;.90,.90)) ((.43,.63,.63,.80;1,1), (.53,.63,.63,.72;.90,.90)) ((.23,.43,.43,.63;1,1), (.33,.43,.43,.53;.90,.90)) ((.37,.57,.57,.77;1,1), (.47,.57,.57,.67;.90,.90)) C3 ((.30,.50,.50,.70;1,1), (.40,.50,.50,.60;.90,.90)) ((.43,.63,.63,.80;1,1), (.53,.63,.63,.72;.90,.90)) ((.50,.70,.70,.90;1,1), (.60,.70,.70,.80;.90,.90)) ((.43,.63,.63,.80;1,1), (.53,.63,.63,.72;.90,.90)) ((.23,.43,.43,.63;1,1), (.33,.43,.43,.53;.90,.90)) ((.17,.37,.37,.57;1,1), (.27,.37,.37,.47;.90,.90)) (.47,.57,.57,.67;.90,.90)) C4 ((.50,.70,.70,.90;1,1), (.60,.70,.70,.80;.90,.90)) ((.37,.57,.57,.77;1,1), (.47,.57,.57,.67;.90,.90)) ((.30,.50,.50,.70;1,1), (.40,.50,.50,.60;.90,.90)) ((.17,.37,.37,.57;1,1), (.27,.37,.37,.47;.90,.90)) ((.37,.57,.57,.77;1,1), (.47,.57,.57,.67;.90,.90)) ((.30,.50,.50,.70;1,1), (.40,.50,.50,.60;.90,.90)) (.53,.63,.63,.72;.90,.90)) C5 ((.63,.83,.83,.97;1,1), (.73,.83,.83,.90;.90,.90)) ((.50,.70,.70,.90;1,1), (.60,.70,.70,.80;.90,.90)) ((.37,.57,.57,.77;1,1), (.47,.57,.57,.67;.90,.90)) ((.30,.50,.50,.70;1,1), (.40,.50,.50,.60;.90,.90)) ((.43,.63,.63,.80;1,1), (.53,.63,.63,.72;.90,.90)) ((.37,.57,.57,.77;1,1), (.47,.57,.57,.67;.90,.90)) (.53,.63,.63,.72;.90,.90)) C6 ((.23,.43,.43,.63;1,1), (.33,.43,.43,.53;.90,.90)) ((.37,.57,.57,.77;1,1), (.47,.57,.57,.67;.90,.90)) ((.37,.57,.57,.77;1,1), (.47,.57,.57,.67;.90,.90)) ((.37,.57,.57,.77;1,1), (.47,.57,.57,.67;.90,.90)) ((.23,.43,.43,.63;1,1), (.33,.43,.43,.53;.90,.90)) ((.43,.63,.63,.80;1,1), (.53,.63,.63,.72;.90,.90)) (.67,.77,.77,.85;.90,.90)) C7 ((.57,.77,.77,.93;1,1), (.67,.77,.77,.85;.90,.90)) ((.23,.43,.43,.63;1,1), (.33,.43,.43,.53;.90,.90)) ((.30,.50,.50,.70;1,1), (.40,.50,.50,.60;.90,.90)) ((.23,.43,.43,.63;1,1), (.33,.43,.43,.53;.90,.90)) ((.77,.93,.93,1;1,1), (.85,.93,.93,.97;.90,.90)) ((.43,.63,.63,.80;1,1), (.53,.63,.63,.72;.90,.90)) (.53,.63,.63,.72;.90,.90)) C8 ((.43,.63,.63,.80;1,1), (.53,.63,.63,.72;.90,.90)) ((.37,.57,.57,.77;1,1), (.47,.57,.57,.67;.90,.90)) ((.23,.43,.43,.63;1,1), (.33,.43,.43,.53;.90,.90)) ((.30,.50,.50,.70;1,1), (.40,.50,.50,.60;.90,.90)) ((.43,.63,.63,.80;1,1), (.53,.63,.63,.72;.90,.90)) ((.37,.57,.57,.77;1,1), (.47,.57,.57,.67;.90,.90)) (.47,.57,.57,.67;.90,.90)) C9 ((.57,.77,.77,.93;1,1), (.67,.77,.77,.85;.90,.90)) ((.23,.43,.43,.63;1,1), (.33,.43,.43,.53;.90,.90)) ((.30,.50,.50,.70;1,1), (.40,.50,.50,.60;.90,.90)) ((.30,.50,.50,.70;1,1), (.40,.50,.50,.60;.90,.90)) ((.57,.77,.77,.93;1,1), (.67,.77,.77,.85;.90,.90)) ((.43,.63,.63,.80;1,1), (.53,.63,.63,.72;.90,.90)) (.53,.63,.63,.72;.90,.90)) C10 ((.63,.83,.83,.97;1,1), (.73,.83,.83,.90;.90,.90)) ((.37,.57,.57,.77;1,1), (.47,.57,.57,.67;.90,.90)) ((.37,.57,.57,.77;1,1), (.47,.57,.57,.67;.90,.90)) ((.30,.50,.50,.70;1,1), (.40,.50,.50,.60;.90,.90)) ((.5,.7,.7,.9;1,1), (.6,.7,.7,.8;.90,.90)) ((.37,.57,.57,.77;1,1), (.47,.57,.57,.67;.90,.90)) (.47,.57,.57,.67;.90,.90)) C11 ((.30,.50,.50,.70;1,1), (.40,.50,.50,.60;.90,.90)) ((.57,.77,.77,.93;1,1), (.67,.77,.77,.85;.90,.90)) ((.43,.63,.63,.80;1,1), (.53,.63,.63,.72;.90,.90)) ((.37,.57,.57,.77;1,1), (.47,.57,.57,.67;.90,.90)) ((.37,.57,.57,.77;1,1), (.47,.57,.57,.67;.90,.90)) ((.37,.57,.57,.77;1,1), (.47,.57,.57,.67;.90,.90)) (.53,.63,.63,.72;.90,.90)) C12 ((.43,.63,.63,.80;1,1), (.53,.63,.63,.72;.90,.90)) ((.37,.57,.57,.77;1,1), (.47,.57,.57,.67;.90,.90)) ((.23,.43,.43,.63;1,1), (.33,.43,.43,.53;.90,.90)) ((.23,.43,.43,.63;1,1), (.33,.43,.43,.53;.90,.90)) ((.43,.63,.63,.80;1,1), (.53,.63,.63,.72;.90,.90)) ((.37,.57,.57,.77;1,1), (.47,.57,.57,.67;.90,.90)) (.53,.63,.63,.72;.90,.90))
Table A13. Defuzzified Decision Matrix. Alternatives C1 C2 C3 C4 C5 C6 C7 C8 C9 C10 C11 C12 A1 6.67 5.87 6.67 7.87 8.64 6.27 8.26 7.47 8.26 8.64 6.67 7.47 A2 7.07 6.67 7.47 7.07 7.87 7.07 6.27 7.07 6.27 7.07 8.26 7.07 A3 7.07 8.26 7.87 6.67 7.07 7.07 6.67 6.27 6.67 7.07 7.47 6.27 A4 7.47 7.47 7.47 5.87 6.67 7.07 6.27 6.67 6.67 6.67 7.07 6.27 A5 6.67 6.27 6.27 7.07 7.47 6.27 9.25 7.47 8.26 7.86 7.07 7.47 A6 7.47 7.07 5.87 6.67 7.07 7.47 7.47 7.07 7.47 7.07 7.07 7.07 A7 7.47 7.87 7.07 7.47 7.47 8.26 7.47 7.07 7.47 7.07 7.47 7.47
Table A14. Dimensionless Numbers.
Alternatives C1 C2 C3 C4 C5 C6 C7 C8 C9 C10 C11 C12 A1 0.353 0.312 0.361 0.426 0.436 0.334 0.419 0.402 0.426 0.443 0.345 0.402 A2 0.375 0.354 0.404 0.383 0.397 0.377 0.318 0.380 0.323 0.362 0.427 0.380 A3 0.375 0.439 0.426 0.361 0.357 0.377 0.338 0.337 0.344 0.362 0.386 0.337 A4 0.396 0.397 0.404 0.318 0.337 0.377 0.318 0.359 0.344 0.342 0.365 0.337 A5 0.353 0.333 0.339 0.383 0.377 0.334 0.469 0.402 0.426 0.403 0.365 0.402 A6 0.396 0.376 0.318 0.361 0.357 0.398 0.379 0.380 0.385 0.362 0.365 0.380 A7 0.396 0.418 0.382 0.404 0.377 0.440 0.379 0.380 0.385 0.362 0.386 0.402
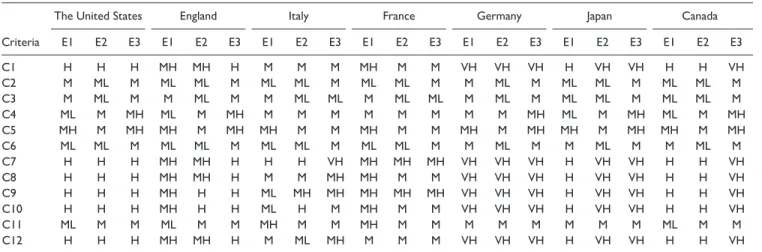
Table A15. Input Data for G7 Countries.
The United States England Italy France Germany Japan Canada
Criteria E1 E2 E3 E1 E2 E3 E1 E2 E3 E1 E2 E3 E1 E2 E3 E1 E2 E3 E1 E2 E3 C1 H H H MH MH H M M M MH M M VH VH VH H VH VH H H VH C2 M ML M ML ML M ML ML M ML ML M M ML M ML ML M ML ML M C3 M ML M M ML M M ML ML M ML ML M ML M ML ML M ML ML M C4 ML M MH ML M MH M M M M M M M M MH ML M MH ML M MH C5 MH M MH MH M MH MH M M MH M M MH M MH MH M MH MH M MH C6 ML ML M ML ML M ML ML M ML ML M M ML M M ML M M ML M C7 H H H MH MH H H H VH MH MH MH VH VH VH H VH VH H H VH C8 H H H MH MH H M M MH MH M M VH VH VH H VH VH H H VH C9 H H H MH H H ML MH MH MH MH MH VH VH VH H VH VH H H VH C10 H H H MH H H ML H M MH M M VH VH VH H VH VH H H VH C11 ML M M ML M M MH M M MH M M M M M M M M ML M M C12 H H H MH MH H M ML MH M M M VH VH VH H VH VH H H VH