Adenosine Receptor Signaling Targets Both PKA and Epac
Pathways to Polarize Dendritic Cells to a Suppressive
Phenotype
Merve Kayhan, Altay Koyas, Imran Akdemir, Ali Can Savas, and Caglar Cekic
Extracellular adenosine accumulates in tumors and causes suppression of immune cells. Suppressive adenosine signaling is achieved through adenosine A2A and A2B receptors, which are Gs coupled, and their activation elevates cAMP levels. Gs-coupled GPCR signaling causes cAMP accumulation, which plays an anti-inflammatory role in immune cells. Protein kinase A (PKA) and exchange protein directly activated by cAMP (Epac) are two intracellular receptors of cAMP. In this study we showed that adenosine receptor signaling polarizes activated murine dendritic cells (DCs) into a tumor-promoting suppressive phenotype. Adenosine receptor sig-naling activates cAMP pathway and upregulates the negative regulators of NF-kB but does not influence phosphorylation of immediate inflammatory signaling molecules downstream of TLR signaling. Pharmacologic activation of both PKA and Epac pathways by specific cAMP analogues phenocopied the effects of adenosine signaling on murine DCs, such as suppression of proinflammatory cytokines, elevation of anti-inflammatory IL-10, increased expression of regulators of NF-kB pathway, and finally suppression of T cell activation. Inhibition of effector cytokine, IL-12p40 production, and increased immunosuppressive IL-10 production by adenosine signaling is significantly reversed only when both PKA and Epac pathways were inhibited together. Adenosine signaling increased IL-10 secretion while decreasing IL-12p40 secretion in human monocyte-derived DCs. Stimulation of both PKA and Epac pathways also caused combinatorial effects in regulation of IL-12p40 secretion in human monocyte-derived DCs. Interestingly, PKA signaling alone caused similar increase in IL-10 secretion to that of adenosine signaling in human monocyte-derived DCs. Our data suggest adenosine/cAMP signaling targets both PKA/Epac pathways to fully differentiate DCs into a suppressive phenotype. The Journal of Immunology, 2019, 203: 3247–3255.
I
n the tumor microenvironment (TME), high concentrations of extracellular adenosine accumulate (1). Adenosine can regulate immune response by engaging G protein–coupled adenosine receptors. Among the four adenosine receptor subtypes, namely A1 (A1R), A2A (A2AR), A2B (A2BR), and A3 (A3R), A2AR and A2BR are the main adenosine receptors in activated immune cells (2). Targeting these receptors by both genetic models and pharmacological blockade have shown promising results in both preclinical and clinical settings (3–6). Previously we have shown that APC are one of the main targets for adenosine-mediated suppres-sion of immune cells in the TME (7, 8). Therefore, it is important to reveal how adenosine promotes a suppressive APC phenotype.Both adenosine A2ARs and A2BRs are important for the sup-pression of dendritic cells (DCs) (7–9). Adenosine A2B receptor
stimulation strongly induces IL-10 secretion in DCs and sup-presses IL-12p40 and TNF-a production (8, 10). A2A and A2B receptors are both Gs-coupled adenosine receptors causing ele-vation of cAMP upon their actiele-vation (2). Two major intracel-lular receptors for cAMP in DCs are PKA and exchange protein directly activated by cAMP (Epac). Although anti-inflammatory properties of cAMP downstream of GPCR signaling is known (11, 12), whether PKA, Epac, or both intracellular receptors of cAMP are important to suppress DC activation in the context of adenosine receptor signaling is poorly understood.
In this study by using a cell-impermeable, stable adenosine analogue, 59-N-ethylcarboxamidoadenosine (NECA), and stable cAMP analogues specific for PKA (6-Bnz-cAMP sodium salt) or Epac (8-pCPT-2-O-Me-cAMP-AM), we have shown that adeno-sine receptor signaling polarized LPS-stimulated bone marrow– derived DCs (BM-DCs) into a tumor-promoting phenotype. NECA stimulation in the presence of LPS caused accumulation of cAMP. Similar to NECA, addition of stable cAMP analogue to the cell culture during activation decreased immunostimulatory and in-flammatory IL-12p40 and TNF-a secretion while elevating anti-inflammatory IL-10. Combinatorial targeting of both intracellular receptors of cAMP, PKA and Epac, caused similar responses to adenosine signaling, which includes decreased expression of IL-12 and TNF-a and increased IL-10 synthesis, increased expression of anti-inflammatory NR4A transcription factors and accumulation of anti-inflammatory phosphorylated cFos, and suppression of T cell activation as measured by IFN-g accumulation upon restimulation. Only addition of both PKA and Epac inhibitors together could reverse the effect of NECA on IL-12p40 secretion and IL-10. In monocyte-derived human DCs, targeting both PKA and Epac was necessary to obtain comparable inhibition of IL-12p40 with NECA whereas PKA played the major role for increasing IL-10.
Department of Molecular Biology and Genetics, Bilkent University, 06800 Ankara, Turkey
ORCIDs:0000-0001-6089-5086(M.K.);0000-0002-5436-6038(A.K.); 0000-0002-8540-6741(I.A.);0000-0002-2630-9765(A.C.S.).
Received for publication July 5, 2019. Accepted for publication October 7, 2019. This work was supported by European Molecular Biology Organization Installation Grant 3297 and by 1001 - Scientific and Technological Research Projects Funding Program Grant 215S729 by the Scientific and Technological Research Council of Turkey.
Address correspondence and reprint requests to Dr. Caglar Cekic, Department of Molecular Biology and Genetics, Faculty of Science, SB Building, Bilkent Univer-sity, 06800 Ankara, Turkey. E-mail address: [email protected]
The online version of this article contains supplemental material.
Abbreviations used in this article: ADA, adenosine deaminase; BM-DC, bone mar-row–derived DC; DC, dendritic cell; Epac, exchange protein directly activated by cAMP; LLC, Lewis lung carcinoma; NECA, 59-N-ethylcarboxamidoadenosine; PKA, protein kinase A; TME, tumor microenvironment.
CopyrightÓ 2019 by The American Association of Immunologists, Inc. 0022-1767/19/$37.50
These results suggest that adenosine signaling targets both intracellular receptors of cAMP, PKA and Epac, to strongly suppress DC responses, PKA playing potentially the major role in human setting. Our results have important implications to understand molecular interactions in immune-related dis-ease conditions, in which adenosine accumulation is observed.
Materials and Methods
Mice and tumor model
Female C57/BL6 mice were bred and used when they are 6–8 wk old under approval by Institutional Animal Care and Use Committee of Bilkent University. Lewis lung carcinoma (LLC)1 cell lines were obtained from American Type Culture Collection and maintained in DMEM con-taining 10% heat-inactivated FBS, 2 mmol/L l-glutamine, 1 mmol/L sodium pyruvate, 50 U/ml penicillin, and 50 mg/ml streptomycin. For tumor growth, a 1:1 mixture of 105tumor cells and BM-DCs were mixed before inocu-lation into the right flank of C57/BL6 mice. Tumor growth was measured by caliper until the tumor volume of control animals reached the size of 1000 mm3(4 wk after tumor inoculation).
Reagents and chemicals
The name and catalog number of reagents and other chemicals are as follows: PKA-specific cAMP analogue, 6-Bnz-cAMP sodium salt (5255; Tocris Bioscience); Epac-specific cAMP analogue, 8-pCPT-2-O-Me-cAMP-AM (4853; Tocris); KT5720, PKA inhibitor (1288; Tocris); Epac inhibitor, ESI09 (4773; Tocris Bioscience); ERK inhibitor-U0126 (9903; Cell Signaling Technology), adenosine deaminase (ADA) (10102105001; Roche); stable cAMP analogue, cAMPS-Sp, triethylammonium salt (1333; Tocris Bioscience), NECA (35920-39-9; Tocris Bioscience); ultrapure LPS from Salmonella minnesota R595 (tlrl-smlps; Invivogen); A1R agonist, 2’-MeCCPA (2281; Tocris Bioscience); A2AR agonist, CGS 21680 hy-drochloride (124431-80-7; Tocris Bioscience); A2BR agonist, BAY 60-6583 (4472; Tocris Bioscience); A3R agonist, 2-Cl-IB-MECA (1104; Tocris Bio-science); A1R antagonist, PSB36 (2019; Tocris BioBio-science); A2AR antago-nist, SCH 58261 (160098-96-4; Tocris Bioscience); and A2B antagoantago-nist, PSB 603 (3198; Tocris Bioscience). Please see Supplemental Fig. 1 for dose and time optimizations for LPS and NECA. Concentrations of reagents were chosen based on efficacious dose range and receptor-specific activities with given Kiand Kdvalues indicated in manufacturer’s instructions.
Generation of BM-DCs and monocyte-derived human DCs
BM-DCs were prepared according to the protocol of Cekic et al. (13). Briefly, bone marrows were collected from femur and tibia of C57/BL6 mice and lysed with ACK buffer to remove RBCs. Remaining single-cell suspension was cultured for 10 d in bacteriological culture plates at a density of 23 105 cells per ml RPMI medium (Life Technologies) containing 10% FBS, 50 U/ml penicillin/streptomycin, 1% 13 Na-Pyruvate, 50 mM 2-ME, and 5 ng/ml GM-CSF by refreshing the media every 2 d. At day 10, suspension and low attached cells were harvested to be used in the experiments. Nonadherent cells were collected on day 10 and verified to be $90% CD11b+/CD11c+/Gr12by flow cytometry before use in experiments. Monocyte-derived human DCs were prepared according to the protocol modified from Nair et al. (14). Briefly, monocytes sorted from human PBMCs obtained from healthy donors were incubated in the presence of recombinant human GM-CSF and IL-4 (R&D systems) for 5–7 d in bac-terial culture plates. Nonadherent cells were collected and verified to be $90%HLA-DR+/CD11c+/CD32/CD192. Please see Supplemental Fig. 2 for phenotyping of murine and human DCs.
Real-time quantitative PCR
BM-DCs (13 106) were rested for 2 h in polystyrene tubes (123 75 mm) at 37˚C and then treated with 100 ng/ml LPS in the presence or absence of NECA and/or cAMP analogues for 1 h. Total RNA was extracted from cultured cells using Nucleospin RNA Isolation kit (Macherey-Nagel), and cDNAs were generated using High Capacity cDNA Reverse Transcription kit (Life Technologies). Quantitative PCR analysis was performed with TaqMan probes listed in the Table I and TaqMan PCR master mix obtained from Applied Bio-Systems. All isolation pro-cedures and reaction assays followed recommended manufacturer’s instructions, and data were gathered using Roche thermal cycler. b-Actin was used as a reference housekeeping gene. The cycle threshold values were calculated for each sample and used to deter-mine the relative mRNA expression levels as compared with house-keeping gene.
Flow cytometry analysis
Cells were stained in FACS buffer (2% FBS and 0.05% NaN3in HBSS) using appropriate Ab–fluorophore conjugates. For dead cell exclusion, cells were stained with Live-Dead Staining (BioLegend). Cells were stained in 96-well plates. For extracellular markers cells were collected, centrifuged (3003 g, 5 min), and resuspended in FACS buffer con-taining fluorescently labeled Abs. After 15 min incubation, cells were washed twice using FACS buffer before being analyzed by Flow cytometry. For intracellular staining, cells were fixed with 4% formal-dehyde, permeabilized with perm buffer (1%FBS, 0.1% sodium azide, and 0.1% saponin in HBSS). Permeabilized cells were incubated with 1:100 dilution of fluorescently labeled anti–IFN-g Ab. Multiparameter analysis was performed on CytoFLEX analyzer (Beckman Coulter Life Sciences). Data were analyzed with NovoExpress (Acea Biosciences) or CytExpert (Beckman Coulter Life Sciences) software (A complete list of Abs that were used can be found in Table II). Please see Supplemental Fig. 2 for gating strategies for DCs and CD4+T cells.
Immunoblotting
BM-DCs (2–33 106) were rested for 2 h in 123 75–mm polystyrene tubes in the presence of 1 U/ml ADA at 37˚C and then exposed to LPS in the presence or absence of NECA. Total protein was extracted from BM-DCs using RIPA buffer (150 mM NaCl, 50 mM Tris HCL, 1% Nonidet P-40, 0.1% Sodium DOC, 0.1% SDS, 50 mM NaF, 1 mM NaVO4 including protease and Phosphatase Inhibitor Cocktails obtained from Roche). BCA Protein Assay (Thermo Fisher Scientific) was used to measure the protein concentrations. Protein lysates were fractionated by SDS-PAGE and transferred to PVDF membrane. Membranes blocked in the presence of 5% nonfat dry milk or 5% BSA for 1 h at room temperature were incubated with corresponding primary Abs (Table III) at 4˚C over-night. Blots were developed using Clarity Western ECL substrate (Bio-Rad) after incubated with HRP-conjugated secondary Ab and visualized by film developer.
Intracellular cAMP measurements
LPS-prestimulated 13 104BM-DCs were seeded on a 96-well plate and incubated with different concentration of NECA in stimulation buffer for 15 min. Rolipram (10 mM) was added to the stimulation buffer to block phosphodiesterases to allow accumulation of cAMP after NECA stim-ulation. Intracellular cAMP accumulation was measured by LANCE Ultra cAMP detection reagents (PerkinElmer) according to the manu-facturer’s instructions.
ELISA
BM-DCs were preincubated in 96-well flat bottom tissue culture plates in the presence of 1 U/ml ADA before stimulating with LPS (100 ng/ml) in the presence or absence of 3 mM NECA and/or cAMP analogues and/or inhibitors at 37˚C overnight. Supernatants were collected and tested for TNF-a, IL-12p40, and IL-10. ELISA MAX Standard kits (BioLegend) and high-binding 96-well ELISA plates (Corning) were used according to manufacturer’s instructions to detect murine cytokine concentrations. For human IL-10 and IL-12p40, Quantikine Elisa Kits (R&D Systems) were used according to the manufacturer’s instructions.
Coculture experiments with BM-DC supernatant
Spleen or lymph nodes of C57/BL6 mice were collected. Single-cell suspension was prepared using 40-mm cell strainers and used to enrich for CD4+T cells by magnetic cell sorting kit (EasySep Mouse CD4+ T Cell Enrichment kit; StemCell Technologies) based on manufac-turer’s instructions. The supernatant of BM-DCs was collected mixed with the isolated CD4+T cells prior to activation with plate-bound anti-mouse CD3ε, clone 145-2C11, and anti-mouse CD28, clone 37.51 (BioLegend), for 3 d. After activation, T cells were restimulated with 50 ng/ml PMA, 1 mg/ml ionomycin for 5 h. Brefeldin A (diluted to 13 from 10003 stock provided by BioLegend) was added 2 h after restimulation. After surface staining for CD4 and Live-Dead staining, intracellular staining for IFN-g was performed as described previously (8).
Statistical analysis
All statistical analysis were performed using one-way ANOVA followed by Tukey multiple comparison test in GraphPad Prism 6 (GraphPad Software). All results were represented as mean6 SE and obtained from at least two independent experiments with n $ 3. The differences were considered statistically significant if the p value is smaller than 0.05.
Significance across the figures is represented by *p, 0.05, **p , 0.01, ***p, 0.001, and ****p , 0.0001.
Results
Adenosine receptor signaling polarizes DCs into a tumor-promoting suppressive phenotype
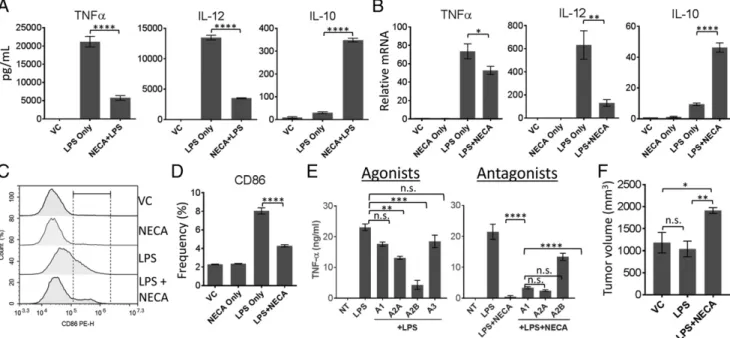
In our previous studies we have shown that adenosine may be one of the main TME-associated metabolic byproducts increasing APC-associated IL-10 (8). Other studies have also shown that adenosine signaling can decrease DC activation and inflam-matory cytokine secretion while increasing anti-inflaminflam-matory IL-10 (10). Therefore, we first tested if we can recapitulate these findings using BM-DCs in our laboratory. Addition of cell-impermeable, stable adenosine analogue, NECA, strongly suppressed LPS-induced TNF-a and IL-12p40 secretion while increasing IL-10 production (Fig. 1A). NECA also strongly decreased IL-12p40 and IL-10 expression at the mRNA level (Fig. 1B). Adenosine signaling by NECA significantly suppressed TNF-a mRNA; however, this decrease was not as substantial as what we observed for secreted TNF-a levels (Fig. 1B). NECA alone did not significantly change secretion (Supplemental Fig. 3) or expression (Fig. 1B, Table I) of these cytokines in the absence of proinflammatory LPS. Next, we tested CD86 expression as a cell surface activation marker because it plays an important role in T cell activation during Ag presentation. NECA strongly inhibited CD86 expression in the presence of inflammatory stimuli, LPS (Fig. 1C, 1D, Table II). We next tested if NECA targets adenosine receptors to suppress activation of DCs by using adenosine receptor-specific agonists individually or antagonists in the pres-ence of NECA. Concentrations of receptor-specific agonists and antagonists used were determined by the dose range for their
sp. act. indicated by manufacturer and by Wilson et al. (10). Fig. 1E, left, shows that only adenosine A2A and A2B receptor ago-nists could significantly suppress TNF-a production by DCs. Also, effects of NECA on the suppression of TNF-a is strongly reversed by adenosine A2B receptor signaling (Fig. 1E, right), suggesting that NECA targets adenosine receptors and adenosine A2A and A2B receptors may play important roles in adenosine-mediated suppression of DCs in our culture system. In our previous studies we have shown tumor-promoting effects of adenosine A2A re-ceptor deletion in myeloid cells (macrophages, neutrophils, and DCs). To show that polarizing DCs alone as a subpopulation of myeloid cells may have tumor-promoting effects, we treated DCs with LPS in the presence or absence of NECA and washed the cells rigorously. Then we mixed equal numbers of DCs and LLC cells before inoculating into the right flanks of C57BL/6 mice, and then followed the tumor growth. Preconditioning of DCs with LPS as an inflammatory stimuli before mixing with tumor cells did not change the tumor growth pattern as compared with the tumors mixed with untreated DCs (Fig. 1F). However, when DCs were preconditioned with both LPS and NECA, we observed increased tumor growth as compared with control or LPS-pretreated group (Fig. 1E), suggesting that adenosine signaling in DCs causes DCs to gain a tumor-promoting phenotype.
Adenosine receptor signaling activates cAMP pathway but does not influence phosphorylation of immediate inflammatory signaling events
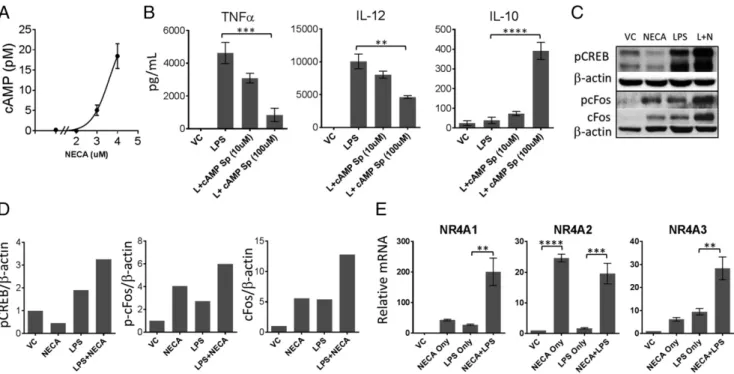
Because adenosine receptors are G protein–coupled receptors, and major immunoregulatory adenosine receptors are Gs-coupled A2A and A2B receptors, we next tested accumulation of cAMP in LPS-stimulated DCs exposed to NECA. Fig. 2A shows that adenosine
FIGURE 1. Adenosine receptor signaling polarizes DCs into a tumor-promoting phenotype. (A) BM-DCs were stimulated with 100 ng/ml LPS in the presence or absence of 3 mM NECA for 18 h. Culture supernatants were collected and tested for secretion of indicated cytokines. (B) BM-DCs were stimulated with 100 ng/ml LPS in the presence or absence of 3 mM NECA for 1 h. Quantitative PCR was performed to detect fold increases in mRNA expression of cytokines indicated in (A). (C) BM-DCs from (A) were dissociated from the tissue culture plate and analyzed by flow cytometry for the expression of activation marker CD86. (D) Graphical representation of (C). (E) BM-DCs were stimulated with LPS in the presence or absence of 100 nM A1R-, A2AR-, A2BR-, or A3R-specific agonists (left) or in the presence or absence of NECA plus 100 nM A1R-, A2AR-, or 300 nM A2BR-specific antagonists (right) for 18 h. Culture supernatants were collected and tested for TNF-a by ELISA. (F) Equal numbers of DCs (treated with LPS or LPS + NECA for 6 h and washed vigorously) and LLC cells were inoculated s.c. in the right flanks of C57BL/6 mice. Tumor volume was assessed by caliper (n = 6) 4 wk after tumor inoculation (when the control group reached the size of around 1000 mm3). DMSO-treated DCs were used as control. ADA (1 U/ml) was added to the culture to neutralize the effect of endogenous adenosine generated. Data were analyzed by one-way ANOVA and post hoc Tukey test. *p, 0.05, **p, 0.01, ***p , 0.001, ****p , 0.0001. n.s., not significant.
signaling by NECA caused accumulation of cAMP when DCs are stimulated with LPS. Fig. 2B shows that addition of cAMP analogue to the culture phenocopies the effects of NECA on TNF-a, IL-12p40, and IL-10 production, suggesting cAMP is one of the major pathways regulating adenosine suppression of DCs. NECA stimulation in combination with LPS strongly increased phosphorylated CREB levels and both phosphorylated and total c-Fos (Fig. 2C, Table III), which was recently shown as one of the negative regulators of NF-kB downstream of cAMP signal-ing (11). NECA alone or in combination with LPS also increased the expression of nuclear orphan receptors NR4A1, NR4A2, and NR4A3 (Fig. 2D), which were also implicated as negative reg-ulators of NF-kB activation (15, 16).
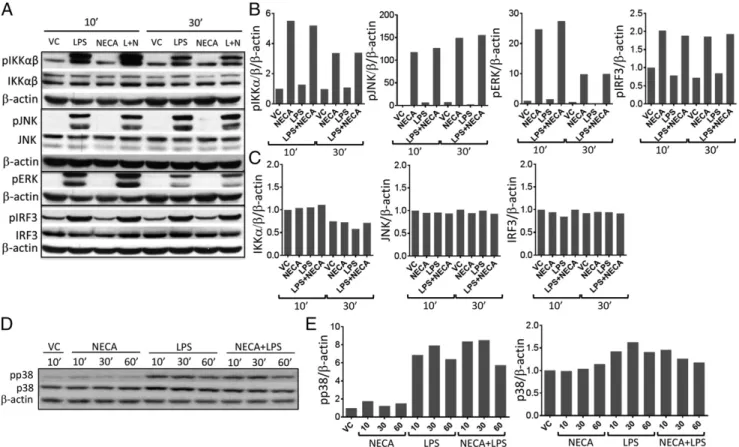
A2B receptors can also couple Gq subunits and activate PLC pathway, causing MAPK activation. Therefore, we next tested if NECA stimulation can also directly influence the major inflammatory signaling pathways including MAPKs after LPS stimulation of DCs. Addition of NECA did not substantially change the accumulation of phosphorylated IKKa/b, JNK, ERK1/2, IRF3 (Fig. 3A–C), and p38 (Fig. 3D, 3E). Because ERK1/2 is one of the important downstream targets of PLC signaling, we also tested the phosphorylated ERK1/2 levels at very early (2 and 5 min) or later time points (2–3 h). Adeno-sine signaling did not substantially change the accumulation of phosphorylated ERK1/2 at these time points (Supplemental Fig. 4A, 4B). Furthermore, inhibition ERK1/2 pathway by U0126 did not influence suppression of proinflammatory cytokine production by adenosine signaling (Supplemental Fig. 4C). Collectively, these
results suggest that adenosine signaling promotes the expression of negative regulators of NF-kB signaling downstream of cAMP without influencing the immediate regulators of inflammation downstream of danger signaling.
Combinatorial targeting of both Epac and PKA pathways is required to mediate immunosuppressive effects of adenosine receptor signaling
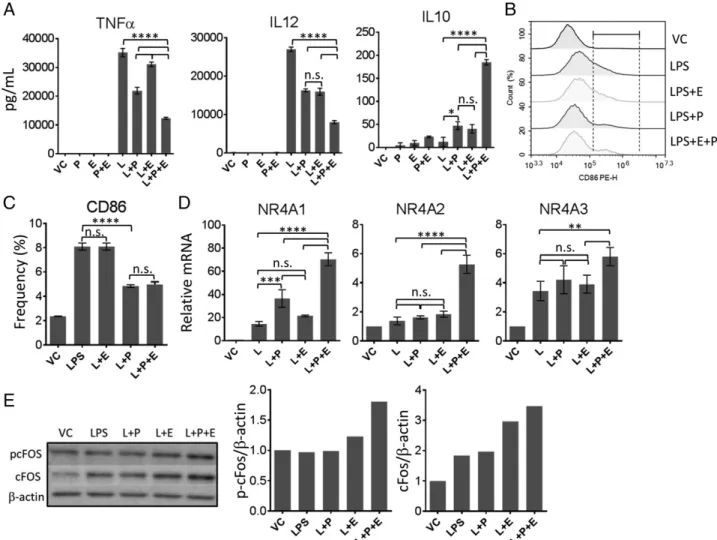
PKA and Epac are two main sensors of intracellular cAMP levels. Both PKA and Epac were implicated in regulation of DC activation (17, 18). Considering the possibility that accumulated cAMP upon adenosine receptor signaling can target both path-ways, we used PKA versus Epac-specific cAMP analogues alone or in combination to find if targeting a particular cAMP receptor or both intracellular receptors are important to mimic the effects of adenosine signaling. We observed that addition of either analogue alone caused,50% decrease in LPS-induced immu-nostimulatory TNF-a and IL-12p40 and increase in IL-10. However, addition of both analogues could cause more than 50% decrease in TNF-a and IL-12p40 and increase in anti-inflammatory IL-10, similar to what we observed after DC stimulation after NECA (Fig. 4A). Interestingly, targeting PKA pathway alone was sufficient for the inhibition of CD86 ex-pression (Fig. 4B, 4C), suggesting that PKA and Epac can also play distinct roles in regulation of DC responses. Combinatorial targeting of both PKA and Epac was necessary to strongly in-crease NR4A expression (Fig. 4D) and accumulation of phos-phorylated c-Fos (Fig. 4E).
Table I. List of TaqMan probes
Name Product Species Brand
B-actin Mm00607939_s1 (b actin probe/primer) Mouse Life Technologies
IL-10 Mm00439614_m1 (IL-10) Mouse Life Technologies
IL-12 Mm00434174_m1 (IL-12 p40 TaqMan probe) Mouse Life Technologies
NR4A1 Mm01300401_m1 (NR4A1) Mouse Life Technologies
NR4A2 Mm00443060_m1 (NR4A2 TaqMan probe/primer) Mouse Life Technologies
NR4A3 Mm00450074_m1 (NR4A3) Mouse Life Technologies
TNF-a Mm00443258_m1 (TNF-a TaqMan probe) Mouse Life Technologies
Table II. Flow cytometry Abs
Ab Name Species Catalog No. Brand
CD11b Percpcy5.5 Mouse 557397 BioLegend
CD11c PE Mouse 60-0114-U100 Tonbo Biosciences
CD16/32 (Fc block) Mouse 14-061-85 eBiosicences
CD25 BV421 Mouse 102034 BioLegend
CD4 Percp Cy5.5 Mouse 65-0041-U100 Tonbo Biosciences
CD44 Biotin Mouse 10232 StemCell Technologies
CD45 Af700 Mouse 103128 BioLegend
CD69 Percp Cy5.5 Mouse 45-0691-82 eBiosciences
CD8 APC cy7 Mouse 25-0081-U100 TonboBiosciences
CD80 APC Mouse 104713 BioLegend
CD86 PE Mouse 12-0861-83 eBiosciences
Green fluorescent reactive dye, (LDG) Mouse L349780 Life Technologies
IFN-g PE-CY7 Mouse 60-7311-U100 TonboBiosciences
LyG C FITC Mouse 128033 BioLegend
LyG G Af647 Mouse 25-1276-U100 Tonbo Biosciences
MHC-I Af647 Mouse 116512 BioLegend
MHC-II PE Cy5 Mouse 11-5321-81 eBiosicences
Streptavidin PE Mouse S866 Invitrogen
Streptavidin PE Mouse S866 Invitrogen
HLA-DR FITC Human 361603 BioLegend
CD11c PE Human 301605 BioLegend
CD3 FITC Human 300305 BioLegend
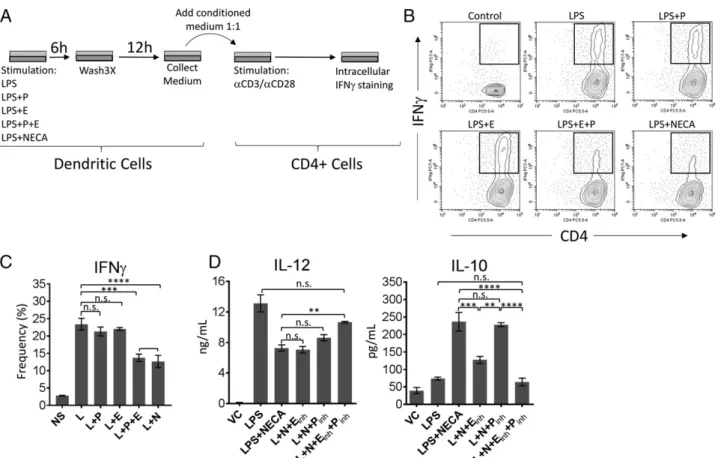
To test if the effects of combinatorial targeting of PKA and Epac on cytokine secretion are functional, we next stimulated DCs by LPS in the presence or absence of PKA-specific cAMP analogue and/or Epac-specific cAMP analogue or NECA for 6 h. After performing a vigorous washing cycle, fresh medium was added to the DC culture for an additional 12 h. Culture super-natants from each group were collected and added to the medium containing isolated CD4+ T cells, which were subsequently activated by plate-bound anti-CD3/anti-CD28. Intracellular staining of restimulated T cells for IFN-g was performed after 3 d of culture as a measure of T cell activation (Please see Fig. 5A for details). We have chosen this method because combinatorial effects for PKA and Epac were more obvious on cytokine secretion rather than cell surface activation marker CD86. Conditional medium obtained from NECA-prestimulated DCs significantly reduced IFN-g+ CD4+ T cells (Fig. 5B). Conditioned medium from DCs prestimulated with PKA or Epac-specific analogues alone did not cause a significant re-duction in IFN-g prore-duction (Fig. 5A). However, addition of both analogues caused comparable suppression of IFN-g pro-duction to that of NECA (Fig. 5A). Finally, addition of inhibitors of both PKA and Epac significantly prevented NECA from suppressing IL-12p40 secretion and promoting IL-10 secretion by LPS (Fig. 5C).
Finally, we have tested the effect of stimulation of adenosine signaling or PKA and Epac pathways alone or in combination on LPS-induced IL-12p40 and IL-10 secretion in human monocyte-derived DCs and compared their effects to NECA-stimulated group. Adenosine signaling strongly suppressed IL-12p40 section while increasing IL-10 in human monocyte-derived DCs, similar to what we have observed in BM-DCs (Fig. 6). Stimulation of both PKA and
Epac pathways are required to observe comparable inhibition of IL-12p40 to that of NECA-stimulated group (Fig. 6). However, PKA alone could cause similar increase in IL-10 secretion to that of NECA, suggesting that in human monocyte-derived DCs PKA can be the main intracellular cAMP receptor to promote IL-10 (Fig. 6). Collectively, these results suggest that adenosine signaling targets both PKA and Epac pathways to polarize DCs into a suppressor phenotype. In human setting PKA may have a more substantial role for this effect.
FIGURE 2. Adenosine signaling cause activation of cAMP pathway and negative regulators of NF-kB signaling downstream of cAMP. (A) BM-DCs were stimulated with 100 ng/ml LPS and exposed to different concentrations of NECA (as shown in log10scale) in the presence of 10 mM rolipram. Accumulation of cAMP was measured by a TR-FRET–based competitive assay. (B) BM-DCs were stimulated with LPS in the presence of indicated concentrations of stable cAMP analogue for 18 h. Culture supernatants were tested for indicated cytokines by ELISA. (C) BM-DCs were stimulated with LPS for indicated time points in the presence or absence of 3 mM NECA. Immunoblotting was performed using the cell lysates in RIPA buffer to detect phosphorylated CREB and c-Fos levels. (D) Quantitation of (C). (E) Quantitative PCR was performed to detect changes in NR4A expression in BM-DCs after stimulating with LPS in the presence or absence of NECA for 1 h. DMSO is used as vehicle. ADA (1 U/ml) was added to the culture to neutralize the effect of endogenous adenosine generated. Data were analyzed by one-way ANOVA and post hoc Tukey test. **p, 0.01, ***p , 0.001, ****p , 0.0001. n.s., not significant.
Table III. Western blot Abs
Ab Name Catalog No. Brand
cFOS 2250S Cell Signaling Technology
CREB 4820S Cell Signaling Technology
ERK 1/2 9102 Cell Signaling Technology
IKKa/b sc-7607 Santa Cruz Biotechnology
IRF-3 sc-9082 Santa Cruz Biotechnology
p38 9212S Cell Signaling Technology
SAPK/JNK 9252 Cell Signaling Technology
Goat anti-rabbit IgG HRP conjugate 1706515 Bio-Rad HRP goat anti-mouse IgG 405306 BioLegend
p-cFOS 5348S Cell Signaling Technology
p-ERK 1/2 9461 Cell Signaling Technology
p-p38 9913S Cell Signaling Technology
p-IKK 3033s Cell Signaling Technology
p-IRF3 29047s Cell Signaling Technology
p-JSAPK/JNK 9251 Cell Signaling Technology
p-CREB 9198S Cell Signaling Technology
Discussion
Adenosine receptors are being targeted for multiple solid tumor indications in clinic. Our previous studies have shown that adenosine signaling in APC is important for suppression of cytotoxic lymphocytes. In this study, we extended the scope of our previous studies to understand how adenosine can sup-press DC activation while strongly inducing anti-inflammatory IL-10. Our results indicated that both intracellular cAMP re-ceptors, PKA and Epac, play an important combinatorial role in regulation of DC responses downstream of receptor-mediated adenosine signaling.
A potential link between adenosine receptor signaling and PKA or Epac signaling in regulation of fibrosis and ECM remodeling has been suggested in various studies. Phosri et al. (19) indicated that A2BR/cAMP/Epac signaling inhibits car-diac fibrosis induced by endothelin. The same group has shown A2BR/Epac pathway in regulation of ECM remodeling and myofibroblast differentiation (20). By using pharmacological approaches and PKA inhibitors, Zhao et al. (21) reported that hypoxia-generated adenosine stimulates A2BR/PKA pathway to suppress MMP9 production. Our study also emphasizes the importance of PKA and Epac stimulation by adenosine signaling in the context of regulation of inflammation and DC activation. Therefore, adenosine signaling may use similar pathways in dif-ferent cell types for both resolution of inflammation and tissue repair and fibrosis.
Previous studies independently analyzed PKA and Epac pathway in regulation of inflammation in DCs and macro-phages. Aronoff et al. (17) have shown that PKA and Epac can
both individually decrease secretion of TNF-a or MIP1 from DCs. However, activation of these pathways individually did not cause any change in IL-10 production. Garay et al. (18) suggested that PKA signaling is important for DC maturation. In the same study, Epac signaling was suggested as being a potential suppressor of the effects of PKA in regulation of DC maturation; PKA but not Epac was shown to suppress basal levels of cytokine production (18). In another study, Epac was shown to play an anti-inflammatory role in regulation of LPS-induced acute murine lung injury (22). Our study suggests that in the presence of inflammatory stimuli, both PKA and Epac pathways are important and have combinatorial effect on ac-tivation or expression of intracellular regulators of inflam-mation and polarization of DCs into a suppressor phenotype. This effect was particularly apparent in the secretion of anti-inflammatory IL-10. One interesting observation was that PKA signaling suppressed both inflammatory cytokine production and CD86 expression, whereas Epac signaling decreased in-flammatory cytokine production.
A2BR signaling can couple Gq subunit and stimulate PLC/ PKC pathways, which leads to activation MAPKs and re-sponses such as chronic inflammation and exacerbation of autoimmunity (23, 24). These events particularly required PKC and p38 activation and release of IL-6 directly by A2BR signaling. In the presence of inflammatory stimuli, we did not observe changes in p38 or ERK1/2 downstream of Gq/PLC/ PKC pathways. Adenosine signaling alone also did not cause any significant changes in expression of the cytokines we tested or a substantial accumulation phosphorylated MAPKs.
FIGURE 3. Adenosine signaling does not influence the phosphorylation status of immediate regulators of inflammation downstream of danger signaling. (A) BM-DCs were stimulated with 100 ng/ml LPS (L) in the presence or absence of 3 mM NECA for 10 and 30 min. Immunoblotting was performed using the cell lysates in RIPA buffer to test the phosphorylation status of indicated downstream signaling mediators of inflam-mation. (B and C) Graphical representation of (A) relative to b-actin. (D) Immunoblotting for phosphorylated and total levels of p38 was per-formed after stimulating the BM-DCs with 100 ng/ml LPS (L) in the presence or absence of 3 mM NECA for 10, 30, and 60 min. (E) Quantitation of (D) relative to b-actin.
Adenosine signaling strongly suppressed the inflammatory cytokines we tested even in the presence of ERK1/2 inhibitor. Therefore, A2BR/Gq signaling, especially in the context of autoimmune disease setting, may couple with other immune regulators to promote chronic inflammation, whereas in the context of immune stimulation through intracellular cAMP, it may play an immunosuppressive role.
Pathogen-associated signals or endogenous danger signals causes activation of NF-kB, MAPK, and IRF3 pathways to increase inflammation (25). Activation of DCs by tory stimuli caused rapid phosphorylation of these inflamma-tory mediators. However, adenosine signaling did not change their phosphorylation status. Previously, it was shown that adenosine modulated NR4A orphan nuclear receptors to at-tenuate inflammatory responses downstream of adenosine signaling (26). Another target identified for the regulation of inflammatory responses downstream of cAMP pathway is c-Fos protein (11). Phosphorylation of c-c-Fos downstream of cAMP can prevent its degradation, causing elevation of both phosphorylated and total cFos levels. Both NR4A and c-Fos
pathways inhibited NF-kB transcriptional activity. Accord-ingly, adenosine signaling or addition of PKA and Epac to-gether significantly increased both expression of NR4A receptors and phosphorylated and total c-Fos levels, suggest-ing that rather than directly interfersuggest-ing with phosphorylation status of major inflammatory pathways, adenosine/cAMP/ PKA–Epac signaling can regulate inflammation by increasing the expression or stabilization of negative regulators of in-flammation. In accordance with our observations, Ko¨ro¨ske´nyi et al. (27) have also suggested the A2AR/cAMP pathway may not alter LPS-induced NK-kB activation in macrophages but suppresses inflammation in a cAMP-dependent manner. In-terestingly, chronic deletion of A2AR pathway in this study caused an increased basal level of MAPK activation, sug-gesting that in the absence of inflammatory stimuli adenosine, signaling alone can have important regulatory effects in macrophage differentiation and responsiveness to subsequent inflammatory stimuli. Similarly, our results indicated adenosine signaling alone can promote expression of anti-inflammatory NR4A expression.
FIGURE 4. Activation of both PKA and Epac are required to phenocopy the effects of adenosine signaling in BM-DCs. (A) BM-DCs were stimulated with 100 ng/ml LPS (L) in the presence or absence of 100 mM PKA (P)-, 3 mM Epac (E)-, or PKA + Epac (P+E)–specific cAMP analogues for 18 h. Culture supernatants were collected and tested for secretion of indicated cytokines by ELISA. (B) BM-DCs from (A) were dissociated from the tissue culture plate and analyzed by flow cytometry for the expression of activation marker CD86. (C) Graphical representation of (B). (D) Quantitative PCR was performed to detect changes in NR4A expression in BM-DCs after stimulating with LPS in the presence or absence of PKA-, Epac-, or PKA+Epac–specific cAMP analogues for 1 h. (E) Immunoblotting was performed to detect phosphorylated CREB and c-Fos levels using lysates of BM-DCs stimulated with LPS in the presence or absence of PKA-, Epac-, or PKA+Epac–specific cAMP analogues. DMSO is used as vehicle. ADA (1 U/ml) was added to the culture to neutralize the effect of endogenous adenosine generated. Data were analyzed by one-way ANOVA and post hoc Tukey test. **p, 0.01, ***p , 0.001, ****p, 0.0001. n.s., not significant.
We tested the effect of adenosine signaling and downstream mediators PKA and Epac pathways in human monocyte-derived DCs. Adenosine signaling strongly suppressed IL-12p40 se-cretion while increasing anti-inflammatory IL-10, which was similar to what we observed in murine BM-DCs. However, we observed that PKA is the main pathway for increasing IL-10. We also observed that PKA pathway more substantially sup-presses IL-12p40 secretion as compared with Epac pathway. However, we still observed combinatorial effect of stimulat-ing PKA and Epac pathways together on IL-12p40 secretion, suggesting that for optimum suppression of human DC, acti-vation of both pathways is necessary. Also there are a rea-sons besides species differences to be considered, such as the origin of cells (monocytes versus bone marrow) and culture conditions (addition of IL-4 plus GM-CSF versus GM-CSF alone).
In conclusion, adenosine can target both PKA and Epac pathways to suppress inflammatory cytokine production while strongly elevating anti-inflammatory IL-10. Regulation of inflammation through PKA and Epac activation possibly in-volves activation of negative regulators of NF-kB such as NR4A receptors or c-Fos. These findings suggest that for therapies to regulate inflammation or for the activation of antitumoral immunity targeting both PKA and Epac pathways may be necessary to obtain strong responses. Future studies are needed to understand the influence of these pathways for
other cAMP-elevating immunomodulatory pathways, different subtypes of DCs, or other immune cell types prone to GPCR-mediated immunoregulation.
FIGURE 5. Adenosine signaling can target both PKA and Epac pathways to polarize BM-DCs into a suppressor phenotype. (A) Graphical representation of the experimental strategy in (B). (B) BM-DCs were stimulated with LPS in the presence or absence of PKA (P)-, Epac (E)-, or PKA+Epac (P+E)–specific cAMP analogues or 3 mM NECA for 6 h. After a vigorous wash three times with warm PBS, fresh medium was added to the culture. After incubating the cells for another 12 h, supernatants were collected and added to the CD4+T cell culture prior to activation with anti-CD3/anti-CD28–coated plates. Three days after stimulation, T cells were collected and restimulated with PMA/ionomycin for 5 h in the presence of brefeldin A. Intracellular staining for IFN-g was performed to test T cell activation and phenotypic differentiation to effector subset. (C) Graphical representation of (B). (D) BM-DCs were stimulated with 100 ng/ml LPS (L) in the presence or absence of NECA or NECA + 100 nM PKA (Pinh)- and/or 20 mM Epac (Einh)-specific inhibitors. DMSO is used as vehicle. IL-12p40 and IL-10 in culture supernatants were tested by ELISA. Data were analyzed by one-way ANOVA and post hoc Tukey test. **p, 0.01, ***p, 0.001, ****p , 0.0001. n.s., not significant.
FIGURE 6. Adenosine signaling and PKA pathway suppress IL-12p40 section while promoting IL-10 secretion in human monocyte-derived DCs. Human monocyte-derived DCs were stimulated with LPS in the presence or absence of PKA (P)-, Epac (E)-, or PKA + Epac (P+E)–specific cAMP analogues or NECA (N) for 18 h. IL-12p40 and IL-10 concentrations in culture supernatants were tested by ELISA. DMSO is used as vehicle. ADA (1 U/ml) was added to the cell culture to neutralize the effect of endogenous adenosine generated. Representative of one of two independent experiments with similar results. Data were analyzed by one-way ANOVA and post hoc Tukey test. **p, 0.01, ****p , 0.0001. n.s., not significant.
Disclosures
C.C. currently holds stocks or stock options of Halozyme Inc. as a current or former employee. The other authors have no financial conflicts of interest.
References
1. Blay, J., T. D. White, and D. W. Hoskin. 1997. The extracellular fluid of solid carcinomas contains immunosuppressive concentrations of adenosine. Cancer Res. 57: 2602–2605.
2. Cekic, C., and J. Linden. 2016. Purinergic regulation of the immune system. Nat. Rev. Immunol. 16: 177–192.
3. Kjaergaard, J., S. Hatfield, G. Jones, A. Ohta, and M. Sitkovsky. 2018. A2A
adenosine receptor gene deletion or synthetic A2Aantagonist liberate
tumor-reactive CD8+T cells from tumor-induced immunosuppression. J. Immunol. 201: 782–791.
4. Leone, R. D., I. M. Sun, M. H. Oh, I. H. Sun, J. Wen, J. Englert, and J. D. Powell. 2018. Inhibition of the adenosine A2a receptor modulates expression of T cell coinhibitory receptors and improves effector function for enhanced checkpoint blockade and ACT in murine cancer models. Cancer Immunol. Immunother. 67: 1271–1284.
5. Vijayan, D., A. Young, M. W. L. Teng, and M. J. Smyth. 2017. Targeting im-munosuppressive adenosine in cancer. [Published erratum appears in 2017 Nat. Rev. Cancer 17: 765.] Nat. Rev. Cancer 17: 709–724.
6. Young, A., S. F. Ngiow, D. S. Barkauskas, E. Sult, C. Hay, S. J. Blake, Q. Huang, J. Liu, K. Takeda, M. W. L. Teng, et al. 2016. Co-inhibition of CD73 and A2AR adenosine signaling improves anti-tumor immune responses. Cancer Cell 30: 391–403. 7. Cekic, C., D. Sag, Y. Li, D. Theodorescu, R. M. Strieter, and J. Linden. 2012. Adenosine A2B receptor blockade slows growth of bladder and breast tumors. J. Immunol. 188: 198–205.
8. Cekic, C., Y. J. Day, D. Sag, and J. Linden. 2014. Myeloid expression of adenosine A2A receptor suppresses T and NK cell responses in the solid tumor microenvironment. Cancer Res. 74: 7250–7259.
9. Cekic, C., and J. Linden. 2014. Adenosine A2A receptors intrinsically regulate CD8+ T cells in the tumor microenvironment. Cancer Res. 74: 7239–7249. 10. Wilson, J. M., W. G. Ross, O. N. Agbai, R. Frazier, R. A. Figler, J. Rieger,
J. Linden, and P. B. Ernst. 2009. The A2B adenosine receptor impairs the maturation and immunogenicity of dendritic cells. J. Immunol. 182: 4616–4623. 11. Koga, K., G. Takaesu, R. Yoshida, M. Nakaya, T. Kobayashi, I. Kinjyo, and A. Yoshimura. 2009. Cyclic adenosine monophosphate suppresses the tran-scription of proinflammatory cytokines via the phosphorylated c-Fos protein. Immunity 30: 372–383.
12. Schnurr, M., T. Toy, A. Shin, M. Wagner, J. Cebon, and E. Maraskovsky. 2005. Extracellular nucleotide signaling by P2 receptors inhibits IL-12 and enhances IL-23 expression in human dendritic cells: a novel role for the cAMP pathway. Blood 105: 1582–1589.
13. Cekic, C., C. R. Casella, D. Sag, F. Antignano, J. Kolb, J. Suttles, M. R. Hughes, G. Krystal, and T. C. Mitchell. 2011. MyD88-dependent SHIP1 regulates proinflammatory signaling pathways in dendritic cells after monophosphoryl lipid A stimulation of TLR4. J. Immunol. 186: 3858–3865.
14. Nair, S., G. E. Archer, and T. F. Tedder. 2012. Isolation and generation of human dendritic cells. Curr. Protoc. Immunol. Chapter 7: Unit7.32.
15. Calvayrac, O., R. Rodrı´guez-Calvo, I. Martı´-Pamies, J. Alonso, B. Ferra´n, S. Aguilo´, J. Crespo, A. Rodrı´guez-Sinovas, C. Rodrı´guez, and J. Martı´nez-Gonza´lez. 2015. NOR-1 modulates the inflammatory response of vascular smooth muscle cells by preventing NFkB activation. J. Mol. Cell. Cardiol. 80: 34–44.
16. Popichak, K. A., S. L. Hammond, J. A. Moreno, M. F. Afzali, D. S. Backos, R. D. Slayden, S. Safe, and R. B. Tjalkens. 2018. Compensatory expression of Nur77 and Nurr1 regulates NF-kB-dependent inflammatory signaling in astro-cytes. Mol. Pharmacol. 94: 1174–1186.
17. Aronoff, D. M., J. K. Carstens, G. H. Chen, G. B. Toews, and M. Peters-Golden. 2006. Short communication: differences between macrophages and dendritic cells in the cyclic AMP-dependent regulation of lipopolysaccharide-induced cytokine and chemokine synthesis. J. Interferon Cytokine Res. 26: 827–833. 18. Garay, J., J. A. D’Angelo, Y. Park, C. M. Summa, M. L. Aiken, E. Morales,
K. Badizadegan, E. Fiebiger, and B. L. Dickinson. 2010. Crosstalk between PKA and Epac regulates the phenotypic maturation and function of human dendritic cells. J. Immunol. 185: 3227–3238.
19. Phosri, S., A. Arieyawong, K. Bunrukchai, W. Parichatikanond, A. Nishimura, M. Nishida, and S. Mangmool. 2017. Stimulation of adenosine A2Breceptor
inhibits endothelin-1-induced cardiac fibroblast proliferation and a-smooth muscle actin synthesis through the cAMP/epac/PI3K/Akt-signaling pathway. Front. Pharmacol. 8: 428.
20. Phosri, S., K. Bunrukchai, W. Parichatikanond, V. H. Sato, and S. Mangmool. 2018. Epac is required for exogenous and endogenous stimulation of adenosine A2Breceptor for inhibition of angiotensin II-induced collagen synthesis and
myofibroblast differentiation. Purinergic Signal. 14: 141–156.
21. Zhao, P., X. G. Li, M. Yang, Q. Shao, D. Wang, S. Liu, H. Song, B. Song, Y. Zhang, and X. Qu. 2008. Hypoxia suppresses the production of MMP-9 by human monocyte-derived dendritic cells and requires activation of adenosine receptor A2b via cAMP/PKA signaling pathway. Mol. Immunol. 45: 2187–2195.
22. Wang, X., S. Song, Z. Hu, Z. Zhang, Y. Li, C. Yan, Z. Li, and H. Tang. 2017. Activation of Epac alleviates inflammation and vascular leakage in LPS-induced acute murine lung injury. Biomed. Pharmacother. 96: 1127–1136.
23. Hasko´, G., B. Cso´ka, Z. H. Ne´meth, E. S. Vizi, and P. Pacher. 2009. A(2B) adenosine receptors in immunity and inflammation. Trends Immunol. 30: 263–270.
24. Wei, W., C. Du, J. Lv, G. Zhao, Z. Li, Z. Wu, G. Hasko´, and X. Xie. 2013. Blocking A2B adenosine receptor alleviates pathogenesis of experimental au-toimmune encephalomyelitis via inhibition of IL-6 production and Th17 dif-ferentiation. J. Immunol. 190: 138–146.
25. Cekic, C., C. R. Casella, C. A. Eaves, A. Matsuzawa, H. Ichijo, and T. C. Mitchell. 2009. Selective activation of the p38 MAPK pathway by synthetic mono-phosphoryl lipid A. J. Biol. Chem. 284: 31982–31991.
26. Crean, D., E. P. Cummins, B. Bahar, H. Mohan, J. P. McMorrow, and E. P. Murphy. 2015. Adenosine modulates NR4A orphan nuclear receptors to attenuate hyperinflammatory responses in monocytic cells. J. Immunol. 195: 1436–1448.
27. Ko¨ro¨ske´nyi, K., B. Kiss, and Z. Szondy. 2016. Adenosine A2A receptor sig-naling attenuates LPS-induced pro-inflammatory cytokine formation of mouse macrophages by inducing the expression of DUSP1. Biochim. Biophys. Acta 1863(7 Pt A): 1461–1471.