EVALUATION OF MOBILIZATION AND DEPLOYMENT PLAN OF A
TURKISH ARMORED
BATTALION VIA SIMULATION
A THESIS
SUBMITTED TO THE DEPARTMENT OF INDUSTRIAL ENGINEERING AND THE INSTITUTE OF ENGINEERING AND
SCIENCES OF BILKENT UNIVERSITY IN PARTIAL
FULFILLMENT OF THE REQUIREMENTS FOR THE DEGREE OF MASTER OF SCIENCE
BY
SELİM MÜSLÜM
July, 2001
I I certify that I have read this thesis and in my opinion it is fully adequate, in scope and in
quality, as a thesis for the degree of Master of Science.
---
Assoc. Prof. İhsan Sabuncuoğlu (PrincipalAdvisor)
I certify that I have read this thesis and in my opinion it is fully adequate, in scope and in quality, as a thesis for the degree of Master of Science.
--- Asst. Prof. Yavuz Günalay
I certify that I have read this thesis and in my opinion it is fully adequate, in scope and in quality, as a thesis for the degree of Master of Science.
--- Asst. Prof. Z. Müge Avşar
Approved for the Institute of Engineering and Science
--- Prof. Mehmet Baray
II
ABSTRACT
EVALUATION OF MOBILIZATION AND DEPLOYMENT PLAN OF A TURKISH ARMORED
BATTALION VIA SIMULATION
Selim Müslüm
M.S. in Industrial Engineering
Supervisor: Assoc. Prof. İhsan Sabuncuoğlu
July, 2001
As being ready for war as soon as possible and with minimum casualties during the crises is the first mission for the troops, the Mobilization and Deployment Plan arises as one of the most important topic for Army. Because this plan includes all the activities that troops have to execute for responding against enemy immediately. In this study, the performance of existing Mobilization and Deployment Plan of a Turkish Armored Battalion is evaulated via simulation. The Mobilization and Deployment simulation model allows military operation planners to build models of Mobilization and Deployment operation of troops early in decision process; perform bottleneck analysis and take necessary measures against the problem areas; and perform risk management of the operations before conducting the real ones.
In this thesis, our objectives are to evaulate the Mobilization and Deployment system of an Armored Battalion, find out the significant factors of enemy threat on the existing system, detect the most hazardous border and the most hazardous factor for each border, and discover the system limits. The output of the model is analysed by experimental design, and ranking and selection procedures. The code of simulation model is written in ARENA simulation program.
III
ÖZET
SİMULASYONLA BİR TÜRK TANK TABURUNUN ALARM
PLANININ ANALİZİNİN YAPILMASI
Selim Müslüm
Endüstri Mühendisliği Bölümü Yüksek Lisans Danışman: Doç. İhsan SABUNCUOĞLU
July, 2001
Kriz anında savaşa en kısa zamanda ve en az hasar ile hazır olmak askeri birliklerin en önemli görevi olduğundan, Alarm Planı Türk Ordusu için en önemli konulardan birisidir. Çünkü bu Alarm Planı askeri birliklerin savaş öncesi yapması gereken bütün faaliyatleri kapsamaktadır. Bu çalışmada, bir tank taburunun alarm planı analiz edilmektedir. Alarm simülasyon modeli, askeri operasyon planlayıcılarına, karar aşamasından önce alarm operasyonun modelini kurma; plandaki problemlerin tesbit edip bunlara karşı tedbir alma, ve gerçek operasyondan önce risk analizi yapma imkanı sağlar.
Bu tez çalışmasında, Alarm Planının analiz edilmesi, şu an kullanılan sisteme etki eden faktörlerin ve etkilerinin tesbit edilmesi, ve sistem limitlerinin tesbit edilmesi ana amaçlarımızdır.Alarm modelinin sonuçları, deneysel dizayn ve sıralama ve seçme prosedürleri kullanılarak analiz edilmiştir. Modelin kodu ARENA simülasyon programıyla yazılmıştır.
Anahtar Kelimeler: Askeri Simülasyon, Harp Oyunu, Savaş Simülasyonu, Birlik Kaydırma
IV
To my parents and fiancé
V
ACKNOWLEDGEMENTS
I would like to express my deep gratitude to Dr. İhsan Sabuncuoğlu for his guidance, attention, understanding, and patience throughout all this work
I am indebted to the readers Yavuz Günalay and Müge Avşar for their effort, kindness and time.
I express my gratitude and thanks to my parents, fiancé and friends for their care, support and encouragement.
VI CONTENTS
1. Introduction 1
1.1. Mobilization and Deployment Plan of an Armored Battalion 1
2. Literature Review 7
2.1. Simulation Software and Methodology 7
2.2. Military Simulation 8
2.3. Combat Modeling and Simulation (War-gaming) 10
3. The Simulation Model 15
3.1. Formulation of the Problem and Planning the Study 15
3.2. Model Development 17
3.2.1. Conceptual Model 18
3.2.2. Logical Model 23
3.2.3. Simulation Model (Computer Code) 23
3.3. Input Data Analysis 29
3.4. Model Verification and Validation 30
3.4.1. Verification 30
3.4.2. Validation 32
3.4.2.2. Validation of Model Assumptions 33
4. Design and Analysis of Experiments 35
4.1. Confirmation of data assumptions 37
4.1.1. The Normality of Data 37
4.1.2. Departures from the Assumptions in Analysis of Variances 39 4.2. Efficiency Check of Mobilization and Deployment Plan 40
VII 4.2.1. Test whether the Mobilization and Deployment Plan Meets
The Time Specifications 41
4.2.2. Bottleneck Analysis 42
4.3. 25 Factorial Design for Maximum Time in System Measure 43 4.3.1 Interpretation of Main Effects and Interactions 44 4.4. 25 Factorial Design for Number of Damaged Vehicles Measure 49
4.4.1. Interpretation of Main Effects 50
4.5. 25 Factorial Design for Number of Totally Destructed Vehicles
Measure 51
4.5.1. Interpretation of Main Effects 52
4.6. Conclusions 53
5. Selecting the Most Critique Region of Turkey 56 5.1. Selecting the Most Critique Region of Turkey Among Ten Regions According to the Maximum Time in System Measure 58 5.2. Selecting the Most Critique Region of Turkey Among Ten Regions According to the Average Time in System Measure 59 5.3. Selecting the Most Critique Region of Turkey Among Ten Regions According to the Number of Damaged Vehicles Measure 61 5.4. Selecting the Most Critique Region of Turkey Among Ten Regions According to the Number of Totally Destructed Vehicles Measure 62
5.5. The Analytic Hierarchy Process 63
5.6. The Detailed Results of Number of Damaged Vehicles and
VIII
5.7. Conclusions 66
6. Selecting the Most Critical Factor Out of Five for Each Regions of Turkey According to the Number of Totally Destructed Vehicles Measure 68
6.1 Rankings of Factors for Regions 69
6.2 Conclusions 72
7. Limits of Mobilization and Deployment Plan 73
7.1 Scenario 1 73
7.2. Scenario 2 74
7.3. Conclusions 76
8. Conclusions 78
8.1 General 78
8.2. Design and Analysis of Experiments 79
8.3. Selecting the Most Critical Region of Turkey Out of Ten 81 8.4. Selecting the Most Critical Factor Out of Five for Each Regions of Turkey According to the Number of Totally Destructed Vehicles Measure 82
8.5. Limits of Mobilization and Deployment Plan 82
8.6. Concluding Remarks 83
IX APPENDIX
A Structure of a Turkish Armored Battalion 85
B Output Data for Chapter 4 86
C Output Data For Chapter 5 97
D Code of the Simulation Model 108
E Probability Tree of The System 110
X LIST OF FIGURES
1.2.1. The march plan of Armored Battalion 4
3.1. Schematic view of model development 18
3.2.2.1. Flow charts of Mobilization and Deployment of Armored Battalion 24
3.4.2. A sight of our simulation model 34
4.1.1.1. Normal probability plot of residuals of maximum time in system
measure 38
4.1.1.2. Normal probability plot of residuals of number of damaged vehicles
Measure 38
4.1.1.3. Normal probability plot of residuals of number of totally destructed vehicles
measure 38
4.1.2.1. Scatter diagram of variances of maximum time in system measure 39 4.1.2.2. Scatter diagram of variances of number of damaged vehicles measure 40 4.1.2.3. Scatter diagram of variances of number of totally destructed vehicles
Measure 40
4.2.2. Sensitivity analysis of repair teams 43
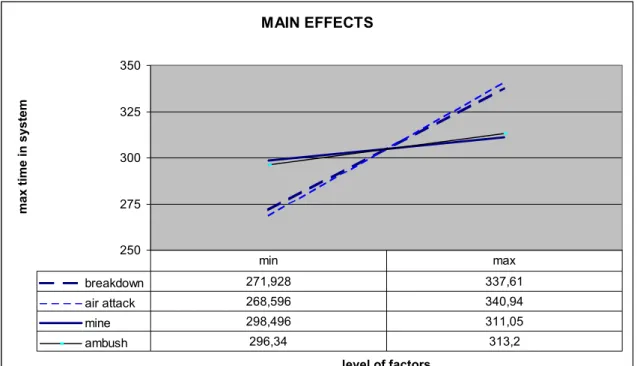
4.3.1.1. Main effect of diagram of five factors for maximum time in
system measure 45
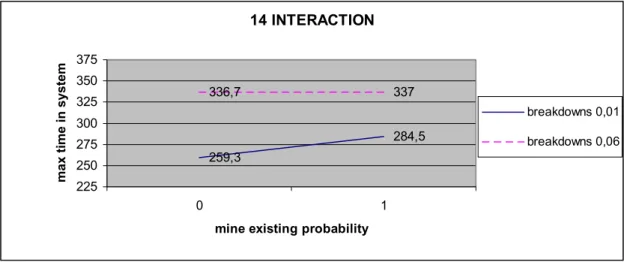
4.3.1.2. Interaction between breakdown of vehicles and air attack of enemy 46 4.3.1.3. Interaction between breakdown of vehicles and minefield of enemy 47 4.3.1.4. Interaction between breakdown of vehicles and ambush of enemy 48 4.3.1.5. Interaction between air attack and ambush of enemy 48 4.4.1.1. Main effect diagram of five factors for number of damaged
vehicles measure 50 4.5.1.1. Main effect diagram of five factors for number of totally destructed vehicles
XI LIST OF TABLES
2.1. Summary table of related literature 14
3.3.1. Readiness and pull-off times of vehicles 31
3.3.2. Repair times of vehicles 31
3.3.3. Hit and kill probabilities of guns used in our model 31
4.1. The factor names and levels 37
4.1.1. Bartlett’s test results for variance homogeneity 39
4.2.1. Results and one-sided confidence intervals for time specifications 41
4.3. Factor names and roles for design points 87
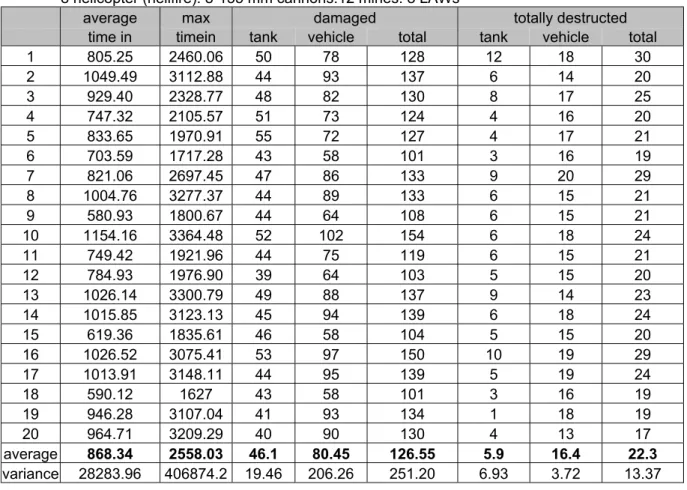
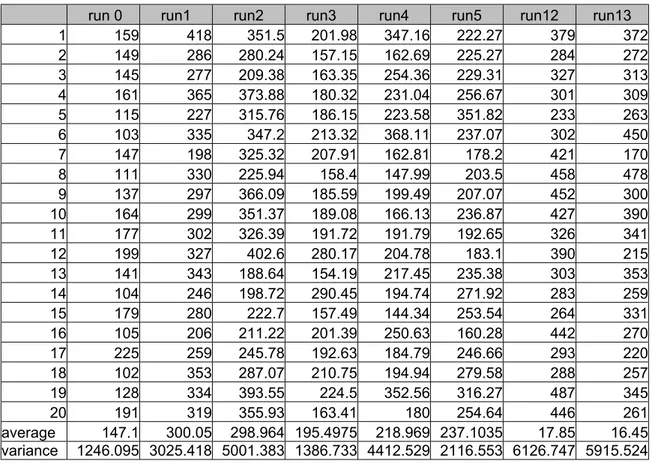
4.3.1. Results, averages and variances of 20 replications for maximum time
in system measure for experimental design 88
4.3.2. Results, averages and variances of 20 replications for maximum time
in system measure for experimental design 88
4.3.3. Results, averages and variances of 20 replications for maximum time
in system measure for experimental design 89
4.3.4. Results, averages and variances of 20 replications for maximum time
in system measure for experimental design 89
4.3.5. Effects and results of Analysis of Variance for maximum time in
system measure 90
4.4.1. Results, averages and variances of 20 replications for number of damaged vehicles
measure for experimental design 91
4.4.2. Results, averages and variances of 20 replications for number of damaged vehicles
XII 4.4.3. Results, averages and variances of 20 replications for number of damaged vehicles
measure for experimental design 92
4.4.4. Results, averages and variances of 20 replications for number of damaged vehicles
measure for experimental design 92
4.4.5. Effects and Results of Analysis of Variance for number of damaged vehicles
measure 93
4.5.1. Results, averages and variances of 20 replications for number of
totally destructed vehicles measure for experimental design 94 4.5.2. Results, averages and variances of 20 replications for number of
totally destructed vehicles measure for experimental design 94 4.5.3. Results, averages and variances of 20 replications for number of
totally destructed vehicles measure for experimental design 95 4.5.4. Results, averages and variances of 20 replications for number of
totally destructed vehicles measure for experimental design 95 4.5.5. Effects and Analysis of Variance for number of totally destructed vehicles measure
96 4.6.1. Summry table of significant factors and interactions 55 5.1. Results of 20 replications for maximum time in system measure for
Regions 98
5.2. Results of 20 replications for maximum time in system measure for
Regions 99
5.1.1. Final averages and rankings of regions of Turkey according to the
maximum time in system measure 59
XIII 5.3. Results of 20 replications for average time in system measure for
regions 101
5.2.1. Final averages and rankings of regions of Turkey according to the average time in system measure 60 5.4. Results of 20 replications for number of damaged vehicles measure for regions 102
5.5. Results of 20 replications for number of damaged vehicles measure for regions 103
5.3.1. Final averages and rankings of regions of Turkey according to the number of damaged vehicles measure 61
5.6. Results of 20 replications for number of totally destructed vehicles measure for regions 104
5.7. Results of 20 replications for number of totally destructed vehicles measure for regions 105
5.4.1. Final averages and rankings of regions of Turkey according to the number of totally destructed vehicles measure 62 5.5.1. Objective matrix of three performance measures for AHP 63
5.5.2. Normalized objective matrix and weights of regions for AHP 64 5.5.3. The results and weights of regions for AHP 65
5.5.4. Final scores of regions via AHP 65
5.6.1. The number of damaged-wheeled trucks by five factors 106
5.6.2. The number of damaged-wheeled trucks by five factors 106
5.6.3. The number of damaged armored vehicles by five factors 106
XIV
5.7.1. The number of totally destructed-wheeled trucks by five factors 107
5.7.2. The number of totally destructed-wheeled trucks by five factors 107
5.7.3. The number of totally destructed armored vehicles by five factors 107
5.7.4. The number of totally destructed armored vehicles by five factors 107
6.1.1. Rankings of factors for Eastern Black Sea (Armenia) border 69 6.1.2. Rankings of factors for Iran border 70
6.1.3. Rankings of factors for Iraq border 70
6.1.4. Rankings of factors for Syria border 70
6.1.5. Rankings of factors for Greece border in Trakya 70
6.1.6. Rankings of factors Bulgaria border 70
6.1.7. Rankings of factors for Greece border in Aegean 71
6.1.8. Rankings of factors for Mediterranean border 71 6.1.9. Rankings of factors for Middle Anatolia 72 6.1.10. Rankings of factors for Middle Black Sea 72
7.1.1. Results of limit scenario 1 75
7.1.2. Results of limit scenario 2 76
7.3.1. Summary table of results of limit scenarios 76
XV GLOSSARY
AIR ATTACK: Assault with air combat vehicles (warplane, helicopter).
ALERT DISPERSION AREA: Area where the troops spread for minimizing the casualties during an enemy attack.
ALERT AND MOBILIZATION PLAN: The plan that troops execute for being ready for combat as soon as possible.
AMBUSH: An unexpected, trap-type military operation.
ARTILLERY ATTACK: Assault with the artillery guns (cannons).
ASSEMBLY AREA: The area where troops make last preparations for further military operations.
BREAKDOWN: Malfunctioning of the vehicles.
DEPLOYMENT: The strategic relocation and concentration of forces and their support base (manpower and logistics) from barrack into a theater.
MARCH: Travelling of troops under the threat of enemy. MINEFIELD: An area where the ground mines are positioned.
MOBILIZATION: A process by which the armed forces reach a state of enhanced readiness in preparation for war or other national emergencies.
1
CHAPTER 1
INTRODUCTION
1.1. MOBILIZATION AND DEPLOYMENT PLAN OF AN ARMORED BATTALION
Mobilization describes a process by which the armed forces reach a state of enhanced readiness in preparation for war or other national emergencies. It includes activating all or part of the reserve component as well as assembling and organizing personnel, supplies, and material prior to deployment. Strategic deployment is the strategic relocation and concentration of forces and their support base (manpower and logistics) from barrack into a theater. Deployments may take the form of a forcible entry for crisis response or unopposed entry for natural disasters or humanitarian (Department of Army, 1996). We do not handle the activities of the reserve components; we deal with the activities of active components of an Armored Battalion.
We model the mobilization and deployment of an Armor Battalion to Assembly Area via simulation. The aim of mobilization and deployment is to be ready for combat with minimum casualties and equipment loss. This activity has to be made as soon as possible, because it occurs under the disturbance of enemy, any lateness can cause many human casualties. Because of that reason evaluation of mobilization and deployment plan has great importance in military.
An armored battalion is formed from four companies. First three companies are identical armored (tank) companies; the other one is Headquarters and Headquarters Company. In our simulation model an Armored Company has nine wheeled trucks,
2
fourteen armored vehicles (13 tanks and 1 APC). The Headquarters and Headquarters Company has twenty-three armored vehicles, seventy-five, wheeled trucks. In total Armored Battalion have 65 armored vehicles and 102-wheeled trucks.
As a strategy when there is a sense of danger or threat, Turkish Army starts to load ammunition, gas and equipment to the vehicles for being totally ready for future operations. So when the alert order is announced, most of equipment and ammunition has already been loaded. Troops only make partial loading after alert order.
Mobilization starts with the alert order, immediately soldiers start to make partial loading of equipment and guns quickly. Without waiting others, each vehicle starts to travel from garages to Alert Dispersion Area individually to minimize the casualties and vehicle losses caused by enemy attacks. The breakdown of vehicles may occur in garage after alert order, the other vehicles pull off the broken vehicles to the Alert Dispersion Area. In daytime at most in half an hour, at night in 45 minutes from the alert order, Armored battalion has to complete its deployment to Alert Spread Area. After an hour from the alert order, reconnaissance group starts to travel Assembly Area to secure the roads and Assembly Area from enemy. Approximately after two hours from the alert order, main troops have to be ready for travelling to Assembly Area.
In Alert Dispersion Area, Armored Battalion members make preparations for travelling to Assembly Area that is the last place to complete the preparations for combat. During travel, vehicle breakdowns can occur, enemy can make air and artillery assaults, lay ambush and use ground mines to destruct vehicles and kill soldiers. These assaults of enemy cause vehicle destruction and delay that will affect the success of further operations. When a vehicle is shot, its crew moves off the vehicle out of road not to prevent traffic and tries to repair. If the damage is not repairable for the crew, they
3
wait for the maintenance team. Maintenance team arriving shot area immediately begins to repair the vehicle. If vehicle is destructed completely, it is left in a safe region with its crew, and maintenance team continues travelling. In our study, activity ends when the troops reach Assembly Area. We do not deal with the activities in Assembly Area. The figure 1.2.1. shows the travel plan of Armored Battalion.
We study on the system that starts with the alert order, and ends with the arriving of all vehicles to Assembly Area. We do not cope with the activities before the alert order, and we assume that before the alert order, ammunition and fuel oil loadings are completed, and most of the equipment is loaded to wheeled-trucks. We analyze the system in the name of vehicles; we do not deal with the soldiers individually.
In this study, we evaluate the performance of existing Mobilization and Deployment Plan of a Turkish Armored Battalion. The objectives of this study are to examine the behavior of existing Mobilization and Deployment Plan of an Armored Battalion in Turkish Army, establish the nature of relationship among one or more significant factor and the system performance, analyze the efficiency of this plan, compare different scenarios and improve system performance. We also try to detect the most hazardous border of Turkey and the most hazardous factor for each border, and discover the system limits. We focus on five factors that are breakdowns of vehicles, air attack, artillery attack, mine fields and ambushes of enemy in our study.
We give a brief summary of usages below. In the situation of the system does not work properly, we try to detect the major problem areas (bottlenecks) of the system by sensitivity analysis, then propose the modifications to make the system work properly. Determining the significant effects of five factors that we state above can be useful information for development of the national defense plans.
4
GARAGES
Wheeled truck path Armored vehicle path
Figure 1.2.1. The march plan of Armored Battalion for wheeled trucks and armored vehicles
Armored
Company 1 Headquarters and
Headquarter Company Armored Company 2 Armored Company 3 depot depot depot depot
ALERT DISPERSION AREA Armored Company 1 Armored Company 2 Armored Company 3 Armored Company 3 ASSEMBLY AREA ARMORED BATTALION
5
The defense arrangements may focus on the most significant factors. The most critique
border information may also be used for improvement of the national defense plans.
Selection of the most hazardous factor and rankings of five factors according to the
threat for each border of Turkey may guide the commanders of these armored battalions
for deciding which factors they should emphasize on during the planning of the field
exercises. Being aware of his Armored Battalion’s limits, commanders can make more
healthy decisions that may have chanced the faith of the war.
Chapter organization is as follows. Chapter 2 presents the related literature with
the simulation software and methods; the requirements of military simulation modeling;
combat modeling and simulation applications that provide useful information for
modeling combat activities. Chapter 3 interprets the implementation of simulation model
of Mobilization and Deployment Plan of a Turkish Armored Battalion. Chapter 4
presents experimental design of five factors that breakdown of vehicles, air attack,
artillery attack, minefields and ambushes of enemy. We implement the ANOVA
procedure to find out the significant factors for three different performance measures in
6
Turkey out of ten for three different performance measures and we also apply analytic
hierarchy process to identify a mutual most critique region for all of three performance
measures. Chapter 6 interprets the ranking and selection of the most critique factor out of
five factors for each of ten regions in Turkey. Chapter 7 presents the limits of an
Armored Battalion executing the Mobilization and Deployment Plan. In Chapter 8, we
give the conclusions of the research. As a final step, ideas and suggestions for future
researches are listed. In Appendices, outputs and some figures of armored battalion are
7
CHAPTER 2
LITERATURE REVIEW
During the literature review, we have not come across any study that is directly related with our topic. We meet some of abstracts of military researches conducted in U.S. but because of privacy of topic, they are not open to publication. So we cannot get detailed information about these military researches. Instead, we present the references in three groups that are the simulation software and methodology, military simulation, and combat simulation (war gaming). As a final step, we give the summary table of related literature in Table 2.1.
2.1. SIMULATION SOFTWARE AND METHODOLOGY
We construct the frame of our simulation model, verify and validate it under the light of some of techniques and ideas presented in the papers in this part of literature review.
Throughout our study we use the basic principles, which stated in Banks (1998). In this study, the author explains the fundamentals of the modeling methodologies, gives brief information about the use of simulation and then recommends a stepwise logic for all phases of simulation. In our thesis, we use ARENA software for coding system because it is a powerful tool that meets all of our requirements. Takus and Profozich (1997) explain the software and its capabilities in their tutorial.
Sergeant (1998) discusses approaches to verification and validation of simulation models and how model verification and validation relate to the model development
8
process. After defining various validation techniques he describes conceptual model validity, model verification, operational validity, and data validity and recommends a procedure.
Kleijnen (1999) explains which statistical techniques can be used to validate simulation models depending on which real-life data are available. He categorizes the situations as the cases of having no data, only output data, both input and output data. To explain these three cases he provides some case study summary.
Alexopoulos and Seila (1998), Kelton (1997), Centeno and Reyes (1998), and Sanchez (1998) all study on the procedures, techniques about the simulation output analysis. We use the techniques determined for the terminating systems.
2.2. MILITARY SIMULATION
The papers in that section discuss the general military issues and necessary techniques for military modeling and simulation. By the help of this literature, we understand the military aspect of simulation and recognize the differences of military simulation. We take the guidance of these papers for overcoming of the problems that we encounter during the model development (lacking of real data, etc.). We also implement techniques for verification, validation and accreditation of military models mentioned in some of these papers.
Page and Smith (1998) give the overview of military training simulation in the form of an introductory tutorial. They provide basic terminology, and current trends and research focus in the military simulation domain. Also they explain verification, validation and accreditation of military models.
9
programming as a possible solution to problems that beset current simulation tools in the paper of Painter (1995). He mentions about the benefits that are object reuse (sharing objects between simulations), data hiding (encapsulation), and code reuse and extension (polymorphism) and also the associated cost as a paradigm. Finally he states that the immediate need facing the military simulation is to agree on and build a framework for object-oriented simulations.
Smith (1998) identifies and explains essential techniques necessary for modern military training simulations. He provides a brief historical introduction; discussion of system architecture; multiple interactive training simulations; event and time management; distributed simulation; and verification, validation, and accreditation. After all, he discusses the fundamental principles in modeling and specific military modeling domains. While discussing the fundamental principles of modeling, he stresses on the importance of modeling the right problem, complete and accurate understanding, credibility and construction of the model subject to some constraints. Under the heading of physical modeling, he focuses on the importance and usage of physical objects, which include vehicles, people, and machinery involved in the activities of moving, perceiving other objects, and interacting with them in the military simulations. Behavioral, environmental and multi-resolution modelings are the other discussed subjects in his study.
Kang and Roland (1998) discuss the military simulation within the subjects of organizations that deal with and their areas of study, classification of military simulation, simulation as a training tool, and applications. They stress on the subjects of advanced distributed simulation, distributed interactive simulation, and high-level architecture.
10
in which military simulation is categorized as including engineering models, analyses models and training models. The members answer the questions about their background; goals and objectives of their involvement in modeling and simulation; HLA studies; major problems in the current state of modeling and simulation development and use; today’s major modeling and simulation opportunities and challenges.
Sisti (1996) studies on the topics of interest to researchers in the simulation community and present some of selected Air Force programs. He deals with the wide variety of research issues in simulation science being presented by government, academia and industry, and their application to the military domain.
Hatley (1997) discusses the difficulties, ways and cost of the military simulation model validation and verification. He compares the other simulation models with the military ones in terms of validation, verification and accreditation.
Kathman (1995) summarizes the data collection process in field combat simulation of U.S. Army. He describes four basic types of instrumentation that have been developed to assist data collection in field combat simulation and gives explanations of these four basic types.
2.3. COMBAT MODELING AND SIMULATION (WAR-GAMING)
Our simulation model is an example of combat simulation because it includes the combat activities (air attack, artillery assault, mine fields and ambushes of enemy). We give the some of the applications of war-gaming in that section. To reach detailed information about war-gaming applications is nearly impossible because they are kept as secret projects. Under the light of limited information, we implement some of war-gaming modeling techniques used in these combat simulation applications for some parts
11 of our model during the model development.
Caldwell, Wood and Pate (1995) summarize a two-year project, called JLINK, which enables the JANUS, Army constructive interactive simulation to be connected to manned land and air combat vehicle simulators, using Distributed Interactive Simulation (DIS) Protocol Data Units (PDU). The JLINK project was one of the firsts to demonstrate that a constructive simulation can be connected to and realistically interact with DIS compliant virtual combat vehicle and aircraft simulators. They discuss how this was accomplished, highlight the major considerations involved, and describe the interface model that was developed to connect JANUS to the DIS world.
Parker (1995) explains a unique approach developed for analyzing force structures of the armed forces of U.S. With this approach, new ways of measuring combat readiness are available to ensure that the armed forces remain ready to fight during the defense draw down of the 1990s. He explains a network representative language Dynamic Simulation that combines the continuous variable features of system dynamics and the discrete event features of conventional simulation techniques.
Mostaglio, Johnson and Peterson (1993) give an overview of a Distributed Interactive Simulations (DIS) training system used by Army, which is called The Close Combat Tactical Trainer (CCTT). They discuss how it will use the DIS standard protocols and semi-automated forces within its architecture, the program’s development methodology, and its role in future Army training.
Childs and Lubaczewski (1987) propose a simulation model used for training Brigade and Battalion commanders and their staffs to exercise procedures and decision-making skills. They briefly address the background of command and control training and provide an in-depth discussion of the COMBAT-SIM model.
12
Parker (1991) gives an overview of combat vehicle reliability assessment simulation model, which portrays the disposition, or status of vehicles over time. He also suggests using this information to initialize the other combat models in which reliability may not previously have been a consideration.
Allen and Wilson (1988) describe a methodology for developing combat simulations that may be readily tailored to specific study issues, and structured so as to threat both qualitative and quantitative variables using the natural language of military planners. This methodology was developed for the RAND Strategy Assessment System (RSAS) and exploits a new programming language called RAND-ABEL. They also explain in what areas RAND-ABEL language is used.
Blais (1994) gives the description of a computer assisted, two-sided warfare gaming system designed to support training of U.S. Marine Corps commanders and their staffs. He explains development phases and usage areas of this simulation system, which is called The Marine Air Ground Task Force Tactical Warfare Simulation.
Henry (1994) describes The Corps Battle Simulation as a standard tool for training commanders and their staffs in U.S. Army. This simulation model is written in C programming language, and combat is modeled mathematically using Lanchester-type equations as described by Taylor (1981). He also stated the hardware and evolution of The Corps Battle Simulation.
Youngren, Parry, Gaver and Jacobs (1994) give description of a research conducted at the Naval Postgraduate School into new methodologies for joint theater-level combat simulation modeling, emphasizing C31, operational intelligence, decision making under certainty, and aggregated stochastic process modeling. Research outcomes to date as well as a prototype software tool are described in their paper.
13
Russell and McQuay (1993) give an overview of a system called The Joint Modeling and Simulation System (J-MASS) whose development standards and software tools support a disciplined approach to the development, configuration, operation, and analysis of digital models and simulations. They explain that J-MASS provides a common modeling architecture with a library of verified and validated software components and models of weapon systems developed by different military communities for Department of Defense. Oswalt (1995) presents the technologies critical to military simulation, summarizes their status, proposes a concept of what technologies are likely to be applied in the future military simulations, and concludes with a review of two current simulation architectures-SIMOBJECT and J-MASS.
Garrambone (1992) gives an overview of one of the most difficult topics of Operations Research- combat modeling and simulation. He describes a team leader standpoint, the requirements, which drive the modeling process used to support DoD studies. He discusses models, (sources and construction notes), scenarios, data, computer concepts, team composition, and many other important considerations needed to accomplish the analytical study tasks. The reader, novice or seasoned, will find that this approach to the subject contains insights rarely found in manuals, covering topics from defining the study environment, to the techniques for presenting study results.
Garrabrants (1998) proposes “an expansion of simulation systems’ role to support all levels of command and control functioning, especially staff planning after receipt of orders and mission rehearsal” in this study. He explains how Marine Tactical Warfare Simulation (MTWS), an advanced simulation system, is used to model all aspects of combat (air, land, sea, and amphibious ship-to-shore activities) and gives detailed information about its usage. We give summary of related literature in Table 2.1.
14 Table 2.1. Summary table of related literature Simulation
Software and Methodology
Takush and Profozich (1997) Sargent(1998)
Sanchez (1998) Kleijnen (1999)
Alexopoulos & Seila (1998) Centeno & Reyes (1998) Kelton (1997)
ARENA software tutorial Verification and validation of simulation models
ABC’ s of output analysis Statistical techniques and data availability
Advanced methods for simulation output analysis
Simulation output analysis
Statistical analysis of simulation output
Military Simulation
Page & Smith (1998) Painter (1995) Smith (1998)
Kang & Roland (1998) Roland (1998)
Sisti (1996)
Hatley (1997)
Introduction to military training simulation
Object oriented military simulation development and application Essential techniques for military modeling and simulation
Military simulation
The future of military simulation Modeling and simulation technologies for military applications
Verification and validation in military simulation
Combat Modeling and
Simulation
Caldwell & Wood & Pate (1995) Parker (1995)
Mostaglio, et al. (1993) Childs & Lubaczewski (1987) Parker (1991)
Allen & Wilson (1988)
Blais (1994) Henry (1994)
Youngren, et al. (1994) Russel & McQuay (1993) Kathman (1995)
Garrambone (1992) Garrabrants (1998)
JLINK-JANUS fast movers Military force structure and
realignment “ sharpening the edge” through the dynamic simulation The close combat tactical training program
A battalion / brigade training simulation
Combat vehicle reliability assessment simulation model
Modeling qualitative issues in military simulations with the RAND-ABEL language.
Marine air ground task force tactical warfare simulation
The corps battle simulation The future theater-level model The joint modeling and simulation Data collection in field combat simulation
An overview of air land combat modeling and simulation
15
CHAPTER3
THE SIMULATION MODEL
3.1. FORMULATION OF THE PROBLEM AND PLANNING THE STUDY
The objectives of this study are to examine the behavior of existing Mobilization and Deployment Plan of an Armored Battalion in Turkish Army, establish the nature of relationship among significant factors and the system performance, analyze the efficiency of Mobilization and Deployment plan of an Armored Battalion, compare different scenarios and improve system performance. In the case where the system does not work properly, we try to detect the major problem areas of the system, and then propose the modifications to make the system work properly. Specifically, we will attempt to answer the following research questions:
• Is the existing plan efficient?
• After alert order, can whole battalion reach to Alert Dispersion Area in 30 minutes in daytime, 45 minutes at night?
• After alert order, can reconnaissance force at most in one hour, main force in two hours be ready for moving to the Assembly Area?
• Where does the bottleneck occur in the system?
• How does air attack, artillery assault, mine fields and ambush of enemy affect the system performance?
• Which region of Turkey is most vulnerable against enemy attack?
• Which factor(breakdown of vehicles, air attack, artillery assault, mine fields and ambush of enemy ) is the most hazardous for each region of Turkey?
16
• What are the limits of an Armored Battalion executing Mobilization and Deployment Plan?
• Can I suggest a better alternative plan?
The performance measures under consideration are:
• Average time in system measure of last vehicle reaching the assembly area • Average time in system measure of vehicles
• Number of damaged vehicles
• Number of totally destructed vehicles
Since the mobilization and deployment are a part of combat, the data requirements are hard to provide. The data requirements of our simulation model are:
• Loading time data
• Velocities of tanks and wheeled trucks
• Repairing time distributions of damaged vehicles by breakdowns, air attack, artillery attack, mine and ambush
This study helps to see how the Mobilization and Deployment Plan works, how the behavior of system changes under the certain conditions and different scenarios. The end user of this study is Armored Battalion Commanders of Turkish Army. We model the system by using the following assumptions:
• Armored Battalion in our model is an independent mission battalion • Basic unit is company
• The construction of Armored Battalion is in Appendix and it is taken from the Turkish Military Logistics Procedure (1994).
17 • Velocity of wheeled trucks are 40 km/h • Ambush guns are 4 LAWs
• Artillery guns are 4 155mm. Cannons • Air attack gun is 1 F-16 war plane
• Mine density on the path of vehicles is 6 anti-tank mines in a 8*8 mine field
3.2. MODEL DEVELOPMENT
First, we start with the forming the conceptual model to develop our simulation model. During this phase, we consult the Armored Battalion, Armored Company and Team commanders who are the main actors of Mobilization and Deployment Plan. We also interview with the staff officers who are the experts of planning of military operations to build the logical model. Then we write the code of model by using ARENA software. Figure 3.1 gives the schematic view of model development.
Figure 3.1.Schematic view of model development
3.2.1. CONCEPTUAL MODEL
We form a conceptual model of Mobilization and Deployment Plan of Armored Brigade to convert the real system into a simple system to examine the structure and components, which should be included. The Mobilization and Deployment Plan is
REAL WORD SYSTEM ASSUMED SYSTEM CONCEPTUAL MODEL LOGICAL MODEL SIMULATION MODEL
18
used by all troops in Turkish Army. The frame of plan is the same for all kinds of troops (armored, artillery, infantry etc.). Only minor differences are made to plan according to the positioning and structure of troop, mission type etc. During conceptualization, we interview with armored battalion, company, team commanders and staff officers. The basic elements of the simulation model is given below:
Events:
Events are instantaneous occurrences that change the state of the system. The lists of events that occur in our simulation model are:
• Announcement of alert order event: The alert order is given to battalion by the intelligence service. Soldiers take their personal equipments and guns, and then make partial loading of equipment to the wheeled trucks.
• Departure of vehicles from garages event: After the completion of loading and preparation, vehicles start to travel to Alert Dispersion Area independent of others. • Arrival of vehicles to Alert Dispersion Area event.
• Departure of reconnaissance force from Alert Dispersion Area event: The reconnaissance force starts to travel to Assembly Area for securing the roads and Assembly Area.
• Breakdown of vehicles during march from Alert Dispersion Area to Assembly Area event: The broken vehicle is moved off the road not to prevent traffic flow and wait for repairing by maintenance team.
• Air attack of enemy during march event: The damaged vehicle is moved off the road not to prevent traffic flow and wait for repairing by maintenance team. If the vehicle is totally destructed, it is left in a safe area. The same procedure is also valid for in the situation of artillery assault, ambush and mine fields.
19 • Artillery assault of enemy during march event. • Hitting ground mines of enemy during march event. • Ambush of enemy event.
• Failure of vehicles because of air and artillery attack, breakdowns, ground mines and ambushes.
• Completion of repair of damaged and broken vehicles event.
• Departure of damaged and broken vehicles from the repair areas event. • Arrival of totally destructed vehicles to a safe area.
• Arrival of vehicles to Assembly Area event.
Entities:
Entities are the objects of an interest in the system that requires an explicit representation in the system. There is only one type of entity in our system and it is vehicles of Armored Battalion.
Attributes:
Attributes are the characteristics of the entities. In our model, we have the following attributes:
• The beginning time of Mobilization activity • Company identification numbers
• Vehicle identification numbers • Type of damage that the vehicle takes
• Air attack identification numbers (helicopter or plane attack)
Activities:
20 • Equipment loading in garages
• March of vehicles from garages to Alert Dispersion Area
• Preparation of main troops of Armored Battalion in Alert Dispersion Area for march to Assembly Area
• March of Armored Battalion from Alert Dispersion Area to Assembly Area
Exogenous Variables (Input Variables):
We have two types of input variables: decision variables(controllable variables) and parameters(uncontrollable variables).
Decision Variables:
• Velocity of vehicles
Parameters
• Time that we spent for partial loading of equipment and preparation for march to Alert Dispersion Area (most of the equipment (ammunition, guns etc.) is loaded before the alarm order according to the intelligence report, only the equipment that is essential for soldiers to continue their daily activities in barracks is left unloaded.) • Readiness time of reconnaissance force for march to Assembly Area from Alert
Dispersion Area
• Readiness time of main force (Armored Battalion) for march to Assembly Area from Alert Dispersion Area
• Repair time of vehicles broken by breakdowns
• Repair time of vehicles damaged by air attack, artillery assault, mine fields and ambushes
21
Endogenous Variables (Output Variables):
We classify the endogenous variables as state variables and performance measures.
State Variables:
• Number of vehicles waiting in the repair queues
• Number of vehicles that does not damaged or broken in the convoy • State of repair units (busy or idle)
Performance Measures
• Average time in system measure of last vehicle reaching the assembly area • Average time in system measure of vehicles
• Number of damaged wheeled trucks because of breakdowns • Number of damaged wheeled trucks because of air attack • Number of damaged wheeled trucks because of artillery assault • Number of damaged wheeled trucks because of ground mines • Number of damaged wheeled trucks because of ambush • Number of damaged armored vehicles because of breakdowns • Number of damaged armored vehicles because of air attack • Number of damaged armored vehicles because of artillery assault • Number of damaged armored vehicles because of ground mines • Number of damaged armored vehicles because of ambush
• Number of totally destructed wheeled trucks because of breakdowns • Number of totally destructed wheeled trucks because of air attack • Number of totally destructed wheeled trucks because of artillery assault
22
• Number of totally destructed wheeled trucks because of ground mines • Number of totally destructed wheeled trucks because of ambush • Number of totally destructed armored vehicles because of breakdowns • Number of totally destructed armored vehicles because of air attack • Number of totally destructed armored vehicles because of artillery assault • Number of totally destructed armored vehicles because of ground mines • Number of totally destructed armored vehicles because of ambush • Total number of damaged vehicles
• Total number of totally destructed vehicles
3.2.2 LOGICAL MODEL
Logical model shows the relationships among the elements of the model. We construct the logical model of Mobilization and Deployment Plan of a Turkish Armored Battalion. Our model starts with the receiving of alert order and ends with the occupation of Assembly Area by the Armored Battalion. The main events that our model includes are the partial loading of the wheeled-trucks, march of Armored Battalion from garages to Alert Dispersion Area, march from Alert Dispersion Area to Assembly Area, and attacks of enemy against the Armored Battalion during this march. During the construction of logical model, we take the consultancy of Armored Battalion and Company commanders who are the executers of the Mobilization and Deployment Plan. We present the relationship among the elements of the Mobilization and Deployment Plan of an Armored Battalion in Figure 3.2. as flow charts.
23
Figure 3.2. Flow chart of Mobilization and Deployment of Armored Battalion Alarm order is given
Soldiers take their personal equipment and run to garages
Partial loading of equipment is done
One wheeled truck is immediately be ready for travel headquarters building for command equipment
Does breakdown occur? YES N O Repair
Start to travel headquarters building
Ready for traveling to Alert Dispersion Area
Does breakdown occur? YES Repair N O Load equipment
Start to travel Alert Dispersion Area
Take the position in Alert Dispersion Area
24
Figure 3.2. Flow chart of Mobilization and Deployment of Armored Battalion (con’t) Preparations for
march (military travel) to Assembly Area
Reconnaissance team starts to travel to Assembly Area Armored Battalion
commander gives the march order to main units of battalion Main units continue preparation for march Start march to Assembly Area Does usual breakdown occur during march? N O YES Repairable? NO Leave the destructed vehicle in a safe zone with its crew. Y E S Repair Continue to march (travel) 2 1
25
Figure 3.2. Flow chart of Mobilization and Deployment of Armored Battalion (con’t) 2
Air attack of enemy occurs
Move off all vehicles from road for minimize casualty
Wait at least 60 seconds for air attack to pass
Is vehicle
shot? YES Repairable? NO
Leave the vehicle in a safe place with its crew. Y E S Repair N O Continue to march
Artillery assault occurs
26
Figure 3.2. Flow chart of Mobilization and Deployment of Armored Battalion (con’t) Is the vehicle shot? YES Repairable? NO Leave the vehicle in a safe zone with its crew. Y E S N O Repair Go on march to Assembly Area Minefield of enemy exists. Is vehicle hit the mine? YES N O Clear the minefield
Repairable? NO Leave the vehicle with its crew. Y E S Repair Continue march to Assembly Area 4 3
27
Figure 3.2. Flow chart of Mobilization and Deployment of Armored Battalion (con’t) 4
Ambush of enemy occurs.
Is vehicle
shot? YES Repairable? NO
Leave the vehicle in a safe area with its crew. N O Y E S Repair Continue march to Assembly Area
28
3.2.3 SIMULATION MODEL (COMPUTER CODE)
Although our simulation model can be described as a combat simulation, we use ARENA software, which is not a combat simulation package. Because we need a detailed evaluation of Mobilization and Deployment Plan. The Mobilization and Deployment Plan include the activities just before the war. In other words, it organizes the combat preparation and alert activities. It is a detailed plan, and every detail is too important because the objective of plan is to prepare the troops for combat as soon as possible after alert. As time so important, to model the details is also important. The currently available combat simulation packages in Turkish Army do not support such kind of detailed modeling. The most available combat simulation package in Turkish Army for our subject is JANUS. But it is especially used for modeling the combat area activities. The Alert, Mobilization and Deployment Plan organizes the combat preparation and alert activities, not the combat. The details that JANUS cannot model are stated below:
1) The preparation period which soldiers take their equipment and guns. 2) Loading of equipment to the lorries.
3) The details of modeling the transportation of soldiers and equipment with vehicles. These activities cannot be modeled with JANUS. Thus, we use ARENA software for modeling The Alert, Mobilization and Deployment Plan of an Armored Battalion in Turkish Army. ARENA software is a flexible and powerful tool that allows modeling all the activities of mobilization and deployment plan of Armored Battalions. It also provides creating animated models and offers reasonably good simulation input and output process. We have only one animated model. The computer codes of model occupy 4.68 MB. We give a small part of the code of our simulation model in Appendix D.
29
3.3 INPUT DATA ANALYSIS
As our simulation model is a combat simulation model, we face with lackg of real data problem. To overcome this problem, we use triangular distributions as recommended by Banks (1998). We interview with the armored battalion, armored company and the armored team commanders who are the real executers of Mobilization and Deployment Plan to determine the triangular distributions of activities. We also take some of data from the Army Field Manuals that are written according to the combat experiences. We convert these types of raw data into the triangular distributions via consulting the experts. We take hit and kill probabilities of guns, and vulnerability of combat vehicles from the databases of JANUS software. We give the lists of random variables of our simulation model, distribution functions, and their parameters in Table 3.3.1.-Table 3.3.3.
3.4. MODEL VERIFICATION AND VALIDATION
We perform the Verification and Validation (V&V) techniques stated in the Army Pamphlet 5-11 published by Department of Army (1999) and Balci (1998) for all steps of our simulation model.
3.4.1. VERIFICATION
“ Verification of a M&S is the process of determining that an M&S accurately
represents the developer’s conceptual description and specifications” (Army Pamphlet 5-11, 1999). We applied some of techniques that are stated in Army Pamphlet 5-11 (1999) for verification of our model.
30
Table 3.3.1. Readiness and pull-off times of vehicles
readiness time after alert order pull of time of broken vehicle in garage
wheeled-truck tria (8,10,12) tria (8,12,16)
armored vehicles tria (10,12,16) tria (13,15,17)
Table 3.3.2. Repair times of vehicles
type of damage
1 2 3
wheeled trucks
breakdown tria(15,20,25) tria(30,35,40) tria(45,50,55) air attack tria(35,40,45) tria(40,45,50) tria(55,60,65)
artillery tria(25,30,35) tria(40,45,50) tria(55,60,65) minefields tria(25,30,35) tria(45,60,75) tria(70,80,90)
ambush tria(25,30,35) tria(40,45,50) tria(55,60,65) armored vehicles
breakdown tria(15,20,25) tria(30,35,40) tria(45,50,55) air attack tria(25,30,35) tria(40,45,50) tria(55,60,65)
artillery tria(25,30,35) tria(40,45,50) tria(55,60,65) minefields tria(25,30,35) tria(45,60,75) tria(70,80,90)
ambush tria(25,30,35) tria(40,45,50) tria(55,60,65)
Table 3.3.3. Hit and kill probabilities of guns used in our model
for wheeled trucks for armored vehicles
hit kill hit kill
30 mm cannon (F-16) 0.1 0.65 0.1 0.55
155 mm cannon 0.08 0.5 0.12 0.35
anti-tank mine 0.02 0.72 0.04 0.27
LAW (ambush gun) 0.04 0.8 0.06 0.55
As logical verification:
• Design Walk-Through: We perform design walk-trough with the Armored Battalion and Company commanders who are the execution experts of Mobilization and Deployment Plan to verify the design of our model.
As code verification:
• Sensitivity Analysis: We apply sensitivity analyses to check the algorithms and code to ensure that our model is reacting in expected manner.
31
• Code Walk-Through: We put into practice code walk-through with the
simulation men from our department to ensure the efficiency, correctness,
consistency and completeness in the implementation.
• Automated Test Tool: We use ARENA debugger function as an automated test
tool to check whether the activities in Mobilization and Deployment Plan occur
properly or not.
• Unit Checks: We also put into use unit checks to ensure that the proper units of
measure results from equations used in algorithms and code of our model (km/h
etc.).
• Additional Statistics: We also check the properness of system performance by
using additional output statistics that are verifying our performance measures
(total time in system etc.).
3.4.2 VALIDATION
32
which an M&S accurately represents the intended real world phenomena from the
perspective of the intended use of M&S” (Army Pamphlet 5-11, 1999).
As procedural approaches:
• Peer Review: We realize peer reviews, which are the detailed examination of
input data, key parameters and resulting output with the personnel who are
knowledgeable about modeling the functional areas represented in our model. For
this method, we take the consultancy of the military personnel from I.E.
department.
• Independent Review: We implement review with the people independent of our
model development for validation of our model.
As technical methods:
• Face Validation: We put into service face validation to check if our model
seems reasonable to personnel who are knowledgeable about the Mobilization
33
consultancy of Armored Battalion and Company commanders that are the
executers of plan, staff officers that are the experts of military operation
planning. With little modifications towards their comments, we get reasonable
and satisfactorily result.
• Animation: We check the behavior of our system through time by the
animation, especially the movements of vehicles of Armored Battalion. We give
34 Figure 3.4.2. A sight of our simulation model
3.4.2.2 VALIDATION OF MODEL ASSUMPTIONS
We discussed the structural and data assumptions of our model with two Armored Battalion and Company commanders and one staff officer from Turkish Armor School. They find these assumptions reasonable for our objectives. We could not perform statistical validation of output because we do not have actual combat data to compare.
35
CHAPTER 4
DESIGN AND ANALYSIS OF EXPERIMENTS
Experiments are carried out by investors in all fields of science either to discover something about a particular process or to compare the effect of several factors on some phenomena (Montgomery, 1984). For this part of our study, we look for the answers of questions:
• After alert order, can whole battalion reach to Alert Dispersion Area in 30 minutes in daytime, 45 minutes at night?
• After alert order, can reconnaissance force at most in one hour, main force in two hours be ready for moving to the Assembly Area?
• Where does the bottleneck occur in the system? • Is the existing plan efficient?
• How do air attack, artillery assault, mine fields and ambush of enemy affect the system performance?
We run our simulation model and construct one-sided confidence intervals to check whether the Mobilization and Deployment Plan satisfies the specifications stated in the first and second questions. After constructing the confidence intervals, we see that the existing system meets all the necessary measures. We discuss this procedure in detail in Section 4.2. To answer the fourth and fifth questions, we just run the simulation model and check whether the Mobilization and Deployment Plan satisfies the specifications. We encounter bottlenecks in the repair units of Armored Battalion, because of the longer waiting queues in front of them. By the sensitivity analysis, we find the optimal number of repair units for the Armored Battalion. We also implement 2k factorial design for five
36
factors which are breakdowns of vehicles, air attack, artillery attack, mine fields and ambushes of enemy to find out an answer for the last question. The factors and their levels are presented in Table 4.1. Our aim is to discover the effects and interactions of these five factors on system response. Our performance measures are maximum time in system (time in system of last vehicle reaching Assembly Area), number of damaged vehicles, and number of totally destructed vehicles. As we have five factors, we have 32 design points. To satisfy the normality assumption, we make twenty replications for each design point. Because the maximum time in system measure is one of our performance measures, we should take more replications to satisfy normality. We conduct experiments for each design point with the 20 replications and calculate the effect of each factor and their interactions with each other. We implement analysis of variance (ANOVA) to find out which factor or factors have a significant effect on system performance and by effect diagrams we explain the main effects and interactions of factors. We also check normality of data by normal probability plots of residuals and the homogeneity of variances with scatter diagrams and Bartlett’s test, in Section 4.1.1 and Section 4.1.2 respectively. To ensure the independence, we assign different random number generator for each random activity in our simulation model.
We give a name to each design point; names and the roles of factors for each design point are stated in Table 4 in Appendix B. The expressions “run xyz” in result tables means the replication that the factors x, y and z are at highest levels whereas the others are at lowest levels. Our performance measures are maximum time in system (time in system of last vehicle reaching Assembly Area), number of damaged vehicles, and number of totally destructed vehicles and we have five factors, we implement the procedure below for each performance measure.
37 Table 4.1. The factor names and levels
Lower level Upper level factor description (occurrence probability) (occurrence probability)
1 breakdown 0.01 0.06
2 air attack 0 1
3 artillery attack 0 1
4 minefield 0 1
5 ambush 0 1
4.1. CONFIRMATION OF DATA ASSUMPTIONS
Throughout this chapter we assume that (1) data is independent, (2) variances are homogeny, and (3) the usual normality assumptions are satisfied. To reach correct results, we need to ensure that all the three assumptions hold for our data. For data independency, we assign different random number generators for each random event. We check the normality assumption in Section 4.1.1, homogeneity of variances assumption in Section 4.1.2.
4.1.1 NORMALITY OF DATA
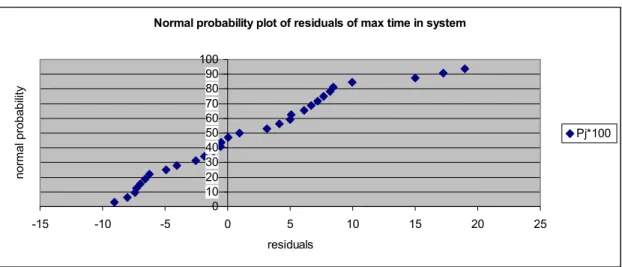
To ensure the normality of data for three performance measures that we use in experimental design, we compute the residuals and draw the normal probability plots of residuals. As all the residual plots in Figure 4.1.1.1 - Figure 4.1.1.3 lie reasonably close to a straight line; we can say that the data of three performance measures are normally distributed.
38
Normal probability plot of residuals of max time in system
0 10 20 30 40 50 60 70 80 90 100 -15 -10 -5 0 5 10 15 20 25 residuals normal probability Pj*100
Figure 4.1.1.1 Normal probability plot of residuals of maximum time in system Normal probability plot of residuals of damaged vehicles
0 20 40 60 80 100 -0,6 -0,4 -0,2 0 0,2 0,4 0,6 0,8 residuals normal probability Pj*100
Figure 4.1.1.2 Normal probability plot of residuals of number of damaged vehicles Normal probability plot of residuals of numberof totally destructed
0 20 40 60 80 100 -0,5 -0,4 -0,3 -0,2 -0,1 0 0,1 0,2 0,3 0,4 residuals normal probabilit y Pj*100
Figure 4.1.1.3 Normal probability plot of residuals of number of totally destructed Vehicles
39
4.1.2 DEPARTURES FROM THE ASSUMPTIONS IN ANALYSIS OF VARIANCES
The assumptions of homogeneity of variances may cause serious problems in ANOVA test if it does not satisfied. To check the homogeneity of variances, we draw scatter diagrams of variances of three performance measures. There is no evidence of correlation of variances in scatter diagrams (Figure 4.1.2.1-4.1.2.3), to be sure the homogeneity, we also implement Bartlett’s test. Bartlett’s tests give that the variances of three performance measures are homogeny. The test results are given in Table 4.1.1. Thus, we can conclude that the homogeneity assumption of variances holds for our data.
Table 4.1.1 Bartlett's test results for variance homogeneity
time in system # of broken vehicles # of totally destructed
grand variance 4134.68 12.91 2.12
q 11.71 18.92 14.88
c 1.02 1.02 1.02
Xo*Xo 26.5 42.79 33.65
chi square(0.05, 31) 44.97 44.97 44.97
test result pass pass pass
max time in system variances
0 2000 4000 6000 8000 0 10 20 30 40 variances Series1
40
number of damaged vehicles variances
0 10 20 30 40 0 10 20 30 40 variances Series1
Figure 4.1.2.2 Scatter diagram of variances of number of damaged vehicles measure
totally destructed vehicle variances
0 2 4 6 8 0 10 20 30 40 variance var
Figure 4.1.2.3 Scatter diagram of variances of number of totally destructed vehicles measure
4.2. EFFICIENCY CHECK OF MOBILIZATION AND DEPLOYMENT PLAN
For the efficiency of the Mobilization and Deployment Plan, we check whether any bottleneck occurs during the execution of the Mobilization and Deployment Plan and whether the Armored Battalion satisfies the Turkish Army time standards or not. For the bottleneck checking, we implement sensitivity analysis. For the control of the time specifications, we construct confidence intervals.
41
4.2.1 TEST WHETHER THE MOBILIZATION AND DEPLOYMENT PLAN MEETS TIME SPECIFICATIONS
There are some time specifications that a Turkish Armored Battalion has to obey while executing the Mobilization and Deployment Plan. First one that we will check is that whole battalion has to reach Alert Dispersion Area in 30 minutes in daytime, 45 minutes at night. Second one is that reconnaissance force at most in one hour; main force in two hours has to be ready for moving to the Assembly Area. In this section, we check whether these specifications are satisfied or not, by constructing one-sided confidence intervals with 0.95 confidence level. Confidence intervals are one-sided because we only have an upper time limit to compare for these activities. We run our model for 20 replications; compute averages, variances and confidence intervals. The results are given in Table 4.2.1.
Table 4.2.1 Results and one-sided confidence intervals for time specifications time of last vehicle reaching Alert Dispersion
Area readiness time for movement
daytime night
average 26.8 37.84 53.51
variance 6.067 5.94 8.35
confidence interval 29.13 40.12 56.71
standard 30 45 60/120
As seen in Table 4.2.1, the confidence intervals reveal that an Armored Battalion can complete the traveling from garages to the Alert Dispersion Area under the time standards 30 minutes at daytime, 45 minutes at night. It also gets ready for traveling to Assembly Area in 53.51 minutes with both reconnaissance and main forces that means it satisfies the time specifications 60 minutes for reconnaissance force, 120 minutes for the main force. Thus, the existing system satisfies all necessary time standards of Turkish