CYANOIRON POLYPYRIDYL SENSITIZED
PHOTOANODES FOR WATER OXIDATION
a thesis submitted to
the graduate school of engineering and science
of bilkent university
in partial fulfillment of the requirements for
the degree of
master of science
in
chemistry
By
Samar Batool
January 2020
CYANOIRON POLYPYRIDYL SENSITIZED PHOTOANODES FOR WATER OXIDATION
By Samar Batool January 2020
We certify that we have read this thesis and that in our opinion it is fully adequate, in scope and in quality, as a thesis for the degree of Master of Science.
Ferdi Karada¸s(Advisor) ¨ Omer Da˘g Burak ¨Ulg¨ut Aysen Yılmaz Yavuz Dede
Approved for the Graduate School of Engineering and Science:
ABSTRACT
CYANOIRON POLYPYRIDYL SENSITIZED
PHOTOANODES FOR WATER OXIDATION
Samar Batool M.S. in Chemistry Advisor: Ferdi Karada¸s
January 2020
Dye-sensitized photoelectrochemical cells (DSPECs), which convert solar energy to hydrogen fuel via water splitting process, has markedly excelled as a mul-tidisciplinary field in the recent years. In this context, transition metal com-plexes (TMCs) are employed as efficient photosensitizers because of their unique photochemical and photophysical properties. Ruthenium complexes, have fre-quently been preferred as both photosensitizers and water oxidation catalysts in DSPECs. However, their toxicity and preciousness have been their main dis-advantages. Much research has now devoted to search for highly desirable al-ternatives. Hexacoordinated Fe-complexes (Fe(II)L6), being earth abundant and
chemically stable, have attracted many researchers in this respect. Unfortunately, metal-to-ligand charge transfer (3M LCT ) states of Fe-complexes experience ul-trafast deactivation process into metal centered (MC) states lying lower in energy with respect to MLCT states, becoming unfavorable for electron injection into TiO2. A fundamental approach is to destabilize these MC states by associating
strong field ligands with Fe-center. Given the strong sigma-donating ability of cyanide ligand, the sensitization performance of cyanoiron polypyridyl complexes has also been investigated in earlier studies revealing excited state lifetimes much lower than desired.
Herein, my study aims to tackle this problem by assisting donor iron com-plex not only with electron-donating cyanide groups but also with cobalt ions that are coordinated to nitrogen atoms of cyanide ligands. For this purpose, a series of cyanoiron polypyridyl complexes with different polypyridyl groups and different number of cyanide groups were prepared. These complexes were char-acterized by multiple techniques including UV-Visible absorption spectroscopy (UV-Vis), Fourier transform infrared spectroscopy (ATR-FTIR), X-ray photo-electron spectroscopy (XPS), Scanning photo-electron microscopy (SEM), and Energy
dispersive X-ray analysis (EDX).
The foundation of this thesis is mainly built on the development of dye-sensitized water oxidation photoanodes. In this study, water oxidation catalytic cobalt sites were connected to iron chromophores through cyanide bridging group affording Prussian blue layer. The effect of cyanide ligands on the rate of charge transfer has also been investigated. Various material characterizations were done to inquire about the effect of cyanide ligands and cobalt catalyst.
Photoelectrochemical studies performed on four different dye-sensitized pho-toanodes reveal that both the type of polypyridyl ligand and the number of cyanide groups play a critical role on the efficiency of the iron photosensitizer. The results of this study suggest that Prussian blue analogues incorporating cyano-iron polypyridyl complexes could be promising assemblies for building efficient DSPECs.
Keywords: Iron-based photosensitizers, Photosensitizer-water oxidation catalyst dyad, Water splitting, Prussian blue analogues, Photoelectrochemical water oxi-dation.
¨
OZET
SU OKS˙IDASYONU ˙IC
¸ ˙IN S˙IYANODEM˙IR POL˙IPR˙ID˙IL
DUYARLI FOTOANODLAR
Samar Batool Kimya, Y¨uksek Lisans Tez Danı¸smanı: Ferdi Karada¸s
Ocak 2020
Suyu ayırma i¸slemi ile g¨une¸s enerjisini hidrojen yakıtına d¨on¨u¸st¨uren, boyaya duyarlı fotoelektrokimyasal h¨ucreler son yıllarda belirgin bir ¸sekilde multidisi-pliner alan olarak ¨one ¸cıkmı¸stır. Bu ba˘glamda, ge¸ci¸s metali kompleksleri, e¸ssiz fotokimyasal ve fotofiziksel ¨ozelliklerinden ¨ot¨ur¨u verimli fotosensitizerler olarak kullanılmaktadır. Rutenyum kompleksleri, boyaya duyarlı fotoelektrokimyasal h¨ucrelerde hem fotoduyarla¸stırıcılar hem de su oksidasyon kataliz¨orleri olarak ¸co˘gunlukla tercih edilmektedir. Fakat onların zehirli ve kıymetli olu¸sları on-ların esas dezavantajları olmu¸stur. S¸imdilerde hemen hemen ¸co˘gu ara¸stırma al-ternatiflerini ara¸stırmaya y¨oneldi. D¨unyada bolca bulunan ve kimyasal a¸cıdan kararlı olan altı ligandlı demir kompleksleri (Fe(II)L6) bir¸cok ara¸stırmacının bu
konuda ilgisini ¸cekmektedir. Maalesef, demir-komplekslerinin metalden liganda y¨uk transferi enerjide daha d¨u¸s¨uk yatan metal merkezli durumlara ultra hızlı deaktivasyon s¨ureci ya¸sar ve TiO2’ye elektron enjeksiyonu i¸cin elveri¸ssiz hale gelir.
Esas yakla¸sım, g¨u¸cl¨u alan ligandlarını demir-merkezi ile ili¸skilendirerek bu metal merkezli durumlarını istikrarsızla¸stırmaktadır. Siyan¨ur ligandının g¨u¸cl¨u sigma verme kabiliyetine ra˘gmen, daha ¨onceki ¸calı¸smalarda siyanoron polipiridil kom-plekslerinin duyarlılık performansı ara¸stırılmı¸s ve uyarılmı¸s haldeki s¨uresi arzu edilenden ¸cok daha d¨u¸s¨uk oldu˘gu g¨osterilmi¸stir.
Bu ¸calı¸sma, don¨or demir kompleksine sadece elektron veren siyan¨ur gru-plarında de˘gil, ayrıca siyan¨ur ligandlarının azot atomlarına koordine edilen kobalt iyonlarında da yardımcı olarak bu sorunu ¸c¨ozmeyi ama¸clıyor. Bu ama¸cla, farklı polipiridil gruplarına ve farklı sayıda siyan¨ur grubuna sahip bir dizi siyanodemir polipridil kompleksleri hazırlanmı¸stır. Bu kompleksler, ultraviyole g¨or¨un¨ur spek-troskopi, Fourier d¨on¨u¸s¨uml¨u kızıl¨otesi spektroskopisi, X-ı¸sını fotoelektron spek-troskopisi, taramalı elektron mikroskobu ve enerji da˘gıtıcı X-ı¸sını spektroskopisi
gibi bir¸cok teknikle karakterize edildi.
Bu tezin temeli esas olarak boyaya duyarlı su oksidasyon foto-anodlarının geli¸stirilmesi ¨uzerine kurulmu¸stur. Bu ¸calı¸smada, su oksidasyon katalitik kobalt b¨olgeleri koyu lacivert tabakası veren siyan¨ur k¨opr¨uleme (bridging) grubu yoluyla demir kromoforlarına ba˘glanmı¸stır. Siyan¨ur ligandlarının y¨uk ak-tarma hızı ¨uzerindeki etkisi de ara¸stırılmı¸stır. Siyan¨ur ligandlarının ve kobalt kataliz¨or¨un¨un etkisi hakkında ara¸stırma yapmak i¸cin ¸ce¸sitli malzeme karakteri-zasyonları yapılmı¸stır.
Boyaya duyarlıla¸stırılmı¸s d¨ort farklı fotoanodları ¨uzerine yapılan fotoelek-trokimyasal ¸calı¸smalar, hem polipiridil ligand tipinin hem de siyan¨ur grup sayısının demir fotosensitiz¨or¨un¨un verimlili˘gi ¨uzerinde kritik bir rol oynadı˘gını ortaya koymaktadır. Bu ¸calı¸smanın sonu¸cları, siyanoron polipiridil komplek-slerini i¸ceren koyu lacivert analoglarının, etkili boyaya duyarlı fotoelektrokimyasal h¨ucreleri olu¸sturmak i¸cin umut verici d¨uzenekler olabilece˘gini ¨one s¨urmektedir.
Anahtar s¨ozc¨ukler : Demir bazlı fotosensitizerler, Fotosensitiz¨or-su oksidasyon kataliz¨or¨u dyad, Su yarma, Prusya mavisi analogları, Fotoelektrokimyasal su ok-sidasyonu.
Acknowledgement
First and Foremost praise is to ALLAH, the Almighty, the greatest of all, on whom ultimately we depend for sustenance and guidance. I would like to thank Almighty Allah for giving me opportunity, determination and strength to do my research. His continuous grace and mercy was with me throughout my life and ever more during the tenure of my research.
I would like to thank my thesis advisor Ass. Prof. Ferdi Karada¸s of the Chemistry Department at Bilkent University. The door to Prof. Karada¸s office was always open whenever I ran into a trouble spot or had a question about my research or writing. He consistently allowed this paper to be my own work, but steered me in the right the direction whenever he thought I needed it.
I would also like to thank the experts who were involved in the validation survey for this research project: [Prof. Omer Da˘¨ g, Prof. B¨urak ¨Ulg¨ut, Prof. Aysen Yılmaz, Prof. Yavuz Dede]. Without their passionate participation and input, the validation survey could not have been successfully conducted.
Besides my research activities, I also enjoyed my stay in Bilket University. I thank my fellow colleagues for playing counterstrike in lab during leisure hours. Thanks for giving me such a joyful time.
Finally, I must express my very profound gratitude to my parents, my siblings (Saima Batool, Zoya Batool, Hammad Ali, Amna Ilyas) for providing me with unfailing support and continuous encouragement throughout my years of study. Also not forgetting my family like friends (Ali Sheraz, Misbah Azeem, Salahuddin Zafar, Sidra Noor, M.Abukkar, Dr. Ruby Phul), for immense support through the process of researching and writing this thesis. This accomplishment would not have been possible without them. Thank you.
Contents
1 Introduction 1
1.1 Water Splitting . . . 1
1.1.1 Chromophores/photosensitizers . . . 2
1.2 Challenges In Developing Iron Chromophores . . . 9
1.3 Strategies In Developing Iron Chromophores . . . 13
1.4 Outline . . . 15
2 Experiments and Instrumentation 22 2.1 Chemicals and Reagents . . . 22
2.2 Synthesis of Chromophores . . . 23
2.2.1 Synthesis of Fe(bpy)2(CN)2.xH2O . . . 23
2.2.2 Synthesis of Fe(phen)2(CN)2.xH2O . . . 24
2.2.3 Synthesis of K4[Fe(bpy)(CN)4.xH2O] . . . 24
2.3 Synthesis of Semiconductor (Titania Nanowires) . . . 25
2.4 Synthesis of Powder Co-Fe Prussian Blue Analogues (PBAs) . . . 25
2.5 Fabrication of Photoanodes . . . 26
2.6 Instrumentation . . . 27
2.6.1 Ultraviolet-Visible Spectroscopy . . . 27
2.6.2 Fourier Transform Infrared Spectroscopy . . . 27
2.6.3 X-Ray Photoelectron Spectroscopy . . . 27
2.6.4 Scanning Electron Microscopy and Energy-Dispersive X-Ray Spectroscopy . . . 27
2.6.5 Photoelectrocatalytic Studies . . . 28
3 Results and Discussion 29 3.1 UV-Visible Spectroscopy (UV-Vis) . . . 29
3.2 Fourier Transform Infrared Spectroscopy (ATR-FTIR) . . . 32
3.3 X-Ray Photoelectron Spectroscopy (XPS) . . . 35
3.4 Scanning Electron Microscopy (SEM) . . . 38
3.5 Energy Dispersive X-Ray Analysis (EDX) . . . 38
3.6 Photoelectrochemical Measurements of [Co-Fe@TiO2/FTO] Pho-toanodes . . . 40
3.6.1 Linear Sweep Voltammetry (LSV) . . . 40
3.7 Post-Catalytic Characterization . . . 46
3.7.1 Linear Sweep Voltammetry (LSV) . . . 46
3.7.2 X-Ray Photoelectron Spectroscopy (XPS) . . . 48
3.7.3 Scanning Electron Microscopy (SEM) and Energy Disper-sive X-ray Analysis (EDX) . . . 50
3.7.4 Incident Photon to Current Efficiency (IPCE) . . . 52
3.7.5 Band Alignment Interpretation . . . 53
List of Figures
1.1 Generalized phenomena for electron transfer in water oxidation process. . . 3
1.2 Structure of [F e(btz)3]2+ complex having 528 ps 3M LCT lifetime. 4
1.3 Primogenic effect in Fe(II) and Ru(II) chromophores. . . 10
1.4 Comparison of Fe(II) and Ru(II) chromophores in terms of stability of excites states. . . 11
1.5 Tanabe Sugano Diagram for d6 configuration. . . . . 12
1.6 Effect of CN− ligand on MC energy levels. . . 14 1.7 Structures of Iron Chromophores (a) [FeB2C2], (b) [FeP2C2], (c)
[FeBC4], (d) [FePC4]. . . 15
1.8 Structure of typical Prussian blue, metal ions: red/yellow, N: blue, C: black, interstitial sites: purple. . . 16
1.9 Structure of Pentacyanoferrate-Coordinated Poly(4-vinylpyridine) PBA. . . 17
1.11 Photoanode Donor-Acceptor system, SC is Semiconductor, ligand
is either phenanthroline or bipyridine. . . 19
1.12 Chronology showing the studies on cyanoiron polypyridyl com-plexes over past decade. . . 21
2.1 Synthetic method for [FeB2C2]. . . 23
2.2 Synthetic method for [FeBC4]. . . 24
2.3 Synthesis of Titania nanowire arrays. . . 25
2.4 In situ formation of Prussian blue film over Titania surface. . . . 26
3.1 UV-Vis absorption profiles of (a) [FeB2C2], [FeBC4], (b) [FeP2C2], [FePC4] in a wavelength range 280nm-700nm, (c) MLCT bands of [FeB2C2], [FeBC4], (d) MLCT bands of [FeP2C2], [FePC4]. . . 30
3.2 UV-Vis absorption profiles (MLCT bands) of (a) [Co-FeB2C2], (b) [Co-FeP2C2], (c) [Co-FeBC4], (d) [Co-FePC4]. . . 31
3.3 (a) IR spectra of Iron Chromophores, (b) extended cyanide stretches of Iron Chromophores. . . 32
3.4 Cyanide stretches of Co-Fe PBAs in IR region (a) [FeB2C2Co-], (b) [Co-FeP2C2], (c) [Co-FeBC4], (d) [Co-FeBC4]. . . 34
3.5 N1s and Fe2p XPS spectra of of Fe-complexes and Co-Fe PBAs. . 36
3.6 Co2p XPS spectra of of Co-Fe PBAs. . . 37
3.7 SEM images of (a) [FeB2C2] (b) [FeP2C2] (c) [FeBC4] (d) [FePC4]. 38
3.9 EDX analysis of (a) [Co-FeB2C2] (b) [Co-FeP2C2] (c) [Co-FeBC4]
(d) [Co-FePC4]. . . 40
3.10 LSV curves of Bare-TiO2 (Red, Closed square=Light, Open
square=Dark), [Co-PB@TiO2] (Pink, Closed triangle=Light, Open
triangle=Dark), [Co-FeBC4@TiO2] (Wine, Closed circle=Light,
Open circle=Dark) and [Co-FeC4@TiO2] (magenta, Closed
cir-cle=Light, Open circle=Dark). . . 42
3.11 LSV curves of Bare-TiO2 (Red, Closed square=Light, Open
square=Dark), [Co-PB@TiO2] (Pink, Closed triangle=Light, Open
triangle=Dark), [Co-FeB2C2@TiO2] (Blue, Closed circle=Light,
Open circle=Dark) and [Co-FeP2C2@TiO2] (Brown, Closed
cir-cle=Light, Open circle=Dark). . . 43
3.12 Short-term chronoamperometry (300s, ν=50mV/s) (a) [Co-FeB2C2@TiO2] (blue) (b) [Co-FeP2C2@TiO2] (brown) (c)
[Co-FeBC4@TiO2] (wine) (d) [Co-FePC4@TiO2] (magenta). . . 45
3.13 Long-term chronoamperometry (2hr, ν=50 mV/s, V=1.22 volts versus RHE) (a) [Co-FeB2C2@TiO2] (blue), [Co-FeBC4@TiO2]
(wine) (b) [Co-FeP2C2@TiO2] (brown), [Co-FePC4@TiO2]
(ma-genta). . . 46
3.14 Post-catalytic LSV (0.2-2.0 V versus RHE, ν=50 mV/s), (a) [Co-FeBC4@TiO2], (b) [Co-FePC4@TiO2], Red=Before stability test,
Black=After stability test. . . 47
3.15 Post-catalytic LSV (0.2-2 V vs RHE, ν=50 mV/s), (a) [Co-FeB2C2@TiO2], (b) [Co-FeP2C2@TiO2], Red=Before stability test,
Black=After stability test. . . 48
3.16 Pristine and Postcatalytic XPS of [Co-FeBC4@TiO2], Red=Pristine,
3.17 Pristine and Postcatalytic XPS of [Co-FePC4@TiO2], Red=Pristine,
Black=Postcatalytic. . . 50
3.18 SEM images of (a) [Co-FeBC4] PBA pristine, (b) [Co-FeBC4] PBA
postcatalytic, (c) [Co-FePC4] PBA pristine, (d) [Co-FePC4] PBA
postcatalytic. . . 51
3.19 EDX analysis of (a) [Co-FeBC4@TiO2] postcatalytic, (b)
[Co-FePC4@TiO2] postcatalytic. . . 52
3.20 IPCE (%) of (a) [Co-FeB2C2@TiO2], [Co-FeP2C2@TiO2], (b)
[Co-FeBC4@TiO2], [Co-FePC4@TiO2]. . . 53
3.21 Band diagram for (a) [Co-FeBC4@TiO2], (b) [Co-FePC4@TiO2],
arrows show the movement of charges after illumination. . . 54
3.22 Band diagram for (a) [Co-FeB2C2@TiO2], (b) [Co-FeP2C2@TiO2],
List of Tables
1.1 Metal-to-ligand charge transfer Lifetimes of Iron-Chromophores Reported so far. . . 8
2.1 Proposed abbreviations for the chromophores. . . 23
3.1 UV-Vis absorption bands of Iron Chromophores. . . 29
3.2 Molar absorptivities of Iron chromophores in UV-Vis region. . . . 30
3.3 UV-Vis absorption profiles of Co-Fe PBAs. . . 32
3.4 Characteristic IR stretching and bending bands of iron chro-mophores, (s) is the frequency for stretching mode whereas (b) is the frequency for bending mode. . . 33
3.5 Comparison of cyanide stretches in CN (chromophores) and Fe-CN-Co (PBA). . . 35
3.6 Binding Energies of Fe2p and N1s of Iron Chromophores. . . 35
3.7 Binding energies of Co2p of Iron Chromophores. . . 37
3.8 Molecular formulas of Co-Fe PBAs (powder samples) calculated using EDX % atomic ratios. . . 39
3.9 Comparison of Current Densities obtained by linear sweep voltam-metry at Potential of 1.0 V vs RHE. . . 41
3.10 Difference in current densities (µA/cm2) of (a) [Co-FeB2C2@TiO2]
(blue) and [Co-FeBC4@TiO2] (wine) (b) [Co-FeP2C2@TiO2]
(brown) and [Co-FePC4@TiO2] (magenta) before and after 2hr
chronoamperometry. . . 45
3.11 Binding Energies of Co2p of pristine and postcatalytic electrodes. 49
3.12 Binding Energies of N1s of pristine and postcatalytic electrodes. . 49
3.13 Binding Energies of Fe2p of pristine and postcatalytic electrodes. 50
3.14 Molecular formulas of [Co-Fe/TiO2] (post-catalytic) calculated
Abbreviations
ν Scan rate µ Micro A Ampere V Volts eV Electron Volts ps Picosecond fs Femtosecond j Current density λ Wavelength∆◦ Octahedral splitting energy
h Hour
min Minutes
RT Room temperature
RHE Reference hydrogen electrode FTO Fluorine-doped Tin Oxide
HOMO Highest occupied molecular orbital LUMO Lowest unoccupied molecular orbital MLCT Metal-to-ligand charge transfer LMCT Ligand-to-metal charge transfer MC Metal centered
GS Ground state ES Excited state
IET Interfacial electron transfer RDF Radial distribution function
PB Prussian blue
PBA Prussian blue analogue WOC Water oxidation catalyst PS Photosensitizer SC Semiconductor NHC N-heterocyclic bpy 2,2’-bipyridine phen 1,10-phenanthroline btz 3,3-dimethyl-1,1-bis(p-tolyl)-4,4-bis(1,2,3-triazol-5-ylidene) tpy 2,2’;6’,2”-terpyridine
UV-Vis UV-Visible Spectroscopy
ATR-FTIR Attenuated Total Reflection-Fourier Transform Infrared Spectroscopy EDX Energy Dispersive X-Ray Spectroscopy
XPS X-Ray Photoelectron Spectroscopy LSV Linear Sweep Voltammetry
Chapter 1
Introduction
Fossil fuels have been considered as the utmost and vital energy source for many years. It is depleting to a great extent and contributes towards global warming we encounter in the present times. As a result, replacing it with a renewable and environment friendly source has been a debatable issue for the past few decades.
Hydrogen is found to be the clean and sustainable energy carrier against fossil fuels [1] [2]. It is captivated in water, biomass, hydrocarbons, alcohols, and other renewable sources i.e. wind energy, solar energy, hydro power, etc. [3] [4] [5]. It can be extracted from these sources. Amongst them, solar energy is the auspicious and favorable source. Sunlight driven water splitting, for acquiring chemical energy in the form of hydrogen fuel, has grabbed much attention in recent years [6] [7].
1.1
Water Splitting
Scientists are zealous towards investigating photoelectrochemical water splitting as the efficient and economical way of converting solar energy to chemical energy as hydrogen fuel [8] [9]. In this context, different strategies have been proposed
which include semiconductor particle systems, semiconductor liquid junction sys-tems, sensitized semiconductor syssys-tems, electrocatalysts attached to molecular donor-acceptor systems, photovoltaic cells etc. [8] [10].
From past few decades, photovoltaic cells are considered to be the leading devices for water splitting process [11]. Splitting water directly by means of photocatalysis, has offered many challenges; organizing molecular species into suitable sequence leading to charge separation for a longer period of time and choosing suitable catalysts for this reaction (this is the case particularly for four-electron oxidation reaction which is much slower) [10].
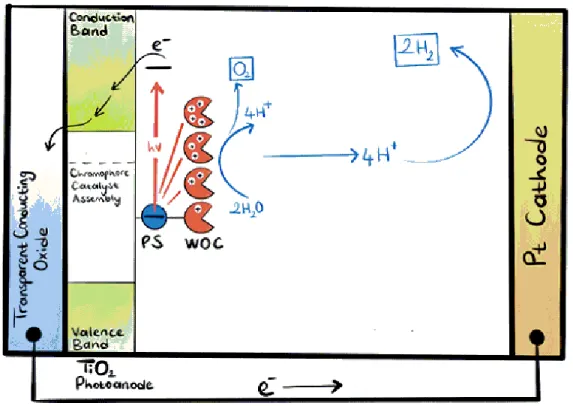
The major constituents of artificial photosynthetic systems are; wide band gap semiconductor, photosensitizers and photocatalysts. Many such systems have been devised. Overall, water splitting phenomena for such systems works on the principle that photosensitizer gets photoexcited by absorbing light, leaving holes in ground state, these holes are responsible for oxidizing water to oxygen through water oxidation catalyst as shown in Figure 1.1. The electrons in LUMO (lowest unoccupied molecular orbitals) of photosensitizer are transferred to conduction band of semiconductor and move to photocathode carrying out water reduction process [12] [13].
Owing to the fact that oxidation of water is more complicated task than re-duction so for now we are only interested in discussing this process. In water oxidation photoanodes, chromophores are the most crucial elements as they are responsible for sensitizing wide band gap semiconductors for promoting visible light driven water splitting efficiently [14] [15].
1.1.1
Chromophores/photosensitizers
The key requirements for ideal chromophores are as follows;
2. It should be abundant.
3. It should be non-toxic and stable.
4. The LUMO level of the chromophore ought to have more negative potential than the conduction band edge of the semiconductor and its HOMO (high-est occupied molecular orbital) level should be higher than the LUMO of water oxidation catalyst in order to facilitate the water oxidation reaction efficiently [13].
Based on coordination compounds, only ruthenium complexes have been in-vestigated as the incomparable chromophores so far [16] [17] [18] [13].
Figure 1.1: Generalized phenomena for electron transfer in water oxidation pro-cess.
[19]
since they have metal to ligand charge transfer (MLCT) excited states with longer life times and their reduction potentials can be tuned easily. On the other hand, they present certain disadvantages such as being less abundant, highly expensive and toxic [20].
Many iron based chromophores have also been investigated and reported in literature since it is abundant element and it is in the same group as ruthenium. Among them, most of the studies have been performed on N-heterocyclic iron complexes. The simplest [F e(bpy)3]2+ complex has a lifetime of 0.12 ps, not
long enough to carry out photoredox water splitting [21].20 ps MLCT lifetime is achieved with [F e(bpy)(CN )4]2−complex as photosensitizer without WOC (water
oxidation catalyst) [22]. Many computational studies were carried out in past on cyanoiron polypyridine complexes by Jakubikova et al. [23] [20]. They have also investigated the effect of linker groups attached to the polypyridyl rings in such systems on the interfacial electron transfer rates (IET). They used five different linker groups attached to polypyridine rings and found that carboxylic acid and phosphonic acid linkers increased the efficiency of interfacial electron transfer (IET) [24]. The rest of the studies are based on cyclometallated and NHC-based iron systems [25] [26] [27] . Among them, the highest MLCT lifetime achieved so far is 528 ps for the complex mentioned in Figure 1.2 [28].
Figure 1.2: Structure of [F e(btz)3]2+ complex having 528 ps 3M LCT lifetime.
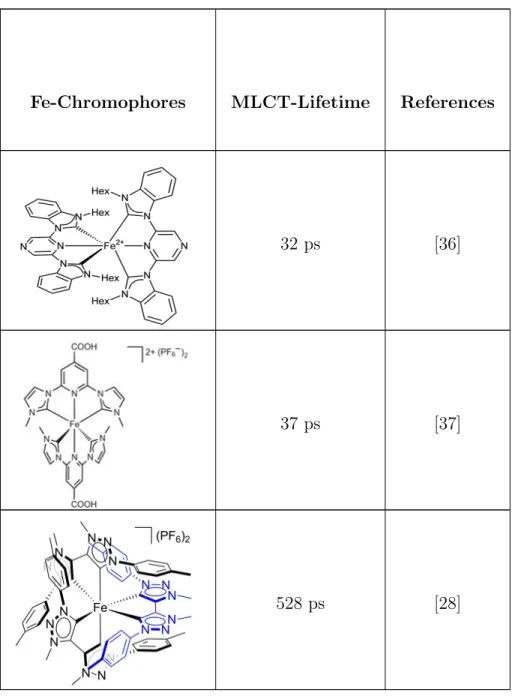
In Table 1.1, MLCT (metal-to-ligand charge transfer) lifetimes of the NHC-Fe complexes reported to date have been listed. These NHC-based iron complexes require tedious and complex organic synthesis which makes them less favourable to be used as potential photosensitizers in devices.
Fe-Chromophores MLCT-Lifetime References
0.12 ps [21]
0.15 ps [21]
Fe-Chromophores MLCT-Lifetime References
9 ps [27]
9 ps [29]
13 ps [30]
Fe-Chromophores MLCT-Lifetime References
16 ps [32]
[Fe(dctpy)2](BF4)2] 16 ps [33]
19 ps [34]
Fe-Chromophores MLCT-Lifetime References
32 ps [36]
37 ps [37]
528 ps [28]
Table 1.1: Metal-to-ligand charge transfer Lifetimes of Iron-Chromophores Re-ported so far.
Table 1.1 explicitly demonstrated the attempts made by various research groups for the vital improvements in MLCT lifetimes exhibited by NHC-based iron complexes, where the lifetime increases down the table. [Fe(bpy)3]2+ and
[Fe(tpy)2]2+ are not suitable for photochemical applications. So, the substitution
of [Fe(tpy)2]2+ by N-tert-butyl and N-methyl groups increased the ligand field
strength which led to significant enhancement of MLCT lifetime. Since, NHC-based complexes have poor π-accepting ability so heteroleptic iron complexes were being synthesized to stabilize MLCT states. The addition of caboxyl groups to these heteroleptic ligands further added to increase the MLCT lifetime. The numbers of NHC and pyridyl ligands and their arrangement around the metal center emerged many iron-chromophores with improved MLCT lifetime. Such an iron chromophore ([Fe(btz)3]2+, low spin) designed by Warnmark et al., owing to
it’s remarkable ligand field strength presented highest MLCT lifetime till date.
1.2
Challenges In Developing Iron Chromophores
Although Fe is highly abundant, Fe(II)-L6 complexes have low splitting energy
between eg and t2g compared to their Ru(II) counterparts. This results from
weaker interaction of iron with the surrounding ligands leading to low octahedral splitting. This is best explained by primogenic effect, which states that 3s and 3p orbitals of Fe(II) overlaps with its 3d orbitals provoking weaker interaction with the ligand orbitals (Figure 1.3). In contrary, 4d orbitals of Ru(II) can interact strongly with the ligand orbitals since they have lower overlap with 4s and 4d orbitals.
Figure 1.3: Primogenic effect in Fe(II) and Ru(II) chromophores. [38]
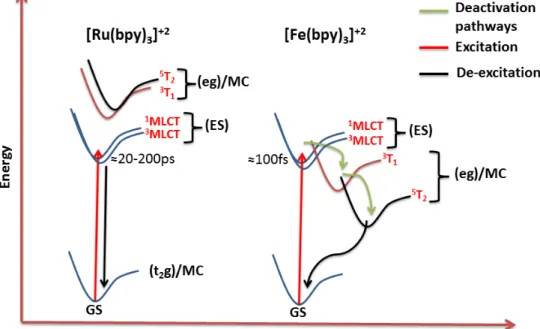
Thus, it has low lying metal centered (eg) states compared to metal-to-ligand charge transfer state (MLCT) as shown in Figure 1.4. As a result, after excitation
3M LCT state is deactivated by this metal centered states in the order of < 100f s
Figure 1.4: Comparison of Fe(II) and Ru(II) chromophores in terms of stability of excites states.
Tanabe Sugano diagram (Figure 1.5) can summarize the repercussions of the primogenic effect as it is related to energy conversion process [38]. The line of in-tersection separates weak field and high field region showing that splitting energy (∆o) is equal to spin pairing energy (P ). The ligand field states (term symbols)
derived from Russel-Saunder’s coupling scheme for d6 electron configuration are oriented along energy axis. This diagram shows that both Fe(II) and Ru(II) chro-mophores lie on the high field region and therefore are low spin compounds [38]. However, due to weaker interaction with the ligand orbital MC states (3T
1,5T2)
of Fe(II) lie lower in energy than MLCT states (represented by red line in Figure 1.5). This is not the case for Ru(II) chromophores which lead to longer MLCT lifetimes. Many research groups have made attempts to overcome this challenge in case of Fe(II) chromophores [20] [23] [39].
Figure 1.5: Tanabe Sugano Diagram for d6 configuration.
1.3
Strategies In Developing Iron Chromophores
Yizhu Liu et al. have described that by attaching electron-donating group to the metal, the eg (metal centered, MC) state can be destabilized. Hence, this will sta-bilize MLCT state compared to metal centered states, making it more accessible energetically. They have used N-heterocyclic carbene complexes for this pur-pose [21]. The destabilization of MC states has been accomplished so far by the use of cyclometalated Fe(II) complexes [25], N-heterocyclic complexes [40] [21], heteroleptic pyridyl-carbene iron complexes [41], and homoleptic NHC based iron complexes [42]. A review presented by Oliver S. Wenger outlined key challenges and possible strategies employed so far to amplify the photochemical and pho-tophysical properties belong to iron complexes [43]. Some of the strategies men-tioned include the use of high symmetry providing ligands (dcpp [44], ddpp [45]), the use of strong σ-donating ligands to destabilize the eg of metal center (NHC-ligands), connecting σ and π-donating ligands with metal center to stabilize MLCT states (cyclometalated ligands [25] [46] [47]), oxidizing Fe2+ to Fe3+in
or-der to utilize LMCT (spin allowed) state for sensitization instead of MLCT which is spin forbidden state [48], the use of isoelectronic Cr(0) and Mo(0) complexes for sensitization through MLCT states [49] [50]. Unfortunately, these complexes are difficult to synthesize and are less stable.
In our case, we aimed to use cyano Fe(II) polypyridine (bipyridine and phenan-throline) complexes for the following reasons:
1. They are stable as well as much easier to synthesize.
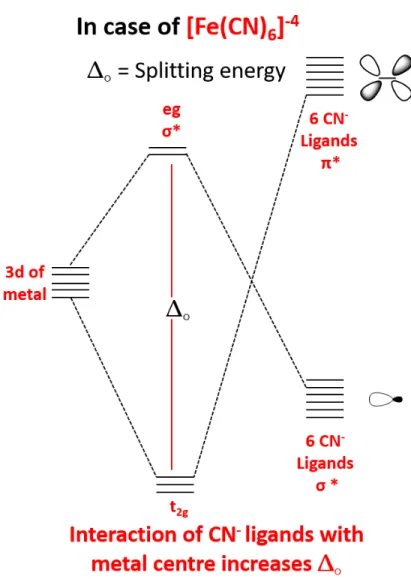
2. In our chromophores, cyanide ligand, which is a strong σ-donor, is attached to iron center. The σ-donating ability of CN− ligand will stabilize the eg of metal and its π-accepting ability will raise t2g higher in energy (Figure
1.6). Therefore, this causes increase in energy difference rendering this com-plex more favorable to be used as chromophore by creating more stabilized
3. Additional factor that counts is to increase rate of interfacial electron trans-fer (IET) from MLCT state to conduction band (CB) of semiconductor. This can be accomplished by attaching suitable linker groups [39] [20] [23] to the ligand (polypyridine) which contributes to two major advantages;
• connecting electron withdrawing group will make 1,3M LCT states
more stable energetically.
• much stronger implantation of chromophore onto semiconductor; both of these factor contribute to enhance IET rate [42].
1.4
Outline
In this thesis, cyanoiron polypyridyl complexes have been synthesized, success-fully characterized and tested as chromophores for water splitting application using photoelectrochemical measurements. This study has been done in two parts.
In the first part, Iron chromophores with different number of cyanide ligands as well as polypyridyl rings have been synthesized. The structures of the syn-thesized chromophores are shown in Figure 1.7. The charge transfer properties and absorption profiles have already been reported in literature which illustrates their potential use as photosensitizers [51] [52] [53] [54].
Figure 1.7: Structures of Iron Chromophores (a) [FeB2C2], (b) [FeP2C2], (c)
However, all these chromophores are not studied or used for photoelectrochem-ical water splitting before.
Hence in the second part, a novel PS-WOC dyad has been designed and employed for heterogeneous water oxidation photocatalysis. Cobalt-hexacyanometalates could serve as promising catalysts for water oxidation owing to their high catalytic performance as well as stability at pH=7 [55] [56]. Hence, it is linked to Fe-sensitizer emerging non-stoichiometric Prussian blue (PB) network on titania surface for water oxidation.
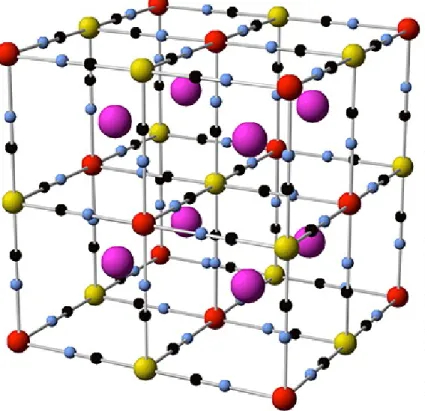
In a typical Prussian blue structure, hexacyanoiron is connected to cobalt through cyanide ligands and is the prototype of original Prussian blue having combination of metal ions with multiple oxidation states (Figure 1.8).
Figure 1.8: Structure of typical Prussian blue, metal ions: red/yellow, N: blue, C: black, interstitial sites: purple.
water oxidation cobalt sites because of its connection with six cyanide ligands in the structure [57]. Previously reported by our group that reducing the crys-tallinity of PBA structure by using pentacyanoiron precursor with nitrogen donors (poly(4-vinylpyridine) polymer) can increase the number of cobalt sites (Figure 1.9) [58].
Figure 1.9: Structure of Pentacyanoferrate-Coordinated Poly(4-vinylpyridine) PBA.
These cobalt sites act as a relay for fastest electron transfer to semiconductor through cyanide bridging ligand. Figure 1.10 depicts that these cobalt moieties also serve as σ-donating groups for chromophores [59] [60].
Figure 1.10: Fe-CN-Co coordination as a fastest electron relay.
So we moved one step further to use this strategy and make Prussian blue ana-logues by reacting our iron chromophores with cobalt, which is a water oxidation catalyst as well as electron donor for iron chromophores. These Prussian blue systems are convenient to synthesize and are highly efficient for water oxidation process [61] [62] [56] [63].
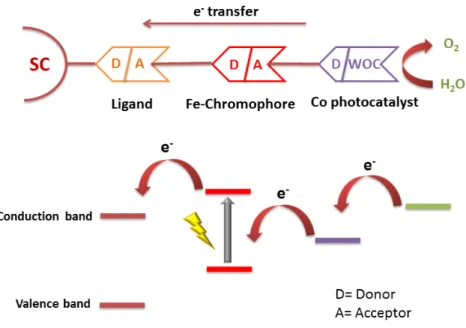
Our photoanode assemblies act as donor-acceptor systems in which each com-ponent acts as a donor or acceptor with respect to other upon illumination. Figure 1.11 shows that the process of water oxidation is initiated with the excitation of chromophore leading to MLCT (metal-to-ligand charge transfer) transition. The electron from the LUMO (lowest unoccupied molecular orbital) of chromophore is transferred to the conduction band of titania. The hole in HOMO (highest occupied molecular orbital) of Fe(II) is taken by the cobalt catalyst, which in turn oxidizes water to oxygen.
Each component in the assembly has multiple functions:
1. Co: Water oxidation catalyst (WOC);
• It connects all the molecular structure together in the form of random non-stoichiometric Prussian-blue (PB) network.
• It increases the sigma donating ability of CN− by donating e−.
2. Iron complex: sensitizes the semiconductor (SC). 3. CN−:
• It is responsible for robust coordination.
• It provides e−transfer connection between catalyst and photosensitizer
(PS).
• It increases ∆◦ (octahedral splitting energy).
4. TiO2: is a semiconductor, which transfers the electrons to photocathode.
Figure 1.11: Photoanode Donor-Acceptor system, SC is Semiconductor, ligand is either phenanthroline or bipyridine.
Till now, iron chromophores with complex organic ligands have been designed. So it is difficult to connect them to a molecular catalyst in order to complete the
next step for water oxidation. However, our approach here is to use simpler iron complexes as photosensitizer and to associate them with cobalt catalyst overall generating Prussian blue analogue for water oxidation. Unlike other studies, this study utilised Prussian blue analogue which was formed in situ and it is the ideal condition for DSPECs.
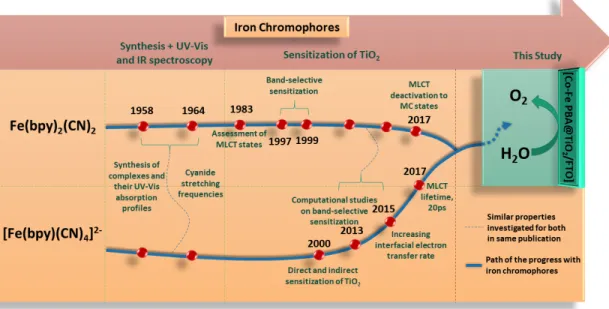
Therefore, photoelectrochemical measurements demonstrated that these iron complexes can be utilized as photosensitizers. Furthermore, the effect of cobalt catalyst additionally connected to these chromophores has been inquired by var-ious characterization techniques. Till date, this is the only study using cyanoiron polypyridyl complexes coupled with cobalt catalyst (PBA) for water oxidation catalysis. This briefly demonstrated in the chronology as well (Figure 1.12) that in 60s, cyano iron polypyridyl complexes were synthesized and characterized by UV-Vis absorption spectroscopy and Infrafred spectroscopy. In early 80s, these complexes were used for the assessment of their MLCT (metal-to-ligand charge transfer) states. These complexes grabbed much attention at the end of 20th century, when used for the first time to sensitize titania by selectively involving only one MLCT band. From 2000 to 2017, these iron complexes were broadly investigated by experimental and computational chemists to evaluate the MLCT lifetimes as well as to mitigate the deactivation pathways into MC (metal cen-tered) states.
Figure 1.12: Chronology showing the studies on cyanoiron polypyridyl complexes over past decade.
Chapter 2
Experiments and
Instrumentation
2.1
Chemicals and Reagents
Iron(II) ammonium sulfate hexahydrate F e(SO4)2(N H4)2.6H2O (Carlo Ebra),
2,2’-bipyridine (Acros Organics, 99%), 1,10-phenanthroline (Sigma Aldrich. 99%), Potassium Cyanide KCN (Merck, 65.12 gmol−1) were used. For hy-drothermal synthesis of Titania (T iO2) nanowires on FTO coated glass (7 Ωsq−1,
Solaronix), Titanium (IV) butoxide (T i(OBu)4, 97%, Sigma–Aldrich),
hydrochlo-ric acid (HCl, 36%, Sigma–Aldhydrochlo-rich), Cobalt Nitrate (Co(N O3)2, ), Cobalt
Chlo-ride (CoCl2, ) and HPLC-grade water (H2O) were used. Methanol and ethanol
solvents were used as such without further purification. Millipore deionized water (resistivity: 18 mΩcm) was used throughout the experimental procedures.
2.2
Synthesis of Chromophores
Throughout the thesis, abbreviations will be used for the synthesized chro-mophores as mentioned in the table 2.1;
Complexes Abbreviations Fe(bpy)2(CN)2.xH2O [FeB2C2]
Fe(phen)2(CN)2.xH2O [FeP2C2]
K2[Fe(bpy)(CN)4.xH2O] [FeBC4]
K2[Fe(phen)(CN)4.xH2O] [FePC4]
Table 2.1: Proposed abbreviations for the chromophores.
2.2.1
Synthesis of Fe(bpy)
2(CN)
2.xH
2O
This complex was synthesized according to literature by a modified procedure [64]. Solution of 2,2’-bipyridine in 10 ml methanol was added slowly and dropwise to 1:3 methanol+water solution of F e(N H4)2(SO4)2.6H2O at room temperature.
The mixture was left for overnight stirring. This solution was filtered and solu-tion of KCN (in 5 ml methanol) was added dropwise to the filtrate. The mixture was again kept overnight for stirring. Methanol was removed from the reaction mixture by rotary evaporator and complex was precipitated leaving it in refrig-erator for 24 hours (Figure 2.1). Violet colored precipitates were collected by vacuum suction and washed with small amount of methanol and dried. A yield of about 72% was obtained for the synthesized complex.
2.2.2
Synthesis of Fe(phen)
2(CN)
2.xH
2O
Similar procedure was followed for its synthesis as above. Dark red colored pre-cipitates were obtained at the end of experiment (yield= 73%) [64].
2.2.3
Synthesis of K
4[Fe(bpy)(CN)
4.xH
2O]
It was synthesized with slight modification in a method already reported in lit-erature [64]. In a round bottom flask, 100 mg FeB2C2 (as synthesized above)
and 29 mg KCN in 100ml of water were added. This mixture was refluxed with constant stirring at 90◦C for a period of 5 days. Resulting mixture was reduced to half by rotary evaporator and kept in refrigerator in order to precipitate the desired product with a yield of approximately 70% (Figure 2.2). Later, the final product was filtered and its formation was confirmed by UV-Vis spectroscopy.
Figure 2.2: Synthetic method for [FeBC4].
2.2.4
Synthesis of K
4[Fe(phen)(CN)
4.xH
2O]
It was synthesized following same procedure as above. At the end, the light orange colored product was collected and dried [64]. The product yield obtained was around 75%.
2.3
Synthesis of Semiconductor (Titania Nanowires)
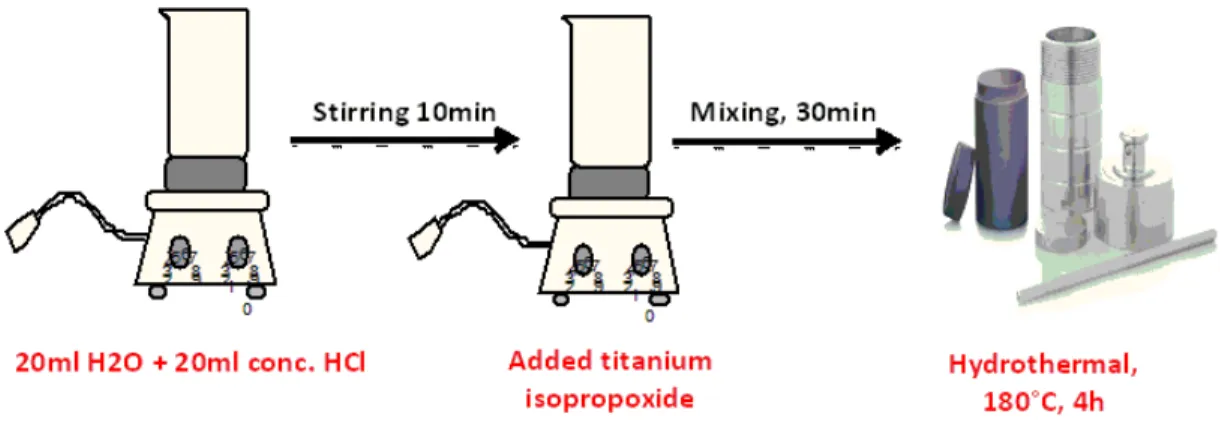
Titania nanowires were grown on thoroughly cleaned FTO glass by hydrothermal process following previously reported procedures [65]. In short, Hydrochloric acid (20 ml) was added in 20 ml of distilled water and allowed to mix for 10min. Afterwards, 1 ml of titanium butoxide was added to the previous solution and kept stirring for 30min. The mixture was poured into 45 ml stainless steel autoclave and FTO is placed at an angle of 45◦ against the autoclave with its conducting side facing up. It was left in the oven for heating at 180◦C for 4h (Figure 2.3). Titania nanowires were grown successfully and rinsed with ethanol solvent. It was then annealed in air at 450◦C for about 2 hour and cooled to 150◦C [66].
Figure 2.3: Synthesis of Titania nanowire arrays.
2.4
Synthesis of Powder Co-Fe Prussian Blue
Analogues (PBAs)
For the synthesis of powder samples of Co-Fe PBAs, both the iron chromophore and cobalt catalyst were dissolved in water. For [Co-FeB2C2] and [Co-FeP2C2]
synthesis, cobalt chloride (CoCl2) was used as cobalt source. Cobalt nitrate
(Co(N O3)2) was used as cobalt source for [Co-FeBC4] and [Co-FePC4] synthesis.
3 days in case of [Co-FeB2C2] and [Co-FeP2C2]. After 3 days, the mixture was
reduced to half in rotavap and kept in the fridge for 1 day to get precipitates of PBA. In contrast, for [Co-FeBC4] and [Co-FePC4] synthesis mixing of
chro-mophore and cobalt solution led to immediate precipitation of PBA. At the end, the PBA precipitates were separated from the reaction mixture by the process of centrifugation. The PBA products were dried and characterized. The yield obtained for Co-Fe PBAs was approximately 40%.
2.5
Fabrication of Photoanodes
Titania nanowires were coated with chromophores and catalyst. Chromophores of particular concentration (e.g. 1.33 mM of dye solution in methanol) was prepared and titania coated FTO was immersed into this dye solution for 25min and washed with methanol. After that, it was left in catalyst solution (0.2 M of cobalt nitrate solution in ethanol) for 25min followed by washing with water. This process of dip coating was repeated about four to five times for better dye adsorption. Finally, the Prussian blue film was formed in situ on the titania surface as shown in Figure 2.4. Same procedure was followed for the formation of photoanodes with all the four chromophores.
2.6
Instrumentation
2.6.1
Ultraviolet-Visible Spectroscopy
The absorption spectra for chromophores were recorded using Carry 5000 UV-Vis-NIR spectrophotometer in a wavelength range of 200-800 nm keeping scan rate 600 nm/min.
2.6.2
Fourier Transform Infrared Spectroscopy
Using Bruker Alpha Platinum-ATR Spectrometer FTIR spectra were recorded in transmission mode within the wavenumber range of 400-4000 cm−1 for 64 scans.
2.6.3
X-Ray Photoelectron Spectroscopy
XPS analysis was carried out using Thermo Scientific K-Alpha X-Ray Photoelec-tron Spectrometer having an AlKα microfocused monochromator source working at spot size of 400 mm and hγ=14.866 eV accompanied by a flood gun for charge neutralization, 200 eV for survey scan and 10-30 eV for individual scans. All the peaks were shifted with reference to C1s positioned at 284.8 eV.
2.6.4
Scanning Electron Microscopy and Energy-Dispersive
X-Ray Spectroscopy
SEM and EDX measurements were recorded using FEI-Quanta 200 FEG ESEM. SEM images were obtained at a beam voltage of 5 kV and Spot size of 3.0. Whereas, for EDX analysis 5.0 spot size and 15 kV beam voltage was maintained.
2.6.5
Photoelectrocatalytic Studies
Photoelectrocatalytic measurements were performed using Gamry Instruments Interface 1000 Potentiostat/Galvanostat at ambient temperature. A conventional three electrode setup consisting of Ag/AgCl (3.5 M KCl) reference electrode, Pt-wire as counter electrode and our photoanodes (Prussian blue coated TiO2/FtO)
as working electrodes. All the measurements were recorded at neutral pH (7) using phosphate buffer (0.1 M using KH2PO4 and K2HPO4 salts in deionized
water). Similar to previous studies, all the electrodes were dipped into the elec-trolyte (buffer solution) and purged with N2 for 10 minutes to get rid of dissolved
O2. Electrolyte was changed after each photoanode measurement in order to get
correct data. All the measured potential values were referenced with respect to RHE (reference hydrogen electrode) and corrected based on the surface area of working electrode.
Chapter 3
Results and Discussion
3.1
UV-Visible Spectroscopy (UV-Vis)
In the UV-Vis spectra, [FeB2C2] and [FeBC4] complexes exhibit two
metal-to-ligand charge transfer bands at 521 nm with band edge at 481 nm, 351 nm and 486 nm, 347 nm respectively. Also, ligand based π − π∗ transition were demonstrated at 297 nm and 295 nm for [FeB2C2] and [FeBC4] respectively (Figure 3.1a).
Complexes π − π∗ (nm) MLCT (nm) [FeB2C2] 297 (521,481), 351
[FeP2C2] 267 (512,451)
[FeBC4] 295 486, 347
[FePC4] 265 465
Table 3.1: UV-Vis absorption bands of Iron Chromophores.
Similarly, MLCT bands are observed at 512 nm with shoulder at 451 nm and 465 nm as well as ligand based bands at 267 nm and 265 nm for [FeP2C2]
and [FePC4] complexes respectively (Figure 3.1b). The more number of cyanide
ligands in [FeBC4] and [FePC4] stabilize the t2g of iron center, exhibiting a blue
shift. Overall, [FeB2C2] and [FeP2C2] complexes exhibit slightly higher molar
absorptivities calculated using bands at around 500 nm in UV-Vis region than [FeBC4] and [FePC4], as shown in Table 3.2. The UV-Vis profiles of all these four
chromophores are in accordance with the literature [64].
Figure 3.1: UV-Vis absorption profiles of (a) [FeB2C2], [FeBC4], (b) [FeP2C2],
[FePC4] in a wavelength range 280nm-700nm, (c) MLCT bands of [FeB2C2],
[FeBC4], (d) MLCT bands of [FeP2C2], [FePC4].
Complexes Molar absorptivity (L mol−1cm−1) [FeB2C2] 9.969×10⁴
[FeP2C2] 9.751×10⁴
[FeBC4] 7.873×10⁴
[FePC4] 7.403×10⁴
Table 3.2: Molar absorptivities of Iron chromophores in UV-Vis region.
The UV-Vis absorption profiles for [Co-FeBC4], [Co-FePC4], [Co-FeB2C2] and
[Co-FeP2C2] are also elucidated in Figure 3.2. It shows a red shift in all cases
PBAs. The profiles of all PBAs are almost similar to the absorption profiles of all chromophores. This can be attributed to the stabilization of MLCT states, or destabilization of ground state or both as a result of coordination of cobalt sites. In case of PBAs having [FeBC4] and [FePC4] chromophores, the MLCT
bands are much broader which correspond to the formation of extended Prussian blue network. Nevertheless, owing to the neutrality of [FeB2C2] and [FeP2C2],
such chromophores based PBAs form small nuclearity clusters as shown by the non-broadening and slight red shift in the UV-Vis region. The exact wavelength values are presented in Table 3.3.
Figure 3.2: UV-Vis absorption profiles (MLCT bands) of (a) [Co-FeB2C2], (b)
Complexes MLCT (nm) [Co-FeB2C2] (527,484), 355
[Co-FeP2C2] (524,462)
[Co-FeBC4] 495, 360
[Co-FePC4] 493
Table 3.3: UV-Vis absorption profiles of Co-Fe PBAs.
3.2
Fourier Transform Infrared Spectroscopy
(ATR-FTIR)
In Infrared region, stretches between 2000-2200 cm−1 belong to cyanide (CN−1) ligand which attributes to successful attachment of cyanide ligands to iron precur-sor. The stretches between 500-1600 cm−1 demonstrate bipyridine and phenan-throline ligands (Figure 3.3). The characteristic bands are shown in Table 3.4. The four bands in case of [FeBC4] are attributed to symmetrical and
asymmet-rical stretching modes of cis and trans cyanide ligands. The forth band is absent in [FePC4], which might be due to poor resolution of the instrument. Two CN
stretches in [FeP2C2] and [FeB2C2are attributed to coupling of stretching motions
to symmetrical and asymmetrical modes. This confirms the cis-conformation of [FeP2C2] and [FeB2C2 complexes [67].
Figure 3.3: (a) IR spectra of Iron Chromophores, (b) extended cyanide stretches of Iron Chromophores.
Complexes CN−1 (cm−1) H2O (cm−1) C-H (cm−1) C=C (cm−1)
[FeB2C2] 2066, 2074 1603(b), 3357(s) 767(b), 3077(s) 1470
[FeP2C2] 2064,2078 1599(b), 3351(s) 781(b), 3048(s) 1427
[FeBC4] 2034, 2044, 2057, 2081 1566(b), 3340(s) 766(b), 3073(s) 1470
[FePC4] 2041, 2051, 2084 1572(b), 3338(s) 763(b), 3047(s) 1419
Table 3.4: Characteristic IR stretching and bending bands of iron chromophores, (s) is the frequency for stretching mode whereas (b) is the frequency for bending mode.
These iron complexes were also treated with Co(NO3)2 to form Prussian blue
analogue and IR analysis was performed on them to see the effect of Co-catalyst on the CN stretch illustrated by Figure 3.4. The CN stretch shifted to higher wavenumber once connected to Co-catalyst given in Table 3.5. This result is comparable to ruthenium-P4VP-CoFe PBA already reported in literature by our group, where a shift to higher cm−1for CN stretch was observed due to Fe-CN-Co mode of coordination [68]. In case of [FeB2C2] and [FeP2C2], Fe3+and Co3+bands
appear at higher wavenumbers but are very weak to be detectable. Similar trend was observed for [FeBC4], and [FePC4] complexes [67]. In contrast, a smaller
band at higher wavenumbers (Table 3.5) observed in Co:Fe PBAs suggest the presence of partially oxidized Fe3+ sites and Co3+ [68].
Figure 3.4: Cyanide stretches of Co-Fe PBAs in IR region (a) [FeB2C2Co-], (b)
[Co-FeP2C2], (c) [Co-FeBC4], (d) [Co-FeBC4].
This depicts that cobalt acts as a donor group toward cyanide and contribute to increase its strength as the addition of Co2+ makes the structure even more
electron deficient, and therefore it causes an increase in electron donation from σ∗ of cyanide and shifts to higher frequency.
A broader cyanide stretch compared to iron precursor is observed due to non-stoichiometric attachment of Co2+ ions to iron chromophore as well as oxidation of Fe2+ to Fe3+ upto a certain extent [68].
Complexes Fe-CN (cm−1) Fe(2+,3+)-CN-Co (cm−1) [FeB2C2] 2066, 2074 2099, 2107
[FeP2C2] 2064, 2078 2109, 2119
[FeBC4] 2034, 2044, 2057, 2081 2064, 2116
[FePC4] 2041, 2051, 2084 2086, 2123
Table 3.5: Comparison of cyanide stretches in Fe-CN (chromophores) and Fe-CN-Co (PBA).
3.3
X-Ray Photoelectron Spectroscopy (XPS)
In order to confirm the formation of chromophores XPS spectra were recorded. In Figure 3.5, 2p3/2 and 2p1/2 of Fe2p exhibit two main peaks at around 708 eV
and 720 eV for all the iron complexes [59]. These Fe2p peaks are broad which can be attributed to partial oxidation of Fe2+ to Fe3+ species (Table 3.6). This
is commonly known phenomena in pentacyanoferrate complexes and is in good agreement with IR results showing shoulder band for Fe in 3+ oxidation state [59]. In addition to that, for N1s spectra of all iron complexes, two peaks appeared at around 399 eV and 397 eV. The N1s peak at higher binding energy is due to CN of bipyridine and phenanthroline ligands, and the one at lower binding energy is assigned to CN ligands linked to iron center (Figure 3.5). A slightly higher shift in wavenumber for Co-Fe PBAs is always observed due to association of cobalt with cyanide ligands [59] [68]. Broadening of the features in Co-Fe PBAs indicate the existence of Fe-CN-Co type of coordination mode (Table 3.6).
Complexes Fe2+(2p 1/2, 2p3/2) (eV) N1s (eV) [FeB2C2] 720.49, 707.79 397.08, 399.58 [Co-FeB2C2] 720.68, 708.08 397.68, 399.58 [FeP2C2] 720.78, 708.08 396.58, 399.28 [Co-FeP2C2] 721.28, 708.48 397.22, 399.28 [FeBC4] 720.78, 708.18 397.18, 399.33 [Co-FeBC4] 720.98, 708.28 397.68, 399.58 [FePC4] 720.78, 708.08 397.18, 399.28 [Co-FePC4] 721.08, 708.28 397.02, 399.48
Table 3.6: Binding Energies of Fe2p and N1s of Iron Chromophores.
eV and ≈797 eV correspond to 2p1/2 and 2p3/2 of Co2+ for all Co-Fe PBAs .
Additional doublet is observed at moderately higher binding energies attributed to Co3+ with satellite bands at around ≈3 eV higher in eV scale (Table 3.7) [56]
[58] [69] [60].
Figure 3.5: N1s and Fe2p XPS spectra of of Fe-complexes and Co-Fe PBAs.
The novelty of this study emerge when cobalt is connected to iron chro-mophores already synthesized in 1:1 ratio producing Prussian blue analogues (PBAs). To the best of our knowledge, no such study has been reported in lit-erature so far for water splitting application. Comparison of binding energies for Fe2p and N1s of just the chromophores and Co-Fe PBAs demonstrated the effect of cobalt.
Figure 3.6: Co2p XPS spectra of of Co-Fe PBAs. Complexes Co2+(2p3/2, 2p1/2) (eV) [Co-FeB2C2] 796.58, 780.68 [Co-FeP2C2] 796.68, 780.78 [Co-FeBC4] 797.18, 781.88 [Co-FePC4] 797.48, 781.98
3.4
Scanning Electron Microscopy (SEM)
In Figure 3.7, SEM images portray unique morphology of all the chromophores.
Figure 3.7: SEM images of (a) [FeB2C2] (b) [FeP2C2] (c) [FeBC4] (d) [FePC4].
3.5
Energy Dispersive X-Ray Analysis (EDX)
The formation of iron chromophores was further confirmed by EDX analysis. It is clearly shown in Figure 3.8 that in all the chromophores C, N and Fe elements are present. In addition, potassium (K) peaks appeared in case of tetracyano bpy/phen derivatives. Also, peaks corresponding to Au and Pd are observed as the samples were coated with Au/Pd to make the surface conductive (Figure 3.8).
Figure 3.8: EDX analysis of (a) [FeB2C2] (b) [FeP2C2] (c) [FeBC4] (d) [FePC4].
The molecular formulas for Co-Fe PBAs were calculated using EDX data as follows (Table 3.8);
Complexes Molecular Formulas
[Co-FeB2C2] Co2.47[(bpy)2Fe(CN)2]3.22.(Cl)4.94.xH2O
[Co-FeP2C2] Co3.03[(phen)2Fe(CN)2]3.61.(Cl)6.06.xH2O
[Co-FeBC4] Na0.96Co5.16[(bpy)Fe(CN)4]5.64.xH2O
[Co-FePC4] Co5.72[(phen)Fe(CN)4]5.42.(NO3)0.6.xH2O
Table 3.8: Molecular formulas of Co-Fe PBAs (powder samples) calculated using EDX % atomic ratios.
Figure 3.9: EDX analysis of (a) [Co-FeB2C2] (b) [Co-FeP2C2] (c) [Co-FeBC4] (d)
[Co-FePC4].
3.6
Photoelectrochemical Measurements of
[Co-Fe@TiO
2/FTO] Photoanodes
3.6.1
Linear Sweep Voltammetry (LSV)
LSV results showed that [Co-FeB2C2@TiO2] and [Co-FeP2C2@TiO2] have lower
current densities compare to their tetracyano derivatives ([Co-FeBC4@TiO2] and
[Co-FePC4@TiO2]). In order to evaluate the efficiency of iron chromophores, LSV
3.6 illustrates the LSV curves of all these electrodes at potential 0.2 V vs RHE (1.23 V) and scan rate of 50 mV/s maintaining neutral pH. The exact Current densities produced by these electrodes at potential= 1.6 V are shown in the Table 3.9.
Complexes Current density µA/cm2
[Bare-TiO2] 25 [Co-PB@TiO2] 31 [Co-FeB2C2@TiO2] 45 [Co-FeP2C2@TiO2] 48 [Co-FeBC4@TiO2] 57 [Co-FePC4@TiO2] 61
Table 3.9: Comparison of Current Densities obtained by linear sweep voltamme-try at Potential of 1.0 V vs RHE.
It is observed in Figure 3.10 that in dark [Co-PB@TiO2] performed most
ef-ficiently however in light [Co-FeBC4@TiO2] and [Co-FeC4@TiO2] are the most
efficient one with current density greater than 70 µA/cm2.
In contrary to this, [Co-FeB2C2@TiO2] and [Co-FeP2C2@TiO2] lie in
be-tween, efficient than [Co-PB@TiO2] but poorer than [Co-FeBC4@TiO2] and
[Co-FeC4@TiO2] (Figure 3.11). Hence, we concluded that increasing the number of
cyanide ligands increases the current density. At higher potentials (around 1.5 V) the current increases sharply due to the water oxidation by cobalt sites.
Figure 3.10: LSV curves of Bare-TiO2 (Red, Closed square=Light, Open
square=Dark), [Co-PB@TiO2] (Pink, Closed triangle=Light, Open
trian-gle=Dark), [Co-FeBC4@TiO2] (Wine, Closed circle=Light, Open circle=Dark)
Figure 3.11: LSV curves of Bare-TiO2 (Red, Closed square=Light, Open
square=Dark), [Co-PB@TiO2] (Pink, Closed triangle=Light, Open
trian-gle=Dark), [Co-FeB2C2@TiO2] (Blue, Closed circle=Light, Open circle=Dark)
3.6.2
Chronoamperometry
To check the stability of photoanodes both short term and long term chronoam-perometry was done.
3.6.2.1 Short-term Chronoamperometry
Applying the potential of 1.22 V vs RHE and keeping scan rate of 50 mV/s, stability of photoanodes was examined for 300s. All the photoanodes have shown stability for short time period (Figure 3.12). However, the current densities for [Co-FeBC4@TiO2] and [Co-FePC4@TiO2] are higher than [Co-FeB2C2@TiO2] and
[Co-FeP2C2@TiO2], which support LSV results.
3.6.2.2 Long-term Chronoamperometry
Stability of photoanodes was also tested for longer time i.e. 2hr. Figure 3.13a clearly depicts the high stability of [Co-FeBC4@TiO2] versus [Co-FeB2C2@TiO2],
which gradually became unstable during the course of time. It can be seen in Table 3.6 that a difference of ≈6 or 7 µA emerged before and after the stability test supporting the fact that cobalt couldn’t bind to [FeB2C2] and [FeP2C2] as
strongly and efficiently (Table 3.10). This is because cyanide ligands are more competent to bind with titania surface than bpy/phen ligands thereby reducing the efficient binding of cobalt with the chromophore. Long-term chronoamperom-etry parameters were kept the same as for short-term chronoamperomchronoamperom-etry (1.22 V applied bias vs RHE, 50 mV/s scan rate).
*CA is a short form of Chronoamperometry where j is current density. Photoanodes j(µA/cm2) before CA j(µA/cm2) after CA (2hr) [Co-FeB2C2@TiO2] 41 33
[Co-FeP2C2@TiO2] 52 51
[Co-FeBC4@TiO2] 40 33
[Co-FePC4@TiO2] 53 52
Table 3.10: Difference in current densities (µA/cm2) of (a) [Co-FeB2C2@TiO2]
(blue) and [Co-FeBC4@TiO2] (wine) (b) [Co-FeP2C2@TiO2] (brown) and
[Co-FePC4@TiO2] (magenta) before and after 2hr chronoamperometry.
Figure 3.12: Short-term chronoamperometry (300s, ν=50mV/s) (a) [Co-FeB2C2@TiO2] (blue) (b) [Co-FeP2C2@TiO2] (brown) (c) [Co-FeBC4@TiO2]
Similar current vs time profiles were observed for [Co-FeP2C2@TiO2] and
[Co-FePC4@TiO2] (Figure 3.13). Current density remained almost constant for 2hr
indicating the sustainability of [FePC4-Co] over TiO2 surface. However, [FePC4
-Co] Prussian blue analogue (PBA) started to fall off the TiO2 surface with time
proving it’s inefficiency for water oxidation.
Figure 3.13: Long-term chronoamperometry (2hr, ν=50 mV/s, V=1.22 volts versus RHE) (a) [Co-FeB2C2@TiO2] (blue), [Co-FeBC4@TiO2] (wine) (b)
[Co-FeP2C2@TiO2] (brown), [Co-FePC4@TiO2] (magenta).
3.7
Post-Catalytic Characterization
3.7.1
Linear Sweep Voltammetry (LSV)
After 2hr of extensive stability test of PBA modified TiO2 coated FTO,
cur-rent density was measured again via LSV to validate the efficiency of these electrodes. It is signified from the Figure 3.14 the endurance and longevity of [Co-FeBC4@TiO2] and [Co-FePC4@TiO2] electrodes even after 2hr of
chronoam-perometry. This revealed that iron complexes with four cyanide ligands can coordinate better with cobalt bringing out PBA with better performance toward oxidation of water. This is in good consensus with long-term chronoamperometry results.
Figure 3.14: Post-catalytic LSV (0.2-2.0 V versus RHE, ν=50 mV/s), (a) [Co-FeBC4@TiO2], (b) [Co-FePC4@TiO2], Red=Before stability test, Black=After
stability test.
In contrary to this, [Co-FeB2C2@TiO2] and [Co-FeP2C2@TiO2] showed
obvi-ous decomposition subsequent to stability test supporting long-term chronoam-perometry results. This developed an evident comprehension that iron complexes having two cyanide ligands are unable to hold the cobalt catalyst thereby declin-ing the efficiency of photoanodes. It can be seen in the Figure 3.15 that current density at higher potential is lower after stability test, attributed to decrease in water oxidation cobalt sites due to decomposition of PBA over titania surface.
Figure 3.15: Post-catalytic LSV (0.2-2 V vs RHE, ν=50 mV/s), (a) [Co-FeB2C2@TiO2], (b) [Co-FeP2C2@TiO2], Red=Before stability test, Black=After
stability test.
3.7.2
X-Ray Photoelectron Spectroscopy (XPS)
Figure 3.16 represents the Co2p spectra recorded for pristine and postcatalytic photoanodes. Altogether, similar profiles are observed for each case. Two dom-inant bands are located at around 781 eV and 797 eV for 2p1/2 and 2p3/2
re-vealed the presence of Co2+ in both pristine and postcatalytic [Co-FeBC4@TiO2]
and [Co-FePC4@TiO2]. Also peaks characteristic to Co3+ are also present
with satellite bands displaying a descent stability of [Co-FeBC4@TiO2] and
[Co-FePC4@TiO2] toward photoelectrochemical water oxidation process (Figure 3.16,
3.17) [60]. However, Co3+has signal enhancement in postcatalytic samples, which
showed partial oxidation of cobalt sites during water oxidation process. Exact peaks position in eV is shown in Table 3.11. [56] [58] [69]. Moreover, the formation of thermodynamically stable Co3O4is eminent by a dominant band located below
or close to 780 eV [69] [58] [44], which is absent in our case. Therefore, this ratio-nalize the stability of our photoanodes which does not show any decomposition to cobalt oxide.
Complexes Co2+(2p1/2, 2p3/2) pristine Co2+(2p1/2, 2p3/2) postcatalytic
[Co-FeBC4] 781.58 eV, 797.18 eV 781.78 eV, 797.28 eV
[Co-FePC4] 781.68 eV, 797.38 eV 781.59 eV, 797.39 eV
Table 3.11: Binding Energies of Co2p of pristine and postcatalytic electrodes.
Figure 3.16: Pristine and Postcatalytic XPS of [Co-FeBC4@TiO2], Red=Pristine,
Black=Postcatalytic.
N1s region of pristine and postcatalytic samples of both the electrodes showed peaks at approximately 399 eV and 397 eV corresponding to CN of phen/bpy ligands (Table 3.12) and CN linked to cobalt catalyst shown in the Figure 3.16 and 3.17 [56] [58] [69] [68].
Complexes N1s (eV) Pristine N1s (eV) postcatalytic [Co-FeBC4] 397.58, 399.58 397.48, 399.68
[Co-FePC4] 397.58, 399.88 397.77, 39.87
Figure 3.17: Pristine and Postcatalytic XPS of [Co-FePC4@TiO2], Red=Pristine,
Black=Postcatalytic.
Comparison of Fe2p XPS spectra of photoanodes before and after photoelec-trocatalytic measurements are shown in Figure 3.16 and 3.17. Similar to pristine samples, two ruling peaks at binding energies of approximately 708 eV and 720 eV represent 2p3/2 and 2p1/2 of Fe2+ while two smaller bands at around 709 eV
and 723 eV might be present attributed to the presence of Fe2+ to Fe3+ ions in
[Fe(CN)4]2−fragment. The similarity in XPS spectra of pristine and postcatalytic
further justify the stability of photoanodes (Table 3.13) [59] [68].
Complexes Fe2+(2p1/2, 2p3/2) pristine Fe2+(2p1/2, 2p3/2) postcatalytic
[Co-FeBC4] 720.97 eV, 708.28 eV 720.78 eV, 708.18 eV
[Co-FePC4] 721.08 eV, 708.18 eV 721.11 eV, 708.11 eV
Table 3.13: Binding Energies of Fe2p of pristine and postcatalytic electrodes.
3.7.3
Scanning Electron Microscopy (SEM) and Energy
Dispersive X-ray Analysis (EDX)
SEM images of [CoFe-coat@TiO2/FTO] indicate that PBA retained continuous film over titania surface even after photoelectocatalytic water oxidation process (Figure 3.18).
Figure 3.18: SEM images of (a) [Co-FeBC4] PBA pristine, (b) [Co-FeBC4] PBA
postcatalytic, (c) [Co-FePC4] PBA pristine, (d) [Co-FePC4] PBA postcatalytic.
Molecular formulas are calculated based on EDX results (Figure 3.19) to see the Co:Fe ratios in PBA. The Co:Fe ratios are almost 1:1 in postcatalytic samples. The molecular formulas are mentioned the Table 3.14.
Figure 3.19: EDX analysis of (a) [Co-FeBC4@TiO2] postcatalytic, (b)
[Co-FePC4@TiO2] postcatalytic.
Photoanodes Molecular Formulas [Co-FeBC4@TiO2] Co1.2[(bpy)Fe(CN)4].(NO3)0.4.xH2O
[Co-FePC4@TiO2] Co1.3[(phen)Fe(CN)4].(NO3)0.6.xH2O
Table 3.14: Molecular formulas of [Co-Fe/TiO2] (post-catalytic) calculated using
EDX % atomic ratios.
3.7.4
Incident Photon to Current Efficiency (IPCE)
For incident photon-to-current conversion efficiency (IPCE) measurement, light from the Xenon lamp was dispersed by a monochromator and the photocurrent was recorded at a constant bias (1.23 V vs RHE) with a spectral step of 10 nm. This light is entered into a monochromator (Oriel 1/8 m cornerstone, 1200 lines/mm grating) and the output of the monochromator is illuminated onto the photoanode in three-electrode setup. The current was recorded using a computer-controlled setup consisting of potentiostat (CH instrument). The dark and under illumination current values for different incident light wavelengths are measured. To find the portion of photocurrent, these two current amounts are subtracted.
To calculate the IPCE, the following equation was used: IP CE(%) = 1240 λ × j Plig ht × 100 (3.1)
where j is the photocurrent density (mA/cm2), λ is the incident light
wave-length (nm) from monochromatic light, Plig ht is the power density of
monochro-matic light at a specific wavelength (mW/cm2).
Figure 3.20: IPCE (%) of (a) [Co-FeB2C2@TiO2], [Co-FeP2C2@TiO2], (b)
[Co-FeBC4@TiO2], [Co-FePC4@TiO2].
Dye molecules have dominant absorption between 300-350 nm. That is why IPCE data shows considerable improvement. For [Co-B2C2@TiO2] and
[Co-BC4@TiO2] samples, a local maximum is observed at around 360 nm, seen from
UV-Vis spectra. Therefore, the IPCE reaches its maximum at this spectral po-sition. For [Co-P2C2@TiO2] and [Co-PC4@TiO2] samples, a weak but broad
absorption is probed from 370 nm to 580 nm. From IPCE data, the absorption in this regime leads to photocurrent generation at wavelengths above 410 nm where TiO2 is inactive (Figure 3.19).
3.7.5
Band Alignment Interpretation
Finally, to see the reliability of our results band alignments of all the photoanodes were assigned. Briefly, band gap of titania is already reported in our previous
study. So, the band gaps of our Co-Fe PBAs are calculated using their UV-Vis absorption profiles specifically MLCT band wavelengths. Also, the energy of HOMO (highest occupied molecular orbital) level is taken from the onset po-tential of dark LSV already recorded for all the photoanodes. As expected, [Co-FePC4@TiO2] has lower LUMO (lowest unoccupied molecular orbital) level (-0.92
eV) than LUMO of [Co-FeBC4@TiO2] which is located at -1.01 eV. This supports
IPCE results where [Co-FeBC4@TiO2] absorbs less than [Co-FePC4@TiO2]
(Fig-ure 3.21).
Figure 3.21: Band diagram for (a) [Co-FeBC4@TiO2], (b) [Co-FePC4@TiO2],
arrows show the movement of charges after illumination.
Contrary to this, LUMO levels of [Co-FeP2C2@TiO2] and [Co-FeB2C2@TiO2]
are much lower and their positions are not suitable enough with respect to con-duction band (CB) of titania for efficient electron transfer [23] (Figure 3.22). Overall, the3MLCT state is not suitable for sensitization of titania as explained
by Jakubikova et al. [23] [20]. Conversely, we have also associated cobalt with iron chromophores which makes it efficient for electron transfer as well as reduces
charge recombination.
Figure 3.22: Band diagram for (a) [Co-FeB2C2@TiO2], (b) [Co-FeP2C2@TiO2],
Chapter 4
Conclusion
Photoelectrochemical water splitting is considered as a promising pathway for solar-to-hydrogen fuel conversion with increased efficiency and effective in cost. Combined efforts have been put to improve the efficiency via enhanced light ab-sorption and greater surface catalysis. In this thesis, low cost, efficient and earth abundant transition metal based complexes have been employed as chromophores for oxidizing water to oxygen in water splitting application.
The first and foremost approach of this project was the synthesis and charac-terization of iron chromophores. The synthetic methods introduced here are the simplest with no toxic by-products formation compared to previously reported comprehensive procedures [64]. This study presented novel heterogeneous pho-toanodes composed of iron chromophores, acting as a bridge between semicon-ductor and water oxidation catalyst. Presumably, this is the first study utilising stable [FeBC4-Co] and [FePC4-Co] Prussian blue analogues for oxidation of
wa-ter. The confirmation of these iron chromophores as well as the formation of their Prussian blue analogues was accomplished gradually through multiple char-acterizations such as UV-Vis, FTIR, and XPS, etc. EDX analysis revealed the formation of non-stoichiometric Co-Fe Prussian blue analogues roughly 1:1 ratio in powdered samples and those over titania surface.
![Figure 1.2: Structure of [F e(btz) 3 ] 2+ complex having 528 ps 3 M LCT lifetime.](https://thumb-eu.123doks.com/thumbv2/9libnet/5657899.112928/22.918.179.793.744.1021/figure-structure-f-btz-complex-having-lct-lifetime.webp)
![Figure 1.7: Structures of Iron Chromophores (a) [FeB 2 C 2 ], (b) [FeP 2 C 2 ], (c) [FeBC 4 ], (d) [FePC 4 ].](https://thumb-eu.123doks.com/thumbv2/9libnet/5657899.112928/33.918.172.790.526.988/figure-structures-iron-chromophores-feb-fep-febc-fepc.webp)