D i f f e r e n t i a t i o n and localization of target p r i m i t i v e s
using infrared sensors
T a y f u n A y t a ~ a n d B i l l u r B a r s h a n
Department of Electrical Engineering, Bilkent University Bilkent, TR-06533 Ankara, Turkey
e-mail: { taytac, biUur} @ee.bilkent.edu.tr
Abstract
This study investigates the use of low-cost infrared sensors in the differentiation and localization of com- monly encountered target primitives in indoor envi- ronments, such as planes, corners, edges, and cylin- ders. The intensity readings from such sensors are highly dependent on target location and properties in a way which cannot be represented in a simple man- ner, making the differentiation and localization pro- cess difficult. In this paper, we propose the use of angular intensity scans and present an algorithm to process them. This approach can determine the tar- get type independent of its position. Once the target type is identified, its position can also be estimated. The method is verified experimentally. A n average correct classification rate of 9 7 ~ over all target types is achieved and targets are localized within absolute range and azimuth errors of 0.8 cm and 1.6 °, respec- tively. The proposed method should facilitate the use of infrared sensors in mobile robot applications for differentiation and localization beyond their common usage as simple proximity sensors for object detec- tion and collision avoidance.
1 I n t r o d u c t i o n
Infrared sensors are inexpensive, practical and widely available devices. However, it is often not possible to make reliable distance estimates based on the value of a single intensity return because the return de- pends on both the geometry and other properties of the reflecting target. Likewise, the properties of the target cannot be deduced from simple intensity returns without knowing its distance and angular lo- cation. In this paper, we propose a scanning tech- nique and algorithm t h a t can determine the type of the target in a manner which is invariant to its loca- tion. Once the target type is determined, its position (r, 0) can also be estimated. The method we propose is scalable in the sense t h a t the accuracy can be in- creased by increasing the number of reference scans
without increasing the computational complexity of the differentiation and localization process.
Target differentiation and localization is of consider- able interest in robotics applications, where there is need to identify targets and their positions in mobile robot environments for autonomous operation. Typ- ical applications of infrared sensors in this area are mainly floor sensing, navigational referencing, and collision avoidance at short ranges [1]. In [2], a num- ber of commercially available light-based sensors are evaluated for robotic space applications. In [3], in- frared sensors are employed in locating edges of door- ways where they are used in a complementary fash- ion with sonar sensors in mobile robot navigation. Other researchers have also fused information from infrared and ultrasonic sensors [4, 5]. In [6], sys- tem and implementation issues in infrared proximity sensing in robot manipulator motion planning are discussed. Following this work, [7] describes a teleop- erated whole-sensitive robot arm manipulator whose whole body is covered with a sensitive infrared skin sensor to detect nearby objects. Processing the d a t a from the artificial infrared skin by motion planning algorithms, real-time collision avoidance for the en- tire arm body is achieved in an unknown or dynamic environment. In another study [8], the properties of a planar surface at a known distance have been de- termined using the Phong illumination model, and using this information, the infrared sensor employed has been modeled as a range finder for surfaces at short distances. Reference [9] also deals with de- termining the range of a planar surface. Infrared sensors are used in door detection processes in [10]. However, to the best of our knowledge, no a t t e m p t has been made to differentiate and localize several kinds of targets using infrared sensors.
2 T a r g e t D i f f e r e n t i a t i o n & L o c a l i z a t i o n The infrared sensor [11] used in this study consists of an emitter and detector and works with 20-28 V DC
Proceedings of the 2002 IEEE/RSJ Intl. Conference on Intelligent Robots and Systems
plane corner edge cylinder
F i g u r e 1" Target primitives used in this study. i
(~
line-of-sight
F i g u r e 2: Top view of the experimental setup. The emitter and detector windows are circular with 8 m m diameter and center-to-center separation 12 mm. (The emitter is above the detector.) Both the scan angle (~ and the target azimuth ~ are measured counter-clockwise from the horizontal axis.
input voltage, and provides analog output voltage proportional to the measured intensity. The detector window is covered with an infrared filter to minimize the effect of ambient light on the intensity measure- ments. Indeed, when the emitter is turned off, the detector reading is essentially zero. The sensitivity of the device can be adjusted with a potentiometer to set the operating range of the system.
The targets employed in this study are plane, 90 ° corner, 90 ° edge, and a cylinder of radius 4.8 cm, whose cross-sections are given in Figure 1. They are made of wood, each with a height of 120 cm. Our method is based on angularly scanning each target over a certain angular range. The infrared sensor is mounted on a 12 inch rotary table [12] (Figure 2) to obtain angular scans from these tar- get primitives. The mean and standard deviation of 100 samples are calculated at each position of the rotary table to observe the effect of noise on the mea- surements. The standard deviation of the intensity measurements is about 0.1 V and is approximately constant with changing distance. Reference data sets are collected for each target with 2.5 cm distance in- crements, ranging from 15 cm to the maximum de- tectable range of each target, at 0 = 0 °. The out- put signal is processed using an 8-bit microprocessor compatible A / D converter chip having a conversion time of 100 psec.
The resulting reference scans for plane, corner, edge
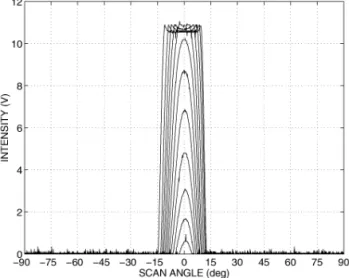
12 10 8 Z - - 4 2 0 a , . , t , , , 1 , , - 9 0 - 7 5 - 6 0 - 4 5 - 3 0 -15 0 15 30 45 60 75 90 SCAN ANGLE (deg)
F i g u r e 3: Intensity scans for planes at different dis- tances.
i6l ...
-120 -100 -80 -60 - 4 0 - 2 0
SCAN ANGLE (deg)
0 20 40 60 80 100 120
F i g u r e ~" Intensity scans for corners at different distances. 10 8 6 z 4 2 0 -90 -75 -60 -45 -30 -15
SCAN ANGLE (deg)
0 15 30 45 60 75 90
F i g u r e 5: Intensity scans for edges at different dis- tances.
12 10 8 > >.. I - ra 6 z Iii z 4
0 ,t,~,_,,ai ,j L. ; ,~,,.u,,a .:,, ,,,.u,.~,;a . . . ,,,., - 9 0 - 7 5 - 6 0 - 4 5 - 3 0 - 1 5 0
~,:_ ,L,°.L,; .... L ... ;,,,a .. . . . ;/- . . . . ;A,a. .. . . 5 3 0 4 5 6 0 7 5 9 0 S C A N A N G L E ( d e g )
Figure 6: Intensity scans for cylinders at different distances.
and cylinder are shown in Figures 3-6, respec- tively. The intensity scans are 0-invariant but not r-invariant; changes in r do not result in any simple scaling. As we will see, these scans contain sufficient information to identify and localize the different tar- get types with a good degree of accuracy. Figure 4 shows the distinctive double-humped scan p a t t e r n for the corner target (this double-humped p a t t e r n can be interpreted by thinking of the corner in terms of its two orthogonal constituent planes). As can be guessed from these figures, the greatest difficulty is encountered in differentiating cylinders and edges which have the most similar intensity patterns. No- tice t h a t the r e t u r n signal intensities s a t u r a t e at an intensity corresponding to 10.7 V o u t p u t voltage. We now describe how to determine the target type and position of an arbitrarily located target whose intensity scan has been observed. First, we check whether the observed scan I ( a ) exhibits s a t u r a t i o n or not. This situation is t r e a t e d separately as will be explained later in Section 2.3. A corner scan is considered s a t u r a t e d when its central intensity enters the s a t u r a t i o n region, not the humps, since it is the former value which is critical for our m e t h o d below. We start by determining the target type. Unfor- tunately, direct comparison with the corresponding curves in Figures 3-6 is not possible since we do not yet know the distance of the target, and comparing with all the curves at all distances would be com- putationally very expensive. Therefore, we exploit the fact t h a t the successive curves in Figures 3-6 exhibit a monotonic dependence on distance. Fur- thermore, when an observed scan is compared to the several successive curves in any of Figures 3-6, the two measures of difference between t h e m described in Sections 2.1 and 2.2 also exhibit a monotonic fall
and rise around a single minimum. Therefore, we are assured t h a t we will not be settling at a sub- optimal point if we compare the observed scan not with all scans at all distances but only with the four scans (one for each target type) whose central inten- sities are closest to t h a t of the observed scan. (This can also be viewed as a kind of nearest-neighbour search.) Therefore, for u n s a t u r a t e d scans, only four comparisons need to be made. This remains the case even if the 2.5 cm increments are reduced to smaller values. This has the advantage t h a t the accuracy of the system can be increased without increasing the cost of computation, which only depends on the number of angular samples (although a greater num- ber of scans do have to be stored). As a test, we also ran a version of the m e t h o d where eight comparisons were made using the scans with the nearest central intensities b o t h above and below the observed cen- tral intensity, and also using all of the scans shown in Figures 3-6. These computationally more expensive approaches, exceedingly more so in the latter case, did not improve the result with respect to compar- ison with only four scans. In fact, in the matched filtering case discussed in Section 2.2, the results are even somewhat better when four scans are used, due to the fact t h a t this systematic elimination of a pri- ori suboptimal scans eliminates the small possibil- ity t h a t they will mistakingly be chosen as the best matching scan due to noise and other errors. Two alternative approaches are employed in per- forming the four comparisons. These are discussed below in the following two subsections:
2.1 L e a s t - S q u a r e s A p p r o a c h
First, we estimate the angular position of the target as follows: Assuming the observed scan p a t t e r n is not saturated, we check if it has two humps or not. If so, it is a corner and we find the angular location of the dip in the middle of the two humps and the corresponding intensity value. If not, we find the angular location of the m a x i m u m and again the cor- responding intensity value. These angular values can be directly taken as estimates of the angular position of the target. Alternatively, the angular position can be estimated by finding the center-of-gravity (COG) of the scan as follows:
e c o G - (I)
Ideally, these estimates would be equal, but in prac- tice they differ by a small amount. We will consider the use of b o t h alternatives when t a b u l a t i n g our re- sults. From now on, we will refer to either estimate as the "center angle" of the scan.
Plots of the intensity at the center angle of each scan in Figures 3-6 as a function of the distance at which
6 P__ z 4 2 0 : + plane ~ corner ~ . . ~ . _ ~..'~."%.. ~ - edge 20 30 40 50 60 70 DISTANCE (cm)
F i g u r e 7: Central intensity versus distance curves for the different targets.
t h a t scan was obtained, play an important part in our method. Figure 7 shows these plots for the max- imum intensity (central dip intensity for corner) case.
In this approach, we compare the intensity scan of the observed target with the four reference scans by computing their least-squares differences after align- ing their centers with each other. Since the squared difference is sensitive even to multiplicative factors which are close to unity, we have employed an in- terpolated reference scan obtained by linearly inter- polating between the two consecutive scans whose central intensities are just above and just below the observed scan. The mean-square difference between the observed scan and the four interpolated scans, one for each possible target type, is computed as fol- lows:
n
~ j -- E [ I ( o L i -- O/align) - - Ij(oLi)] 2 ( 2 ) i - 1
where Ij, j = 1, 2, 3, 4 denote the four interpolated scans. Here, O/alig n is the angular shift which is nec- essary to align both patterns. The target type re- sulting in the smallest value of E is declared as the observed target. Once the target type is determined, the range can be estimated by using linear interpo- lation on Figure 7. Note that, this way, the accuracy of the method is not limited by the 2.5 cm spacing used in collecting the reference scans.
2.2 M a t c h e d F i l t e r i n g A p p r o a c h
As an alternative, we have also considered the use of matched filtering [13] to compare the observed and reference scans. The output of the matched filter is the cross-correlation between the observed intensity scan and the j t h reference scan normalized by the
square root of its total energy:
yj(l) -
(3)
v/E [5
The target type corresponding to the m a x i m u m cross-correlation peak is declared as the correct tar- get type, and the angular position of the correlation peak directly provides an estimate of the azimuth angle of the target. Then, the distance is estimated by using linear interpolation on Figure 7 with the intensity value at the azimuth estimate.
2.3 S a t u r a t e d Scans
If saturation is detected in the observed scan, spe- cial t r e a t m e n t is necessary. In the least-squares ap- proach, mean-square difference between the aligned observed scan and all the s a t u r a t e d reference scans are computed and the target type with the minimum mean-square difference is chosen. The range estimate of the target is taken as the distance corresponding to the scan resulting in the minimum mean-square difference. Similarly, for the matched filter, corre- lation between the observed scan and all the stored saturated reference scans is computed and the target resulting in the highest correlation peak is selected. The range estimate is again taken as t h a t of the best matching scan.
It should be noted that, in the s a t u r a t e d case, range estimation accuracy is limited by the 2.5 cm interval at which the reference scans were taken since inter- polation is not possible. If this accuracy is not sat- isfactory, it can be improved by reducing the 2.5 cm intervals. We underline t h a t the 2.5 cm interval does not limit the range estimation accuracy in the unsat- urated case, where accurate interpolation is possible from Figure 7.
E x p e r i m e n t a l V e r i f i c a t i o n a n d D i s c u s - s i o n
In this section, we experimentally verify the proposed m e t h o d by locating the targets at randomly selected distances and azimuth angles (r, 0) and collecting a total of 120 test scans. The targets are randomly located at azimuths varying from - 4 5 ° to 45 ° from 15 cm up to the m a x i m u m ranges in Figures 3-6. The results of least-squares based target differentia- tion are displayed in Tables 1 and 2 in the form of target confusion matrices. Table 1 gives the results obtained using the m a x i m u m (or the central dip for corner) intensity values, and Table 2 gives those ob- tained using the intensity value at the COG of the scans. The average accuracy over all target types can be found by summing the correct decisions given along the diagonal of the confusion m a t r i x and di- viding this sum by the total number of test trials
(120). T h e a v e r a g e correct classification r a t e s ob- t a i n e d by using t h e m a x / d i p a n d t h e C O G v a r i a t i o n s of t h e l e a s t - s q u a r e s a p p r o a c h are 93% a n d 89%, re- spectively.
M a t c h e d filter differentiation results are p r e s e n t e d in Table 3. T h e a v e r a g e a c c u r a c y of differentiation over all t a r g e t t y p e s is 97% which is b e t t e r t h a n t h a t o b t a i n e d with t h e l e a s t - s q u a r e s a p p r o a c h . T h e m a t c h e d filter c o r r e c t l y classifies p l a n a r t a r g e t s as well as corners w i t h an a c c u r a c y of 100%.
Table 1: Target confusion matrix: least-squares
based classification (max/dip variation) (P: plane, C: corner, E: edge, CY: cylinder).
t a r g e t differentiation result t o t a l P C E CY P 29 - 1 - 30 C - 30 - - 30 E 1 - 26 3 30 CY 4 - - 26 30 t o t a l 34 30 27 29 120
Table 2: Target confusion matrix:
based classification (COG variation).
least-squares t a r g e t differentiation result t o t a l P C E CY P 30 - - - 30 C - 30 - - 30 E 5 - 23 2 30 CY 4 - 2 24 30 t o t a l 39 30 25 26 120
Table 3: Target confusion matrix:
based classification. matched filter t a r g e t differentiation result t o t a l P C E CY P 30 - - - 30 C - 30 - - 30 E - - 29 1 30 CY - - 3 27 30 t o t a l 30 30 32 28 120
As shown in t h e tables, corners are always c o r r e c t l y identified r e g a r d l e s s of which m e t h o d is used, due to t h e i r distinctive s i g n a t u r e . Second b e s t to corners are planes which are also usually c o r r e c t l y identified. Cylinders a n d edges are t h e m o s t confused t a r g e t t y p e s as we h a d e x p e c t e d f r o m t h e similar n a t u r e of their i n t e n s i t y scans. N e a r l y all misclassified t a r - gets are l o c a t e d at far r a n g e s w h e r e t h e r e t u r n signal intensities are very weak.
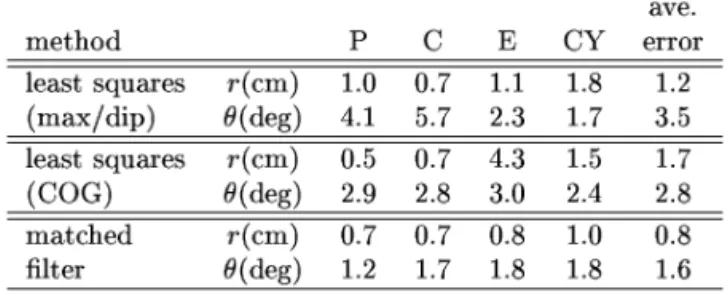
T h e a v e r a g e a b s o l u t e r a n g e a n d a z i m u t h e s t i m a t i o n errors for t h e different a p p r o a c h e s are p r e s e n t e d in
Table ~: Absolute range and azimuth estimation er-
rors over all test targets.
ave.
m e t h o d P C E C Y error
least squares r ( c m ) 1.0 0.7 I.I 1.8 1.2
( m ~ / d i p ) 0(deg) 4.1 5.7 2.3 1.7 3.5
least squares r ( c m ) 0.5 0.7 4.3 1.5 1.7
(COG) 0(deg) 2.9 2.8 3.0 2.4 2.8
matched r(cm) 0.7 0.7 0.8 1.0 0.8
filter 0(deg) 1.2 1.7 1.8 1.8 1.6
Table 4. As seen in t h e table, using t h e m a x / d i p a n d C O G v a r i a t i o n s of t h e l e a s t - s q u a r e s a p p r o a c h , t h e t a r g e t r a n g e s are e s t i m a t e d with a v e r a g e abso- lute r a n g e errors of 1.2 cm a n d 1.7 cm, respectively. M a t c h e d filtering results in an a v e r a g e a b s o l u t e r a n g e e r r o r of 0.8 cm which is m u c h b e t t e r t h a n t h a t ob- t a i n e d with t h e l e a s t - s q u a r e s a p p r o a c h . T h e g r e a t e s t c o n t r i b u t i o n to t h e r a n g e errors comes f r o m t a r g e t s which are i n c o r r e c t l y differentiated. If we a v e r a g e over only correctly differentiated t a r g e t s , t h e a v e r a g e a b s o l u t e r a n g e errors are r e d u c e d to 0.6 cm, 0.6 cm, a n d 0.7 cm for t h e m a x / d i p a n d C O G v a r i a t i o n s of l e a s t - s q u a r e s a n d t h e m a t c h e d filter a p p r o a c h e s , re- spectively. Since t h e s e n u m b e r s are c o m p a r a b l e , we m a y conclude t h a t t h e superior r a n g e a c c u r a c y of m a t c h e d filtering is m o s t l y a c o n s e q u e n c e of its su- p e r i o r differentiation accuracy.
As for a z i m u t h e s t i m a t i o n , m a t c h e d filtering results in an a v e r a g e a b s o l u t e e s t i m a t i o n e r r o r of 1.6 °, which is t h e b e s t a m o n g t h e different a p p r o a c h e s c o m p a r e d . A v e r a g i n g t h e a z i m u t h errors over only correctly d i f f e r e n t i a t e d t a r g e t s does not result in significant changes. This is due to t h e fact t h a t a z i m u t h esti- m a t i o n is not d e p e n d e n t on correct differentiation. B e c a u s e of t h e s h a r p n e s s of t h e scans for t h e cylin- drical t a r g e t a r o u n d t h e i r peaks, a z i m u t h e s t i m a t i o n of cylinders is m o r e a c c u r a t e t h a n t h a t of o t h e r t a r - gets w h e n t h e l e a s t - s q u a r e s a p p r o a c h is used. On t h e o t h e r h a n d , a n g u l a r localization of corners is less a c c u r a t e since it is difficult to e s t i m a t e with g o o d a c c u r a c y t h e e x a c t a n g u l a r location of t h e relatively shallow central dip, especially with t h e m a x / d i p vari- a t i o n of l e a s t - s q u a r e s a p p r o a c h . T h e C O G v a r i a t i o n is, on t h e average, b e t t e r t h a n t h e m a x / d i p varia- tion in a z i m u t h e s t i m a t i o n due to t h e fact t h a t C O G b a s e d calculations a v e r a g e out t h e noise in t h e r e t u r n signal intensities.
4 C o n c l u s i o n
In this study, differentiation a n d localization of com- m o n l y e n c o u n t e r e d indoor f e a t u r e s or t a r g e t s such as plane, corner, edge, a n d cylinder is achieved using an
inexpensive infrared emitter and detector pair. Dif- ferent approaches are compared in terms of correct target differentiation, and range and azimuth estima- tion accuracy. A typical application of the demon- strated system would be in mobile robotics in sur- veying an unknown environment composed of such features or targets. Many artificial environments fall into this category. We plan to test and evaluate the developed system on a small mobile robot in our lab- o r a t o r y for map building in a test room composed of the primitive target types considered in this study. The accomplishment of this study is t h a t even t h o u g h the intensity p a t t e r n s are highly dependent on target location, and this dependence cannot be represented by a simple relationship, we achieve position-invariant target differentiation. An average correct target differentiation rate of 97% over all tar- get types is achieved and targets are localized within absolute range and azimuth errors of 0.8 cm and 1.6 °, respectively. The m e t h o d we propose is scalable in the sense t h a t the accuracy can be increased by in- creasing the number of reference scans without in- creasing the c o m p u t a t i o n a l cost.
In this paper, we have d e m o n s t r a t e d target differen- tiation using four basic target types. However, based on the d a t a we have collected, it seems possible to increase this number up to at least ten, provided the targets are not too similar. Current work investi- gates the deduction of not only the geometry but also the surface properties of the target from its intensity scan without knowing its location. Preliminary re- sults indicate t h a t the m e t h o d of this paper can be applied to this case with little or no modification by treating the combination of a particular geometry and particular surface as a generalized target type. These results will be reported elsewhere [14]. Future work may involve developing p a r a m e t r i c models for the curves in Figures 3-6 which would enable more direct determination of the target type and position.
5 A c k n o w l e d g m e n t
This research was supported by T U B I T A K under B D P and 197E051 grants. The authors would like to t h a n k the Robotics Research Group of the Uni- versity of Oxford for donating the infrared sensors.
[10]
[11]
[12]
[13]
[14]
[3] A. M. Flynn, "Combining sonar and infrared sen- sors for mobile robot navigation," Int. J. Robot. Res., vol. 7, no. 6, pp. 5-14, December 1988.
[4] A. M. Sabatini, V. Genovese, E. Guglielmelli, A. Mantuano, G. Ratti, and P. Dario, "A low-cost, composite sensor array combining ultrasonic and in- frared proximity sensors," in Proc. I E E E / R S J Int. Conf. Intell. Robots Syst., pp. 120-126, Pittsburgh, Pennsylvania, U.S.A., 5-9 August 1995.
[5] H. M. Barbera, A. G. Skarmeta, M. Z. Izquierdo, and J. B. Blaya, "Neural networks for sonar and infrared sensors fusion," in Proc. Third Int. Conf. Information Fusion, vol. 7, pp. 18-25, France, July 2000. [6] E. Cheung and V. J. Lumelsky, "Proximity sensing in
robot manipulator motion planning: system and im- plementation issues," IEEE Trans. Robot. Automat., vol. 5, no. 6, pp. 740-751, December 1989.
[7] V. J. Lumelsky and E. Cheung, "Real-time collision avoidance in teleoperated whole-sensitive robot arm manipulators," IEEE Trans. Syst., Man, Cybern., vol. 23, no. 1, pp. 194-203, January/February 1993. [8] P. M. Novotny and N. J. Ferrier, "Using infrared
sensors and the Phong illumination model to mea- sure distances," in Proc. IEEE Int. Conf. Robot. A u- tomat., pp. 1644-1649, Detroit, MI, 2 April 1999. [9] B. Ando and S. Graziani, "A new IR displacement
system based on noise added theory," in Proc. IEEE Instrum. Meas. Tech. Conf., pp. 482-485, Budapest, Hungary, 21-23 May 2001.
G. Beccari, S. Caselli, and F. Zanichelli, "Qualitative spatial representations from task-oriented perception and exploratory behaviors," Robot. Autonom. Syst., vol. 25, no. 3/4, pp. 147-157, 30 November 1998. IRS-U-4A Datasheet, Matrix Elektronik, AG, Kirch- weg 24 CH-5422 Oberehrendingen, Switzerland. RT-12 Rotary Positioning Table, Arrick Robotics,
P.O. Box 1574, Hurst, Texas, 76053, URL:
www.robotics.com/rt 12.html, 2002.
J. W. Goodman, Introduction to Fourier Optics, 2nd ed., McGraw-Hill, New York, 1996, pp. 246-249. T. Ayta(;, Differentiation and Localization of Tar- get Primitives Using Infrared Sensors, M.Sc. thesis, Bilkent University, Department of Electrical Engi- neering, Ankara, Turkey, July 2002.
R e f e r e n c e s
[1] H. R. Everett, Sensors for Mobile Robots, Theory and Application. 289 Linden St., Wellesley, MA: A K Pe- ters, Ltd., 1995.
[2] L. Korba, S. Elgazzar, and T. Welch, "Active in- frared sensors for mobile robots," IEEE Trans. In- strum. Meas., vol. 43, no. 2, pp. 283-287, April 1994.