PROCEEDINGS OF SPIE
SPIEDigitalLibrary.org/conference-proceedings-of-spieMicrocavity effects in the
photoluminescence of hydrogenated
amorphous silicon nitride
Ali Serpenguzel
Atilla Aydinli
Alpan Bek
Microcavity effects in the photoluminescence of hydrogenated
amorphous silicon nitride
Mi Serpenguzel,a Atilla Aydiflhi, and Alpan Bek
a Permanent adress: Bilkent University, Physics Department, Bilkent, Ankara 06533
Turkey bUniversity
of California, Electrical and Computer Engineering Department,
Santa Barbara, California 93 106-9560 USA
ABSTRACT
FabryPerot microcavities are used for the alteration of photoluminescence in hydrogenated amorphous silicon nitride grown with and without ammonia. The photoluininescence is red-near-infrared for the samples grown without ammonia,
and blue-green for the samples growii with ammonia. In the Fabry-Perot microcavities, the amplitude of the
photoluniinescence is enhanced, while its linewidth is reduced with respect to the bulk hydrogenated amorphous silicon nitride. The microcavity was realized by a metallic back mirror and a hydrogenated amorphous silicon nitride air or a metallic front niirror. The transmittance, reflectance, and absorbance spectra vere also measured and calculated. The calculated spectra agree well with the experimental spectra. The hydrogenated amorphous silicon nitride microcavity has potential for becoming a versatile silicon based optoelectronic device such as a colot flat panel display, a resonant cavity enhanced light emitting diode. or a laser.
Keywords: microcavity, FabryPerot, amorphous silicon, photoluminescence. resonators, thin films, spontaneous
emission, optoelectronics, plasma enhanced chemical vapor deposition.
1. INTRODUCTION
Interest in silicon (Si) as a material for optoelectronics has increased recently. With modern process techniques, it will be possible to integrate lasers, photodetectors, and waveguides on optoelectronic silicon motherboards. Hydrogenated amorphous silicon (a-Si:H)' has been used for the realization of planar waveguides, which will be able to route and modulate optical signals within such a silicon motherboard. An advantage of a-Si:H is that, it can be deposited by plasma enhanced chemical vapor deposition (PECVD) on almost any substrate at temperatures below 500 K, which makes it compatible with the microelectronic technology. Another advantage of the amorphous silicon2 as well as porous silicon3 is that, they attract interest as a potential optical gain medium because of their room temperature visible electroluminescence and photolununescence (PL).
Microcavities also continue to attract attention, due to their unique optical properties.4 In a inicrocavity, two
electromagnetic and quantum electrodynamic effects occur. First. the microcavity acts as an optical resonator for light rays with specific wavelengths, vhich after one round trip, return to their starting position in phase, i.e. , resonate in the
rnicrocavity. Second, in a microcavity, the photon density of states are enhanced at the cavity resonances, when compared with the continuuni of photon states of a bulk sample. The spontaneous emission (luminescence) cross—sections (quantum efficiencies) at the microcavity resonances are larger than the bulk spontaneous emission cross-sections because of the enhanced photon density of states.5 Also, the luminescence cross-sections in between the microcavity resonances are
Further author information
-A. S. (correspondence) : E-mail: serpen(O)fen.bilkent.edu.tr; WWW: http//www.fen.bilkent.edu.tr/serpen; Telephone: 90 (3 12) 266-4000 Ext. 1965; Fax: 90 (312) 266-4579
A. A. E-mail: aydinli(d),fen.bilkent.edu.tr, WWW: http//www.fen.bilkent.edu.tr/—aydinli, Telephone: 90 (3 12) 266-4000 Ext. 1579; Fax: 90 (312) 266-4579
A. B. E-mail: bek(O),fen.bilkent.edu.tr; WWW: http//www.fen.bilkent.edu.tr/-..bek, Telephone: 90 (312) 266-4000 Ext. 1972; Fax: 90 (312) 266-4579
snialler than the bulk spontaneous emission cross—sections. Alteration (i.e., enhancement and inhibition) of spontaneous emission in planar microcavities has been both observed experimentally and calculated theoretically.7 These properties of the niicrocavities are used in resonant cavity enhanced (RCE) photonic devices, which are wavelength selective and ideal for wavelength division multiplexing (WDM) applications,8 or color flat panel displays. In vertical cavity surface emitting lasers (VCSEL's),9 as well as microdisk,'° and microwire' lasers, the lasing threshold is reduced and the mode linewidth is narrowed. Siniilarly, in RCE light emitting diodes (LEDs) the efficiency, brightness, and directivity are enhanced.'2 Also, in RCE photodiodes,8 the quantum efficiency is enhanced.
Planar microcavity effects on the PL of porous
n3 as well as Si/SiOx u4 have already been reported.
Recently, we have observed visible PL from a-Si:H, as well as its oxides (a-SiOx:H) and nitrides (a-SiNx:H) grown by low temperature VD' 5.1 6 In this paper, we report, the enhancement and inhibition of PL in an a-SiNx:H Fabry-Perot microcavity. The a-SiNx:H used in the microcavity is grown both with and without ammonia (NH). For the samples grown without NH3 the PL is in the red-near-infrared part of the optical spectnim, while for the samples grown with NH the PL is in the blue-green part of the optical spectrum. ' While the exact mechanism of the occurrence of the PL in bulk a-SiNx:H is still under discussion, we have suggested in Ref. 17 the use of a quantum confinement model.'8 There, it was proposed that, our samples consist of small a-Si clusters in a matrix of a-SiNx:H. The regions with Si-H and Si-N, having larger energy gaps due to strong Si-H and Si-N bonds. isolate these a-Si clusters, and form barrier regions around them. The PL originates from the a-Si clusters.2. EXPERIMENTAL ARRANGEMENT
2.1. Hydrogenated amorphous silicon nitride (a-SiNx:H) growth without NH3
In the samples grown without NH, the microcavity was realized by a Au back mirror and an a-SiNx:H-air interface
front mirror. First, the thin glass substrates were coated with 100 tim of Au. Second, a thin layer of a-SiNx:H was
deposited on the Au coated substrates by PECVD. The flow rate of the PECVD gas [2% silane (SiH)in nitrogen (N2)J was 180 sccm, the radio frequency power 10 W, and the deposition chamber pressure 1 Torr. The metric thickness (L) ofthe a-SiNx:H layer grown without NH was measured to be 1400 100am.
2.2. Hydrogenated amorphous silicon nitride (a-SiNx:H) growth with NH3
In the samples grown with NH, the microcavity was realized by an Al back mirror and an a-SiNx:H-air interface front mirror or a a-SiNx:H-Al partially transmitting front mirror. First. the thin Si or quartz substrates were coated with 100 nm of Al. Second, a thin layer of a-SiNx:H was deposited on the Al coated substrates by PECVD. The flow rates of the PECVD gases were 180 sccm for 2% SilL, in N2 and 10 sccm for NFI, the radio frequency power 10 W, and the deposition chamber pressure I Torr. The metric thickness (L) of the a-SiNx:H layer grown with NH3 was measured to be 1000 100 nun. Finally, the samples were annealed in a forming gas atmosphere at 600°C for 10 miii. For the Al partially transmitting front metallic mirror microcavities, a thin (-I0 ,iin) layer of Al was deposited on the annealed samples.
2.3.
Roomtemperature reflectance, transmittance, and photoluminescence measurements of a-SiNx:HThe room temperature reflectance and transmittance measurements were made at 0° with respect to the surface
normal with a resolution of 2 mu. The room temperature PL spectra were measured with a resolution of 0. 1 nni. The PL spectra were later corrected for the responsivity of the spectrometer and the photomultiplier tube. An Ar laser with a wavelength of514.5 am (457.9 nm) and a power of420 iiiW was focused with a 15 cm focal length cylindrical lens on the samples grown without (with) NH. The PL spectra were taken at 0±3 .6° with the laser at 30° with respect to the surface normal. During the PL measurements the temperature of the sample is not controlled and there might be local heating due to the poor thermal conductivity of the glass substrate. Local heating reduces the PL efficiency and broadens the PL linewidth.'9 However, the local heating would not considerably affect the general shape and features of the gain spectrum. As will be seen in the PL spectra, even though there might be local heating, we are observing strong PL from the samples and the PL is enhanced by the Fabry-Perot resonances.
3. EXPERIMENTAL RESULTS AND DISCUSSION
3.1. Hydrogenated amorphous silicon nitride (a-SiNx:H) grown without NH3
3.1 .1 .Transmittance,reflectance, and absorbance spectra of the a-SiNx:H grown without NH3
Figures 1, 2, and 3 show the measured and calculated transmittance, reflectance, and absorbance spectra of the a SiNx:H grown without NH, respectively. The absorbance spectrum is obtained by subtracting both the reflectance and transmittance spectra from unity, i.e., 100%. In the calculations, the total transmitted and the reflected electric fields for each wavelength were obtained using an absorbing Fabry-Perot iuicrocavily model. In this model, we assumed the sample to be a one dimensional absorbing dielectric slab on a glass substrate. The experimentally measured absorbance spectrum was obtained by subtracting both the experimentally measured transmittance and the reflectance spectra from 100%. This experimentally measured absorbance spectrum was then incorporated to the calculations of the transmitted and reflected electric fields. The calculated transmittance and reflectance at each wavelength were obtained from their respective electric
fields. The calculated transmittance and reflectance intensity was subtracted from 100% to obtain the calculated
absorbance intensity as a final check.
0
400
500600 700
800 900wavelength
(nm)Fig.3. Experimental and calculated absorbance spectrum of
a-SiNx:H grown without NH3.
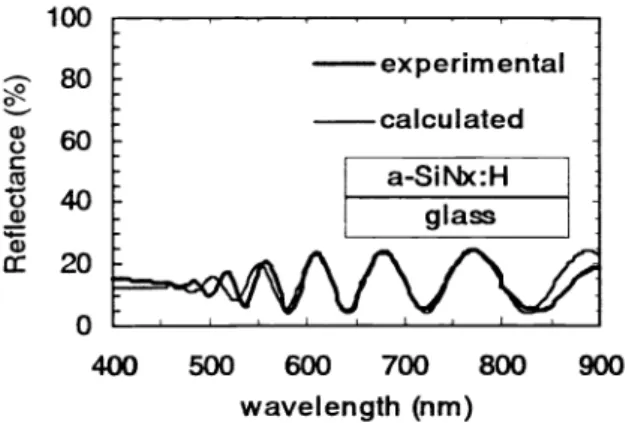
The theoretical fit to the experimental spectra is
extremely good. The metric thickness of the a-SiNx:H is
found to be L 1376 urn (which agrees well with the experimental thickness of 1400
100 nm) and the
refractive index n =2.1 . Both the transmittance and thereflectance spectra show Fabry-Perot resonances at
wavelengths satisfying the condition (X 2Ln/m, where m is the quantized mode number). The mode number of these resonances were found to range from in 1 1 (2 545tim)to 111 =7(2.7 =835tim). The resonances have linewidths of
=35nm and quality factors of Q =20.Below 600 tim,
the resonances start to wash out by the absorption of the
a-SiNx:H. The loading of the resonances by the a-SiNx:H
absorption stops above 600 tim.
a)
0
C E Cl) C I— 10080
60
40
20
0
p:erintal
calculated -SiNx:Ha1
Cl)0
C a)0
a) a) 100 80 60 40 20 0— experimental
—calculated
a-SiNx:Hglass
400 500 600700
800 900 400 500 600 700800
900wavelength
(nm) wavelength (nm)Fig. 1 . Experimentaland theoretical tramismnittance spectra of
the a-SiNx:H grown without NH3.
100 a)
0
C a)0
Cl)0
Fig. 2. Experimental and theoretical reflectance spectra of the
a-SiNx:H grown without NH3.
80
60
40 20 experimental— calculated
a-SiNx:Hr-
glass3.1.2. Photoluminescence spectra of the a-SiNx:H grown without NH3
Figure 4 shows the PL of the a-SINx:H grown without NH, whose transmittance, reflectance, and absorbance spectra were shown in Figs. 1, 2, and 3. The PL intensily is modulated by the weak Fabry-Perot resonances, which correlate well with the maxima of the transmittance spectrum of Fig. 1 ,andthe minima of the reflectance spectnim of Fig. 2. The red-near-infrared PL has a broad linewidth (240 nm). This broad linewidth of the a-SiNx:H shows that, a-SiNx:H has potential as a novel photonic gain medium. Figure 5 depicts the PL of the a-SiNx:H microcavity with the Au back mirror. The Fabry-Perot resonances have experimental and theoretical linewidths of AX =25 urn and quality factors of Q= 30.The metric thickness of the a-SiNx:H microcavity with the Au mirror was found to be L =1438mu (which agrees well with the experimental thickness of 1400 100 urn) and the refractive index ii =2.1. The PL is modulated by the strong Fabry-Perot resonances. The mode number of these resonances were found to range from in =11 = 558 tim)to m =7
(
= 874 iiiii). 10000 20000:
8000:
16000 6000 12000 >.>
.
4000.
8000o
2000 4000 520 600 680 520 600 680 760 840 wavelength(nm) wavelength (nm)Fig.4.PL spectrum ofthe a-SiNx:H groii without NH. Fig.5. PL ofthe a-SiNx:H grown with NH3with the Au mirror.
The two PL spectra of Figs. 4 and 5wereobtained under the same experimental conditions. When comparing the spectra iii Figs. 4 and 5,thePL of the inicrocavity with the Au mirror has 3 noteworthy features with respect to the PL of the a-SiNx:H : (1) there is a 2X increase of the overall spectnim average (i.e., averaging out the Fabry-Perot resonances), (2) there is a 4X enhancement of the PL peaks, and (3) the PL dips have similar amplitude. These 3 features are noticed with respect to the PL of the a-SiNx:H. The 2X increase is due to the "round trip" of the excitation Ar laser in the Fabry Perot cavity due to the back Au mirror. Since the wavelength of the Ar laser is non-resonant, the input laser light does not resonate in the cavity, which would have enhanced the PL further. The 4X enhancement at the resonances, are clearly due to the combined effect of the enhancement of the PL by the cavity resonances with that of the input laser reflecting from the back Au mirror. The PL dips having the same amplitude in both spectra is due to the inhibition of the PL in between the resonances.
3.2.Hydrogenatedamorphous silicon nitride (a-SiNx:H) grown with NH3
3.2.1.Transmittance,reflectance, and absorbance spectra ofthe a-SiNx:H grown with NH3
Figures 6, 7, and 8 show the measured and calculated transmittance, reflectance, and absorbance spectra of the a-SiNx:H grown with NH3, respectively. The absorbance spectnun is obtained by subtracting both the reflectance and transmittance spectra from unity, i.e. , 100%. In the calculations, the total transmitted and the reflected electric fields for each wavelength were obtained using an absorbing Fabry-Perot tuicrocavity model. In this niodel, we assumed the sample to be a one dimensional absorbing dielectric slab on a quartz substrate. The experimentally measured absorbance spectrum was obtained by subtracting both the experimentally measured transmittance amid the reflectance spectra from 100%. This experimnentally measured absorbance spectnmni was then incorporated to the calculations of the transmitted amid reflected electric fields. The calculated transmittance and reflectance at each wavelength were obtained from their respective electric
fields. The calculated transmittance and reflectance intensity was subtracted from 100% to obtain the calculated
absorbaiice intensity as a fiuial check.
255
90 ci)
0
C cci!
::
50 450 500 550 600 650 700 750 800 850 900 wavelength(nm)Fig. 6. Experimental and theoretical transmittance spectra of the a-SiNx:H grown with NH3.
10
9
0
450 500 550 600 650 700 750 800 850 900 wavelength (nm)
Fig. 8. Experimental and calculated absorbance spectntrn of a-SiNx:H grown with NH3.
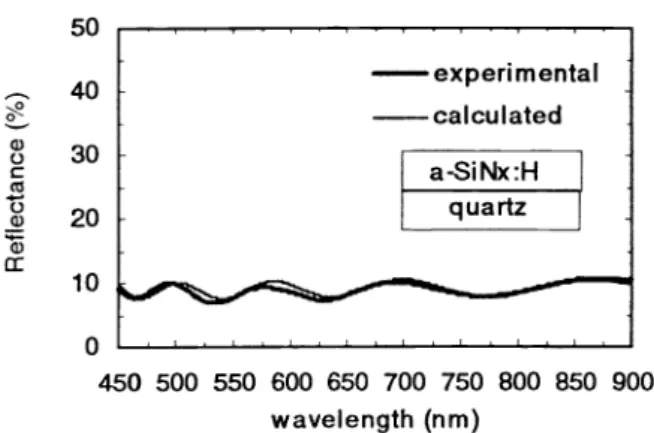
Fig. 7. Experimentally measured and theoretically calculated
reflectance spectra of the a-SiNx:H growim with NH3.
The theoretical fit to the experimental spectra is
extreimmely good. The metric thickness of the a-SiNx:H grown with NH3 is found to be L 963 mu (which agrees well with the experimental thickness of 1000 100 nm) and the refractive index ii i .6. Both the transmittance and
the reflectance spectra show Fabry-Perot resonances at
wavelengths satisfying the condition (? 2Ln/mn, where m is the quantized mode number). The mode number of these
resonances were found to range from m 7 (? =461 nm)
to in 4
=760urn). The resonances have linewidths of= 40urn and quality factors of Q 10.Compared with
the absorption of the a-SiNx:H grown without NH, the
absorption of the a-SiNx:H grown with NH3 is an order of magnitude lower. Consequently, there is no loading of the resonances by the absorption.
3.2.2. Photoluminescence spectra of the a-SiNx:H grown with NH3
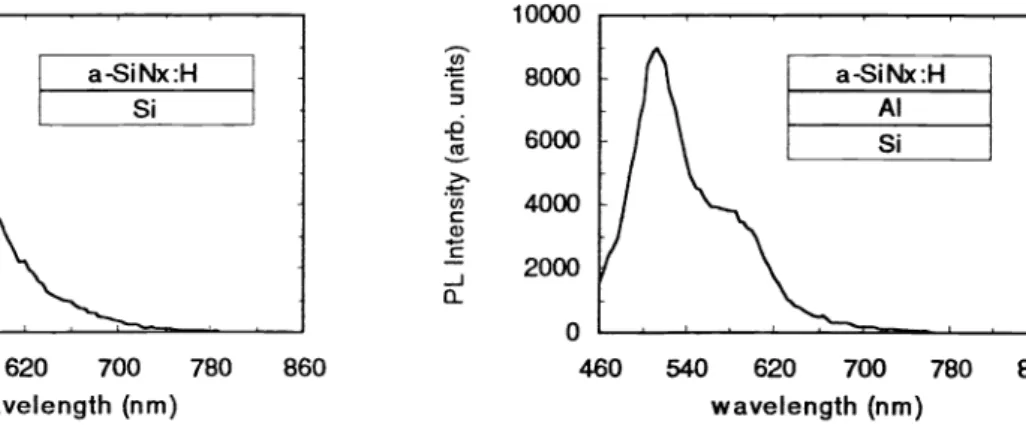
Figure 9 shows the PL of the a-SiNx:H grown with NH3 on Si together with the samples grown on quartz, whose transmittance, reflectance, and absorbance spectra were shown in Figs. 6, 7, and 8. The samples grown on quartz are used for transmittance, and reflectance measurements. The samples grown on Si are used for PL measurements, since Al sticks better to Si when compared with quartz. The PL intensity in Fig. 9 is modulated by the weak Fabry-Perot resonances. The mode number of these resonances were found to range from imi 7 (X 488 nnm) to am 6 0-6 572 mu). The PL is inhibited in between these two resonances at in 6.5 (?6 524urn).The blue-green PL has also a broad hinewidth (100
nm). This broad liiiewidth of the a-SiNx:H grown with NH3 again shows that, a-SiNx:H has potential as a novel photonic gain medium. The Fabry-Perot resonances have experimental and theoretical linewidths of &. 40urn and quality factors of Q 10.The metric thickness of the a-SiNx:H grown on Si was found to be L 1 103 urn (which agrees well with the
experimental thickness of 1000 100 nni) and the refractive index ii i .6.
Figure 10 depicts the PL of the a-SiNx:H niicrocavity with the Al back mirror. Al is chosen instead of Au because of its high reflectance in the blue-green part of the optical spectrum. The Fabry-Perot resonances have experimental and theoretical linewidths of A. =60urn amid quality factors of Q = 8. The metric thickness of the a-SiNx:H microcavity with
the Al mirror was found to be L =929nm (which agrees well with the experimental thickness of 1000 100 nm) and the refractive index ii =
i
.6. The PL is modulated by the strong Fabry-Perot resonances. The mode nuniber of these resonances were found to range from in =6(6 =
515 iiiim) to in =5 (?. = 603imimi).100
Trintai
—calculated
a-SiNx:H quartz cim 0 C cci 0 ci) ci) a: 50 40 30 20 10 0 — experimental — calculated a-SiNx:H quartz 450 500 550 600 650 700 750 800 850 900 wavelength(nm)The two PL spectra of Figs. 9 and 10 were obtained under the saiue experiiiiental conditions. When comparing the spectra in Figs. 9 and 10, the PL of the microcavity with the Al mirror has 3 noteworthy features with respect to the PL of the a-SiNx:H: (1) there is a I .3Xincrease of the overall spectnim average (i.e., averaging out the Fabry-Perot resonances), (2) there is a 2X enhancement of the PL peaks, and (3) the PL dips have similar amplitude. These 3 features are noticed with respect to the PL of the a-SiNx:H. The 1.3X increase is due to the "round trip" of the excitation Ar laser in the Fabry Perot cavity due to the presence of the back Al mirror instead of a Si substrate, which only partially reflects the incident beam. Since the wavelength of the Ar laser is non-resonant, the input laser light does not resonate in the cavity, which would have enhanced the PL further. The 2X enhancement at the resonances, are clearly due to the combined effect of the enhancement of the PL by the cavity resonances with that of the input laser reflecting from the back Al mirror. The PL dips having the same amplitude in both spectra is due to the inhibition of the PL in between the resonances.
Figure 1 1 shows the PL of the a-SiNx:H grown with NH3 (same as Fig. 9) divided by 15, in order to have the same spectral average for both Figs. 1 1 and 12. Figure 12 depicts the PL of the a-SiNx:H microcavity with the Al back and Al front partial mirror. The Fabry-Perot resonances have experimental and theoretical linewidths of &. = 20nm and quality factors of Q= 25. Themetric thickness of the a-SiNx:H niicrocavity with the Al back and Al front partial mirror was found to be L 1072 urn (which agrees well with the experimental thickness of 1000 100 urn) and the refractive index n
=
1.6.The PL is modulated by the strong Fabry-Perot resonances. The mode number of these resonances were found to range from m =7 (2
=
488nm) to m =5 (A. = 687mu).257 5000 10000 .
.;;-SiNx:1[1
: 4000
E 8000 _____________ Al 3000:1
6000.
2000.
4000 C) C) 1000 2000 Q_ Li 0 0 460 540 620 700 780 860460 540
620 700 780 860 wavelength(nm) wavelength (nm)Fig.9. PL spectrum of the a-SiNx:H grown with NH. Fig.10. PL spectrum of the a-SiNx:H grown with NH3 with the Al back mirror. C,) C £ CC >. (1) C ci) C -J Li 375 250 125 0 a-Si Nx :H Si (I) C) >. U) ci) C -J Li 750 500 250 0
Fig. 1 1 . PL spectrum of the a-SiNx:H grown with
NH3 dividedby15. 460 540 620 700 780 860 wavelength(nm) 460 540 620 wavelength 700 780 860 (nm)
Fig. 12. PL spectrum of the a-SiNx:H grown with NH3 with the Al back and front mirrors.
The PL spectra of Fig. 1 2 was obtained under the same experimental conditions as of Fig. 1 1 .Whencomparing the spectra in Figs. 1 1 and 12, the PL of the niicrocavity with the Al back and front partial mirror has 3 noteworthy features with respect to the PL of the a-SiNx:H: (1) the overall spectral averages are the same (i.e., averaging out the Fabry-Perot resonances), (2) there is a 2X enhancement of the PL peaks, and (3) the PL dips have similar amplitude. These 3 features are noticed with respect to the PL of the a-SiNx:H. The 2X enhancement at the resonances, while the overall average being the same, are clearly due to the enhancement of the PL by the cavity resonances. The PL dips having the same amplitude in both spectra is due to the inhibition of the PL in between the resonances.
4. CONCLUSIONS
Iii conclusion, Fabry-Perot microcavities with dielectric and metallic mirrors are used for the alteration of
photoluininescence in a-SiNx:H grown with and without NH. The photoluminescence of the bulk a-SiNx:H is in the red-near-infrared part of the optical spectrum for the samples grown without NH. However, the photoluminescence of the bulk a-SiNx:H is in the blue-green part of the optical spectntm for the samples grown with NH. These complementary colors cover the whole visible spectntm, and one can imagine a color flat panel display made out of a-SiNx:H pixels. The broad photolurninescence spectntm of the a-SiNx:H. also makes it a suitable source for WDM applications.
The photoluminescence of the bulk a-SiNx:H is enhanced at, and inhibited in between, the Fabry-Perot resonances of the microcavity. The eiihancernent and inhibition of the photoluminescence is understood by the modified photon density of states of the rnicrocavity. The linewidth of the photoluminescence is also narrowed with respect to the linewidth of the bulk a-SiNx:H, again due to the presence of the electromagnetic modes of the microcavity. The Fabry-Perot enhancement and inhibition of luminescence in a-SiNx:H opens tip a variety of possibilities for optoelectronic applications such as color flat panel displays, resonant cavity enhanced (RCE) light emitting diodes (LED's). or microlasers.
5. ACKNOWLEDGMENTS
We would like to thank Murat Gure of Bilkent University, Physics Department for his help with the growth of the samples. We would also like to thank Prof. Richard K. Chang of Yale University, Applied Physics Department for many helpful discussions and reading of the manuscript. We would like to acknowledge the partial support of this research by the Scientific and Technical Research Council of Turkey (TIJTBITAK) Grant No: TBAG-1 368 and the International Center for Theoretical Physics (ICTP) Grant No: 95-50() RG/PHYS/AS.
6. REFERENCES
1. A. M. Agarwal, L. Liao, J. S. Foresi, M. R. Black, X. Duaii. and L.C. Kimerling, "Low-loss Polycrystalline Silicon Waveguides for Silicon Photonics," J. App!. Phys. 80, 6120 (1996).
2. D. J. Lockwood, "Optical Properties of Porous Silicon," So!id State Coininun. 92, 101 (1994).
3. T. Canhain, "Silicon QuantunI Wire Array Fabrication by Electrochemical and Chemical Dissolution of Wafers," App! Phys. Lett. 57, 1046 (1990).
4. R. K. Chang and A. J. Campillo, Eds., Optica! Processes in Auicrocavities (World Scientific ,Singapore, 1996).
5. E. M. Purcell, "SpontaneousEmission Probabilities at Radio Frequencies, 'Phys.Rev. 69, 681 (1946).
6. F. De Martini, G. Innocenti, G. R. Jacobowitz, and P. Mataloni, "Anomalous Spontaneous Emission Time in a Microscopic Optical Cavity," P/iys. Rev. Lett. 59, 2955 (1987).
7. H. Yokoyama, S. D. Brorson, "Rate Equation Analysis ofMicrocavity Lasers," J. App!. Phys. 66, 4801 (1989). 8. M. S. Unlii and S. Strite, "Resonant Cavity Enhanced Photonic Devices," J. App!. Phys. 78, 607 (1995).
9. H. Yokoyaina, K. Nishi, T. Anait, H. Yamada, S. D. Brorsoii, and E. P. Ippen, "Enhanced Spontaneous Emission from GaAs quantum Wells in Monolithic Microcavities," App!. Phys. Lett. 57, 28 14 (1990).
10. S. L. McCall, A. F. J. Levi, R. E. Slusher, S. J. Pearton, and R. A. Logan, "Whispering Gallery Mode Microdisk Lasers," App!. Phys. Lett. 60, 289 (1992).
11. J. P. Zhang, D. Y. Chu, S. L. Wu, S. T. Ho, W. G. Bi, C. W. Tn, and R. C. Tiberio, "Photonic WireLaser," Phys. Rev. Lett. 75, 2678 (1995).
12. E. F. Schubert, Y.-H. Wang, A. Y. Cho. 1. W. Tu, and G. J. Zydzik, "Resonant Cavity Light Emitting Diode," Appi. Phys. Lett. 60, 921 (1992).
13. L. Pavesi, R. Guardini, and C. Mazolleni. "Porous Silicon Resonant Cavity Light Emitting Diodes," Solid State Cominun. 97, 1051 (1996).
14. B. T. Sullivan, D. J. Lockwood, H. J. Labbe, and Z.-H. Lu, 'Photoluminescence in Amorphous Si/SiOx
Superlattices Fabricated by Magnetron Sputtering," Appi. Phys. Lett. 69 3 149 (1996).
15. F. N. Tiinofeev, A. Aydinli, R. Ellialtioglu, K. Turkoglu, M. Gure, V. N. Mikhailov, and 0. A. Lavrova, "Visible Photolurninescence from SiOx Films Grown by Low Temperature Plasma Enhanced Chemical Vapor Deposition," Solid State (ommun.95,443 (1995).
16. A. Serpenguzel, A. Aydinli, and A. Bek, "Enhancement and inhibition of photolurninescence in hydrogenated amorphous Silicon nitride microcavities, "Optics Expre.s 1, 108 (1997).
17. A. Aydinli, A. Serpenguzel, and D. Vardar, "Visible Photoluininescence from Low Temperature Deposited
Hydrogenated Amorphous Silicon Nitride," &ilid State ('o,n,nun.98,273 (1996).
18. M. H. Brodsky, "Quantum Well Model of the Hydrogenated Amorphous Silicon," Solid State C'onzmun. 36,55
(1980).
19. R. Fisher, in Amorphous Semiconductors, M. H. Brodsky, ed. (Springer-Verlag, Berlin, 1985). pp. 159-187.