ÇANKAYA UNIVERSITY
THE GRADUATE SCHOOL OF SOCIAL SCIENCES ECONOMICS AND ADMINISTRATIVE SCIENCES
MASTER THESIS
A Time-Cost Tradeoff Analysis of a Construction Project in Baghdad City using Project Management Techniques
Ibrahem ABD
IV ABSTRACT
A Time-Cost Tradeoff Analysis of a Construction Project in Baghdad City using Project Management Techniques
Ibrahem ABD
M.B.A, Master of Business Administration Supervisor: Dr. Instructor Şule TARIM
July 2018, 84 pages
One of the most remarkable challenges facing the project management at present, that is ensuring the completion of the project in spite of being subject to specific constraints, including time limitations and other financial resources allocated to the project, so this requires accurate calculation of the time and cost. The project of building the Muslim bin Aqeel school in AL-Taji area is one of the huge projects that the ministry of Sunni Endowment seeks to accomplish in Baghdad province. This project was chosen as a project in which the work is delayed, which led to delay in its completion at the scheduled time. On this basis, the project was studied again according to scientific and mathematical methods to create a model that finds a suitable tradeoff between time and cost to accelerate the accomplishment process, by using one of the methods of scheduling and management of the project which is the critical path method CPM, To plan the project, determine the relationships of activities, calculate the slack and critical times to determine the longest duration and the cost required to complete the project. The problem of time-cost tradeoff TCTP and the discrete time-cost tradeoff problem DTCTP, are modeled, using the mixed integer programming model, then by converting the model into an optimization
V
programming language OPL model. Here, IBM ILOG CPLEX Optimization Studio is used to find the optimal to the problem. The results showed that it is possible to reduce the delivery time by 19.29% less than the expected time by increasing the total cost by 5.77%.
Key Words: project management, CPM, Discrete time-cost tradeoff DTCT, Mixed integer programming, OPL.
VI ÖZET
BAĞDAT'TAKİ BİR İNŞAAT PROJESİNİN PROJE YÖNETİM TEKNİKLERİ KULLANILARAK MALİYET-ZAMAN ÖDÜNLEŞMESİ
ANALİZİ Ibrahem ABD
İşletme Anabilim Dalı Yüksek Lisansı Tez Danışmanı: Dr. Öğr. Üyesi Şule TARIM
Temmuz 2018, 84 sayfa
Proje yönetiminin şu anda karşı karşıya olduğu en önemli zorluklardan biri, projeye ayrılan zaman kısıtlamaları ve diğer finansal kaynaklar da dahil olmak üzere belirli kısıtlamalara tabi olmakla birlikte projenin tamamlanmasını sağlamaktır. Bu da zamanın ve maliyetin doğru hesaplanmasını gerektirir. AL-Taji bölgesindeki Muslim bin Aqeel okulunu inşa etme projesi, Sünni Vakıflar Bakanlığı'nın Bağdat'ta gerçekleştirmeyi amaçladığı dev projelerden biridir. Bu proje, çalışmanın ertelendiği bir proje olarak seçilmiştir ve bu da planlanan zamanda tamamlanmasını geciktirmiştir. Temelde bu proje, bilimsel ve matematiksel yöntemlere göre, başarı sürecini hızlandırmak için zaman ve maliyet arasında uygun bir taktik oluşturan, kritik olan projenin planlama ve yönetim yöntemlerinden biri olan CPM metodunu kullanarak yeniden çalışılmıştır. Bu metod projeyi planlamak, aktivitelerin ilişkilerini belirlemek, projenin tamamlanması için gereken en uzun süreyi ve maliyeti belirlemeyi duruş ve kritik zamanları hesaplamada kullanılır. Zaman-maliyet değişim TCTP ve ayrık zaman-maliyet değişim problemi DTCTP problemi, karma tamsayı programlama modeli kullanılarak modellenmiştir, daha sonra model bir optimizasyon programlama dili olan OPL modeline dönüştürülmüştür. Burada, IBM ILOG CPLEX Optimizasyon Stüdyosu, problem için en uygun olanı bulmak için kullanılmıştır.
VII
Sonuçlar, toplam maliyeti% 5,77 oranında artırarak, teslim süresinin beklenen süreden% 19.29 daha az düşürülmesinin mümkün olduğunu göstermiştir.
Anahtar Kelimeler: Proje Yönetimi, CPM, Ayrık Zamanlı Maliyet Değişimi DTCT, Karma Tamsayılı Programlama, OPL.
VIII
ACKNOWLEDGMENT
I would like to acknowledge and thank my supervisor Dr. Instructor. Şule TARIM and my co-supervisor Prof. Dr. Ş. Armağan TARIM, for all of their supportiveness throughout the duration of this thesis. A lot of thanks to my family for their support and being patient during my master study. Finally many thanks to all of my friends and mates "especially my Cousin Musaab" for encouraging me.
IX TABLE OF CONTENT ABSTRACT ... IV ÖZET ... VI ACKNOWLEDGMENT ... VIII LIST OF FIGURES ... IV LIST OF TABLES ... V LIST OF ABBREVIATIONS ... VI CHAPTER I ... 1 INTRODUCTION ... 1
1.1 The Historical Development of Project Management. ... 1
1.2 The Project Concepts. ... 3
1.3 The Main Objectives of the Project. ... 4
1.4 Project Characteristics. ... 5
1.5 Project Life Cycle. ... 7
CHAPTER II ... 10
METHODOLOGY OF SCIENTIFIC RESEARCH ... 10
2.1 Problem Description. ... 10
2.2 Aim of Study. ... 11
2.3 The Importance of This Study. ... 12
2.4 Project and Research Sample. ... 13
2.5 Methods Used in finding Results. ... 13
2.6 Sources and Methods of Data Collection. ... 14
2.6.1 Preliminary Sources: ... 14 2.6.2 Secondary Sources: ... 14 2.7 Previous Studies. ... 15 2.7.1 (Hafeezah: 2014). ... 15 2.7.2 (Abdul Majid: 2012). ... 15 2.7.3 (Shaaban: 2009). ... 16
X
2.7.4 (Tamrakar: 2013). ... 17
2.7.5 (Kelleher: 2004). ... 17
CHAPTER III ... 19
SCHEDULING AND BUSINESS NETWORKS IN PROJECT MANAGEMENT ... 19
3.1 Schedule of the Project. ... 19
3.1.1 The Concept of the Scheduling Process in the Project: ... 19
3.1.2 Project Scheduling Stages... 21
3.1.2.1 Planning Stage. ... 21
3.1.2.2 Scheduling the Activities Stage. ... 21
3.1.2.3 Control Stage. ... 21
3.2 Project Networks. ... 22
3.2.1 Time Charts. ... 22
3.2.2 Network Planning. ... 23
3.2.3 Key Networks Elements. ... 23
3.2.4 Logical Relationships Between Activities in the Network Diagram. ... 26
3.2.5 Formulas and Design Forms of Business Networks. ... 28
3.2.6 Advantages of Network Scheduling Schemes. ... 30
3.3 The Difference between the PERT and the Critical Path Method CPM. ... 31
3.4 Network Calculations. ... 32
CHAPTER IV ... 42
MATHEMATICAL PROGRAMMING AND IBM-CPLEX ... 42
4.1 First Axis: Mathematical Programming M.P. ... 43
4.1.1 Linear Programming L .P. ... 43
4.1.1.1 Linear Programming Model Requirements. ... 45
4.1.1.2 Formulation or Construction of a Linear Programming Model. ... 45
4.1.2 Integer Programming I.P. ... 47
4.1.2.1 Integer Programming Types. ... 48
4.1.3 Modeling of Project Crashing Problems. ... 50
4.2 Second Axis: The Applications of Computer Science for Quantitative Methods. ... 51
4.2.1 IBM ILOG CPLEX Optimization Studio. ... 52
4.2.1.1 Integrated Development Environment (IDE). ... 53
XI
4.2.1.3 OPL Projects in IBM ILOG Optimization Studio. ... 54
CHAPTER V ... 58
IMPLEMENTATION ... 58
5.1 First Axis: Proposed CPM Network for School Project. ... 61
5.2 Second Axis: Implementation and Results. ... 67
CHAPTER VI ... 69
CONCLUSION ... 69
CHAPTER VII ... Hata! Yer işareti tanımlanmamış. REFERENCES ... 71
APPENDIX A ... 77
IV
LIST OF FIGURES
Figure 1: For Each Activity Has a Start and Finish. ... 25
Figure 2: The End Event for the Previous Activity is the Start Event for Subsequent Activities. ... 25
Figure 3: Intersection of Activities (Unwanted Status) ... 25
Figure 4: Return Activity From a Subsequent Event to a Previous Event (Wrong Case) ... 26
Figure 5: Design of Arrows-Based Work Networks (AOA). ... 29
Figure 6: Design of Networks on the Basis of Node (AON). ... 30
Figure 7: the Forward Path to Calculate the Early Times ... 33
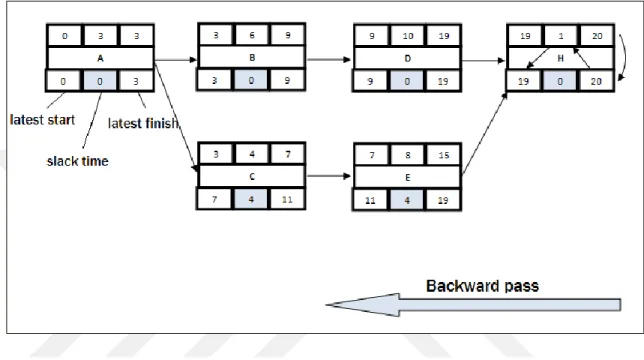
Figure 8: the Backward Path to Calculate the Late Times. ... 34
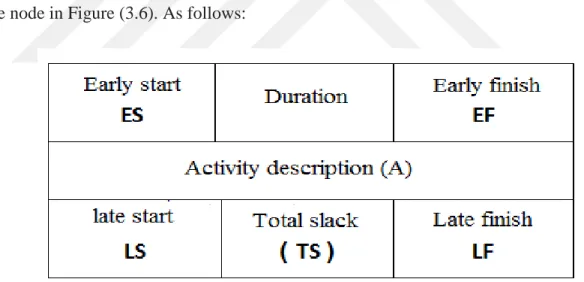
Figure 9: The Data that Installs in the Activity Node. ... 37
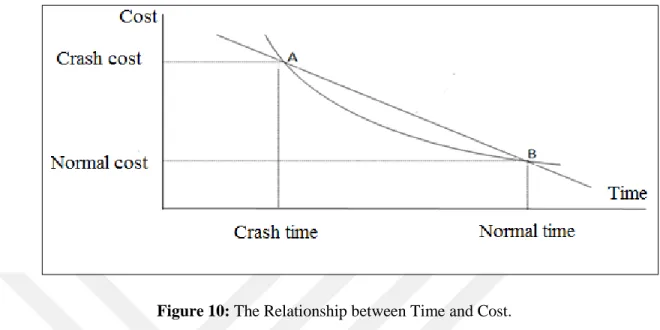
Figure 10: The Relationship Between Time and Cost. ... 40
Figure 11: IBM ILOG Optimization Studio IDE. ... 53
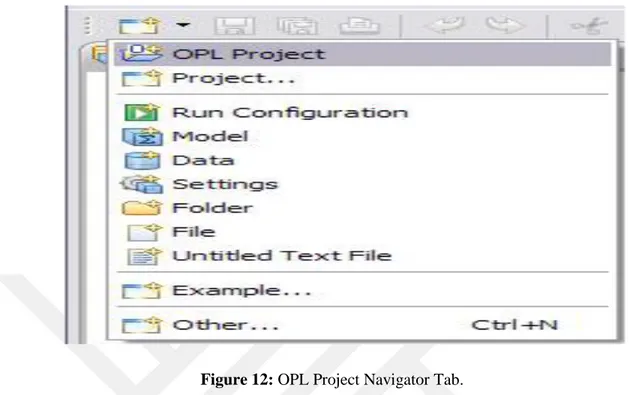
Figure 12: OPL Project Navigator Tab. ... 55
Figure 13: Project Network for the School Project ... 63
V
LIST OF TABLES
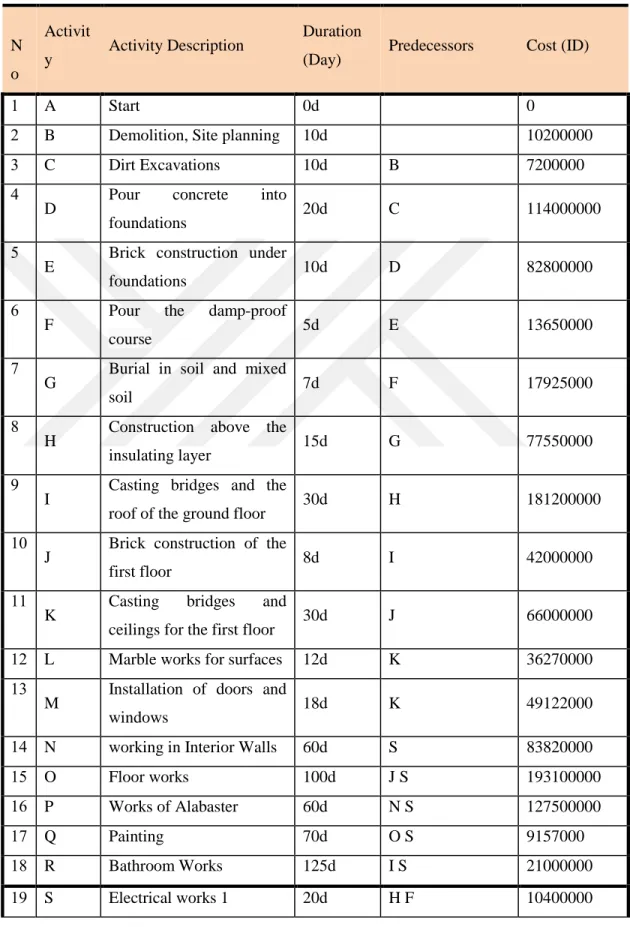
Table 1: List of Activities for the School Project. ... 62 Table 2: Computation of Critical Path Method for School Project Activities. ... 64 Table 3: The Paths for the Network Plan According to the Normal Times of the
School Project. ... 65 Table 4: Cost-Time Slope of the Activities. ... 66 Table 5: Optimization Results for (DTCTP) for School Construction Project. ... 68
VI
LIST OF ABBREVIATIONS
CPM Critical Path Method.
PERT Program Evaluation and Review Technique. PMI Project Management Institute.
PMBOK Project Management Body of Knowledge. FF Finish to Finish.
FS Finish to Start. SS Start to Start. SF Start to Finish. AOA Activity on Arrow. AON Activity on Node. ES Early Start Time. EF Early Finish Time. LS Late Start Time. LF Late Finish Time. ST, FT Slack Time, Float Time. NC Normal Cost. CC Crash Cost. NT Normal Time. CT Crash Time. MP Mathematical Programming. LP Linear Programming.
VII MIP Mixed Integer Programming.
SCOOP Scientific Computation of Optimum Programs. IP Integer Programming.
TCTP Time-Cost Tradeoff Problem.
DTCTP Discrete Time-Cost Tradeoff Problems. MIS Management Information Systems. IDE Integrated Development Environment. OPL Optimization Programming Language.
1 CHAPTER I
INTRODUCTION
Construction projects are important tasks that can not be dispensed to any country or society and can be one of the basic industries that support the national economy of each country. The construction industry affects all forms of daily life and has an active role in securing production plants, airports and transport routes. Including housing, hospitals, schools, roads, and bridges used by all members of the community.
1.1 The Historical Development of Project Management.
In theory, project management has emerged since the emergence of human civilizations such as Babylonian civilization, Egyptian, Roman, Persian, Chinese, etc. The most important feature of project management in these civilizations is that they had completed huge projects, such as Pyramids, Great Wall of China, etc. However, these projects were completed without clear resource and time constraints, as they did not provide us with documentation that would enable us to understand how to work (Al-Fadl & Al-Obaidi, 2010, p.24). Therefore, project management is not a new concept for organizations and managers, but ideas and concepts have been highlighted through effective management and have undergone many modifications and improvements (Stelth, 2009, p.11).
In 1917, the scientist Henry Gantt introduced a resource scheduling scheme, one of the oldest scheduling methods known in his name as the (Gantt Chart), it is a table interrupt time with the appropriate resources to complete the project (Schroeder, 2007, p.285). The chart was developed to allow project managers and supervisors to determine the scheduling of each worker's work and then to review and evaluate the actual production. The Gantt chart represents a visual means of showing progress. In the first half of the
2
20th century, Gantt Chart was the dominant Technique for planning and scheduling projects and for all small, large and medium sizes (Bordoli & Baldwin, 2014, p.3)
After the Second World War and with the emergence of large and complex projects, there was an urgent need to innovate a new method of planning characterized by providing an integrated picture of the project activities, and indicating the relationships of succession and precedence between the project activities as well as overlap between them (Dawood & Others, 2012, p.200). Especially with the need of industrialized countries to implement mega projects (infrastructure projects), which represents the time the basic constraint, and therefore active many researchers in finding methods of high efficiency based on the quantitative basis, and these researchers two teams of advisers in the United States and the third teamwork in the United Kingdom.
In the United States a team of consultants in cooperation with (Du Pont) Company for Chemical Industries, had developed a planning and maintenance management technique at (Du Pont) from December 1954 to February 1959, This team had developed a method for Planning and Scheduling called the Critical Path (CPM), which was used to reduce the maintenance time in (Du Pont) to a minimum. The other team had worked from 1954 until 1958 in cooperation between the US Navy with the (Lock head) company in the project design and development of a rockets Polaris, where they developed a new method called Program Evaluation and Review Technique (PERT). The third team worked in the United Kingdom in 1957 in the Operations Research Department of the Central Electricity Authority and developed a method known as (The Longest Irreducible Sequence of Events), which was later known as the Major Sequence. The application of this method resulted in good results from 1958 to 1960, and the early successes of these techniques led to their widespread adoption in project management and planning (Bosnina, 2011, p.36).
In 1969, Project Management Institute was established to serve the interests of the project management field. In 1981, the Board of Directors of the Institute announced the implementation of this document which became the (PMBOK). It includes the accepted standards and principles Guidelines for all practitioners.
3
So, by reading the scientific literature we can say that the oldest document available in project management field is the Gantt chart where this man (Henry Gant) the prominent role in the invention of the first methods of planning and control of projects through the method (Gannt Bar), which is used up untıl now.
The historical development of project management can be summarized into three phases: 1. The pre - fifties: characterized by the lack of knowledge for the management of
projects except for Gantt scheme.
2. The fifties and pre - nineties: It is characterized by the innovation and use of quantitative methods CPM & PERT.
3. The post-1990s: This phase is characterized by the use of technology, information technology and knowledge management, and the emergence of specialized institutions and organizations in project management, like (PMI) the American Project Management Institute, and (APM) the British Project Management Authority, as well as several ready-made programs that help to manage the projects according to modern and scientific techniques.
1.2 The Project Concepts.
The project includes a set of interrelated, time-bound, cost-driven work activities that lead to the achievement of the organization's strategic objectives using its assets (Anderson et.al, 2007, p.3), It is expressed as a useful or useful change that uses project management techniques to plan and monitor the work so that a product can be delivered to satisfy the needs and expectations of the customer and the owner (Bruke, 2009, p.3), according to the current study, we confirm that the definition of a construction project (is the kind of project that usually starts with an architectural idea for a purpose and is developed to meet the required purpose. The operational maps are then prepared and implemented across multiple stages) (Bosnina, 2011, p.35).
Regardless of the type of construction, all construction projects have a common denominator,The project must be planned, designed and executed according to specific technical specifications, within a specified budget and a predetermined period of time
4
(Sumaidai, 2002, p.7), and it is the main constraints of each project that will be highlighted in this study.
1.3 The Main Objectives of the Project.
The performance of a project is measured by three criteria. Had the project been completed early or in time? Had it been achieved within the limits of its budget? Was it consistent with "specifications that satisfy customer satisfaction? Therefore, each project has three interrelated purposes, namely, the compatibility of the project with the budget and completion according to the specified time schedule and the proportion of compliance with specifications that satisfy the customer (Mantel et.al, 2008, p.6).
In view of the importance of these three objectives, we will address the following: 1. Schedule: Is the process of converting the project plan into a schedule for the operation of the program from the moment it starts work through all consecutive activities and overlapping events and main stations until the moment of termination of the project (deadline) and then set the time required to implement the project from the start to the moment of completion (Khairuddin, 2012, p.137).
We can say that the time schedule reflects the time required to implement the project within the timetable set for it since the start-up and establishment until achieving the benefit of the project and delivery on time.
2. Qualty: Means the high degree of qualitative or value as stated in the Oxford Dictionary. The International Standard for Quality Terms 1994 includes a definition of quality which is a set of characteristics of the product or service its suitability to meet needs or conformance to purpose, and control over the quality of the construction project is a process To adjust the quality of each project activity according to the specifications established in the contract documents in order to achieve the required quality of the project (Bohan, 2012, p.45).
5
3. Project Budget: After completion of the planning process of the technical aspects of the project and determine the time necessary to implement it, there is an "important" element of planning that needs to be completed before project management starts to implementation, its important to determine the budget needed to obtain the necessary resources to achieve the objectives of the project (Mantel et.al, 2008, p.108). The project budget was defined as a process of guessing or predicting the resources required by the project, the number of resources and when would project need it? How much will these resources cost? It is also known as a plan for the disbursement of funds from the beginning of the project until its end (Calmes, 2006, p.63). We can conclude that the project budget represents the planned budget of the project by the landlord based on the direct costs of the activities detailed and the indirect costs of the project which are approved at the stage of establishment of the project. These three constraints are the most important objectives of the project and there is a reciprocal and important relationship between them.
1.4 Project Characteristics.
Most projects generally have a set of core characteristics, especially those related to the main objectives of the project's constraints and the golden triangle (scheduling, budget, and quality), projects may differ in their characteristics but there are fixed characteristics collected by all writers and researchers; (Gido & Clements, 2006, p.4); (Slack etal., 2004, p.554); (Nagarajan, 2004, p.3):
1. Objective Clarity: is the result or product that is defined within the scope, scheduling and cost framework.
2. Task Chain: the project is complex, "which requires dividing it into partial tasks, which in turn are divided into non-duplicate activities that are interrelated and must be completed in a sequence to achieve the goal.
3. Resources: The various material resources required to perform and fulfill the tasks and activities of the project and include all material and human resources (people, organizations, equipment, etc.).
6
4. Life Cycle & Due Date: The project is an organic organism with a life cycle where it starts slowly and then activity increases until it reaches the peak and then goes down until it ends when the project is completed and has a specific date for delivery.
5. Client: represents the body that finances the project to complete it and can be (person, organization, government or private sector).
6. Complexity: Achieving project objectives requires many different tasks. The relationship between these tasks may be complex. The complexity is related to the size, value, and number of people involved in the project.
7. Uniqueness: Each project has unique characteristics that distinguish it from other projects. It can be said that there are not two projects that are quite similar.
8. Uncertainty: Where each project has a certain amount of uncertainty, it is necessary to document some of the assumptions and estimates that may affect the objectives of the project (project budget, time schedule, and the quality), so the project manager spends a lot of time preparing for the unexpected changes and resorting to the swap between the objectives of the project.
9. Interdependent: In the case of the organization implementing several projects, the project management faces continuous overlaps with the functional divisions and such sections (marketing, finance, manufacturing, etc.). The project manager should have a clear picture of these overlaps at each stage of the project and Appropriate relationships with each functional section to prevent conflict and crisis.
10. Conflict: The project manager faces a conflict-oriented set of positions, from which the projects compete with the functional divisions of the organization themselves for the available human and financial resources. The conflict arises as a result of multilateralism interested in the project. In any multi-stakeholder project (project team, parent organization, suppliers, direct beneficiaries of the project, etc.), each party has its own objectives that conflict with any other party at any stage of the project, which requires a clear strategy for the management of the parent organization to balance the parties interested in the implementation of the project.
7 1.5 Project Life Cycle.
As we have said before, the project is an activity with a starting and ending point and between them is a group of activities that are carried out to reach the end point and completion of the project, so every project goes through the so-called life cycle of the project. The project life cycle is defined as the stages that link the beginning of a project to its end. When an organization wishes to implement a specific project, it relies on an economic feasibility study for the purpose of making the decision to start or leave the project. The project life cycle helps project managers to indicate the need to deal with the feasibility study The transition from one stage to another in the project life cycle is determined by one of the forms of delivery or technical transfer. The audit process is carried out for the purpose of observing the required quality and then it is approved and allowed to move on to the next stage (PMBOK, 2000, p.11). As there is a difference in the characteristics between project and another and vary between the degree of risk and uncertainty and complexity, so the completed companies are subjecting their projects to several stages in order to achieve the best management of control, generally these stages regardless of the project activity and duration and size, Which is commensurate with all projects but varies from project to project depending on the nature and size of the project (Muhammad, 2012, p.89).
A large group of researchers agreed that the project goes through four stages; (BMBOK, 2008, p. 16); (Larson&Gray, 2011, p.7); (Lewis, 2001, p.31):
1. Start-Up Phase: At this stage, objectives are set, install specifications, prepare tasks and determine responsibilities.
2. Planning and Development Phase: At this stage, the effort begins to increase, and the indicators developed through the feasibility studies are used. The work of this stage includes: scheduling preparation, determine resources to implement project plans, determine manpower, determine budget and identify potential risks.
3. Implementation or Executing Phase: This stage is carried out in accordance with the basic plan developed in the previous phase. The project is also monitored to make
8
sure that it goes according to plan. The main tasks of this stage are: reporting on the progress of work, notifications of required changes, quality control, and forecasting. 4. Closing and Termination Phase: At this stage, the activities of the project are checked to ensure that the project has been completed according to the required specifications and plan. This stage may include training the clients on the project outputs, and then preparing the final reports and delivering the required documents. The work of this phase can be summarized as follows: audit and evaluation, resource release, customer training and document transfer.
In the end, the project is not completed by the completion of its activities, but it is completed when the project management organizes its tasks through the implementation of the work of the final stage and delivery of the project (Rad, 2012, p. 16).
While a section of researchers divided the project lifecycle into three: start-up phase, implementation phase and termination phase, (Willim, 2008, p. 3) (Kheireddine, 2011, p. 34).
While the project brochure was divided into six phases (Harmsen, 2006, p. 6): 1. Initiation Stage. 2. Definition Phase. 3. Design Phase. 4. Development Phase. 5. Implementation Phase. 6. Follow-Up Phase.
Despite the different life cycles in the projects, there is agreement that all of them have a beginning and an end and a period of implementation. Failure to agree on the number and naming stages of the project's life is not a defect in the management of the projects,
9
but it is a natural situation considering that the projects vary in size, scope, and characteristics.
10
CHAPTER II
METHODOLOGY OF SCIENTIFIC RESEARCH
INTRODUCTION
The methodology of research is the cornerstone of the scientific research project, which makes the path that will be used to address the research problem will be determined, that is how it can verify its assumptions and achieve its objectives and indicate its importance according to scientific research methodology.
2.1 Problem Description.
Most of the construction projects have been characterized by a low level of performance, which is characterized by high costs and increased completion time. There are a number of important strategic and vital projects related to important segments of the society, such as the construction projects of schools and hospitals in Iraq, due to the increase of students and the expansion of residential areas, which requires a meticulous study through the project in order to project completion in time. According to the optimal time schedule and the best trade off time/cost of completion of the project, to provide several alternatives to help the decision-making process appropriate to the conditions of implementation of the project, as it is implemented in a repeated and different circumstances, especially the country like Iraq which has been facing an economic crisis since 2014.
The high cost and duration of project implementation for the planned cost, is one of the results of retaining and relying on very simple planning methods like using the Gantt chart and follow-up of the implementation phase by the entity responsible for implementation through reports of progress of work by the supervisor only, therefore,
11
the problems experienced by the projects of Baghdad Governorate can be summed up as the subject of the current research in the form of inquiries and in the following manner: 1. Is the Gantt method used with progress reports in follow-up to the implementation phase of the project? Is this method one of the methods that highlight the level of project performance accurately in terms of the two dimensions (time and cost)?.
2. Does the ministry have a work plan that provides the best time schedule while providing several alternatives to different implementation conditions for the school project, especially since the need to repeat the implementation of the project is ongoing ?.
3. Is there a decrease in the benefits and positive return from the project and delays in benefiting from it as a result of delay in completion and increase the cost ?.
These questions are among the most important reasons for studying the alternative methods of planning used by executing agencies for projects in Iraq generally and particularly in Baghdad city and work to replace them in more effective ways.
The main problem that will be addressed and studied by applying the critical path method (CPM) is all about the performance (time and cost) of the project.
2.2 Aim of Study.
The Main Objectives to Be Achieved in this Study are:
A. Calculation (normal time, downtime, normal cost, and cost of collapse) for the school project.
B. Provide a number of alternatives in accordance with the terms of implementation by gradually implementing the project crash, while providing the optimal solution in terms of time / cost of trade outside the project.
12
C. Contribute to reduce the delay of achievement and reduce the impact on projects, especially the school project as it will be implemented in the future in multiple locations and different circumstances in each case.
D. Investigate the effect of CPM on performance enhancement and its contribution to reducing project delays and cost control through the findings of the research and its analysis.
2.3 The Importance of This Study.
The application of the project management methodology is necessary and important to make the project management processes part of the daily work culture within the institutions. Exceeding the cost and duration of the construction projects related to the life of the individual and society leads to loss of value for these projects.
It is hoped that the research will contribute to achieving the following:
1. Provide a practical application on how to use CPM as an effective planning method that is not used by the project department in the governorate, through a vital project in Baghdad governorate for the purpose of planning and monitoring the work by the project's network plan.
2. To improve generally the level of project management performance for the Sunni Endowment ın Iraq, based on the scientific approach presented in this research through the practical application of the mentioned method.
3. Assist in the decision-making process related to selecting the appropriate alternative for the time period and cost estimated to suit the circumstances of the implementation of future projects according to the results of the current research.
4. Inform researchers in the academic field as well as the practitioners, on a practical application of project planning and its role in monitoring the project by measuring the values of performance indicators.
13 2.4 Project and Research Sample.
One of the investment projects of the Sunni Endowment Fund was selected, which is the construction of several schools in the outskirts of Baghdad city, in proportion to the increase in the population.
The project on the construction of a Muslim Bin Aqeel school was chosen in ALTaji area north of Baghdad, this project has been selected because the project is still under implementation, noting that there are difficulties in completing the work during the specified period due to the lack of quick and scientific solutions to address the delay, and this is what most of the projects in Iraq suffer from, and we must stop on this problem and study it to find out the causes and find solutions that benefit them.
2.5 Methods Used in finding Results.
The practical aspect of the research is divided into two parts:
A. Calculate the traditional and non-traditional relations between activities, and to determine the time and cost of critical activities, by applying the critical path method(CPM), as well as calculating the acceleration time of the project by applying the mathematical laws to accelerate the project time.
B. Conversion of the project data into equations using mixed integer linear programming including the objective to be achieved, whether to reduce the time or cost of the project, with the constraints of the project activities. Use (IBM ILOG CPLEX Optimization Studio) program which is a giant software in operations research to analyze and choose the optimal solution. By converting mixed integer linear programming into the OPL language accepted by the program.
14 2.6 Sources and Methods of Data Collection.
2.6.1 Preliminary Sources:
All preliminary data was used to address the practical aspect of the study, through: A. Interviews were conducted with the managers of the departments involved in the management of the construction projects to discuss the community and the sample of the research to obtain information and data about the project to highlight the importance of the techniques mentioned in the planning,and the extent of the culture of project management among employees of the ministry.
B. Study of project documents and work reports Which represents the field of research through visits and field life of some of the implementation steps for the project with the engineering committees responsible for the implementation and supervision of work. C. Adoption of discussion, dialogue and analysis to finalize the research results.
2.6.2 Secondary Sources:
Secondary sources were used to address the theoretical framework of the study, through:
A. Foreign and Arabic books and references related to the subject of the study. B. Periodicals, articles, research and literature on the subject, around the world.
Perhaps one of the most important obstacles to research is the lack of accurate and detailed documentation of data, among those responsible for the project and lack of interest in statistics, where most of the information on the practical aspect of the study was collected through visits and meeting with the resident engineering committees
15
responsible for implementation, and to strengthen the data documented with additional information resulting from asking many questions.
2.7 Previous Studies.
In this paragraph, we will review the previous local, Arab and international studies related to the current study, to find out the most important topics that were discussed, to identify the methods, procedures, results achieved, and the extent of use it and comment on them.
2.7.1 (Hafeezah: 2014).
"The trade-off between traditional and modern business networks in planning and monitoring projects", Master Thesis in Economics - University of Mohammed Khudair-Algeria.
The study aimed to determine which type of business networks are the best the traditional or Modern? In the planning of projects through the statement of how to use network analysis in general, and prove that, through this study which was seeking to solve the problem of not using quantitative methods in the process of planning and monitoring projects in the Arab world, specifically Algeria, The quantitative approach to data analysis was based on the practical application of critical path method to build a residential complex through ready-made software.
The main results of this study are that the estimated time to complete the project in the critical path was less than the estimated time by the institution or contractor, the time in the critical path closer to the actual time to complete the project. And recommended using modern methods because they do not neglect the qualitative effects on construction projects.
16
"Using project scheduling methods, PERT and the critical path in time-cost trade off for project completion - applied study at the Technical Institute - Baghdad".
The aim of the study was to seek optimal use of resources and improve performance by coordinating project activities and reducing time and cost, in order to find a solution to the problem of underestimation of time and non-exploitation of resources available in the project (building marketing center in Kirkuk)
The researcher used the quantitative method through the application of laws and equations of methods (CPM, PERT).
The results showed that there is a difference of 48 days between the planned and actual completion period, with a waste of resources led to a loss of 90%, due to poor follow-up and the diagnosis of deviations and treatment at the appropriate times, which led to fines on the delay on the implementing agency more than 19 million Iraqi dinars.
2.7.3 (Shaaban: 2009).
"The possibility of applying critical path method at ALNajaf International Airport" - Master Thesis - University of ALKufa-Iraq.
The study aimed at using the critical path method in determining the standard times of the project activities and the time factor pressure through the process of acceleration and access to the costs of saving time.The purpose of the study was to answer the question of whether using the critical path method would lead to the pressure of the time factor of the activities of ALNajaf International Airport Project by taking advantage of the time surplus and interventions between activities.
The study concluded that the crashed time for the completion of the project was 461days, which was before in 475 approximation days, as a result, the project could be accelerated by decreasing the days which would have costed 44 million Iraqi dinrs.
17 2.7.4 (Tamrakar: 2013).
Analysis and Improvement by the "Application of Network (PERT/ CPM)".
The aim of the course was to provide a methodology for the critical path method (CPM) and pert, to present the method of implementation in the basic project companies.
The reason for the study was to subject the processes and procedures of projects for analysis and improvement through new methods, where the quantitative approach was adopted to calculate the standard times for the activities of one of the electricity projects implemented by the Bansal Projects Company.
Where the results showed that the implementation of techniques (Critical Path Method and Pert) lead to significant changes in the performance of project companies in terms of reducing the completion time of the project and reduce costs, in addition to increasing the effectiveness and efficiency of processes and procedures improve control over and tahe benefit from resources and the total value to improve project management and ease control.
2.7.5 (Kelleher: 2004).
An Investigation Of The Expanding Of The Critical Path Method By Enr's Top 400 Contractors - University of Virginia.
The aim of this study was to examine the extent of change in the use of the critical path method in the construction industry in large, small and medium enterprises, and in comparison with two previous studies similar to those in 1974 and 1990.
The purpose of the study is to compare the importance of the critical path method in the previous periods with the present time and what will happen in the future,
18
The descriptive analytical method was used through the online questionnaire. The sample of the study was faculty members and students at the Virginia University of Technology.
Where the results confirm that 98% of the companies that the crıtıcal path method is a tool for good management and has a role in achieving the current and future success. The current study is consistent with most previous studies and the importance of optimal utilization of resources to improve the performance of projects by emphasizing the use of methods of network analysis, especially (CPM).
The main advantage of this study is to focus on the critical path method and to rely on it to calculate the project duration, provide information about the times and costs of project activities and identify critical activities, then begin the process of planning the project crashing and calculating the crash cost for per unit of time to do the time/cost tradeoff according to the project goal.
The results will also be presented through an IBM ILOG CPLEX Optimization Studio program. In order to obtain the optimal solution through this application, the project data model should be written in a way that is consistent with this type of program. Therefore, the data and constraints of the project will be converted in the form of linear programming equations and then converted to OPL (language of simulations for this program).
Since we are working on a time-cost tradeoff in a construction project, a number of activities have a specific crash time (discrete crash time), so we cannot model such activities by linear programming, but they can be formulated using the integer programming equations.
Therefore, all project data are drafted in the form of a model using mixed integer programming, and this is the novelty of this study.
19 CHAPTER III
SCHEDULING AND BUSINESS NETWORKS IN PROJECT MANAGEMENT
Introduction
Network models are an effective tool in project management, especially the medium and large projects consist of a large number of overlapping and complexed activities that require planning methods that enable managers to plan and schedule project activities in a manner that facilitates the process of implementation and control of the project, to ensure optimal utilization of all available resources.
Networks provide a clear picture of understanding relay relationships and precedence and achieve accurate scheduling of start and finish times for each activity. This will facilitate monitoring of project implementation by comparing what was planned and what was actually implemented.
3.1 Schedule of the Project.
3.1.1 The Concept of the Scheduling Process in the Project:
Usually each project has a planned deadline, and to help ensure that the end date of the project coincides with the actual completion of the project, there must be a detailed timetable, this schedule includes a list of the main stages, tasks, and activities of the project completion, and should also include a list of those responsible for the performance of these tasks, and show the relationships of continuity and interdependence and precedence between tasks and activities (Benator & Thumann, 2003, p. 10). Scheduling is done by converting the work plan into a schedule and
20
resource table through planning methods (Mantel et.al, 2008, p. 145). Such as a Gantt chart, critical path method (CPM), and (PERT).
Scheduling is defined as transforming the project work plan into an operational schedule, it is the key tool for project management (Merdith & Mantel, 2012, p. 331). It has also been defined as a detailed plan that is carried out by loading the resources for short periods of time to accomplish certain tasks, The project scheduling is vital to the successful implementation of the project and the achievement of its objectives (Krajewiski, 2013, p. 529).
Finally, (Calmes, 2006, p. 63) defined it as giving us a plan of action and what we do every day or every week until the work is fully completed.
We agree with the definition of the writer (Khair ALdin), he analyzed scheduling to its basic elements and he said that (it is the process of converting the project plan into a timetable for the operation of the program from the moment it starts work and through all the activities and events consecutive and overlapping and the main stations (Milestones) until the end of the project (deadline), this process results in determining the time required to implement the project from the moment the project starts until the end of the project (Khair Aldin, 2012, p. 137).
Therefore, the planning phase comes after planning the project and identifying the elements and the main activities, processes and Resources needed to implement it and finish its effectiveness, and the preparation of its organizational structure.
There are several procedures to build and prepare a project schedule as follows: (Meredithet.al, 2008, p. 88):
A. Clearly define and arrange project activities.
B. Identify the types and quantities of resources required for each project activity.
C. Guess the precedence relationships of activities with guessing the duration of each activity.
21
D. Select and load all Milestone stations for the project with priority relationships also set.
Therefore, aggregating the main stations of the project and the duration of project tasks and precedence relationships, gives the result to obtain the main scheduling of the project, which helps the project manager to compare the actual time and actual resources of activities with the planned at any level, so we see that the main scheduling plan can be counted as a control and monitor document for the project.
3.1.2 Project Scheduling Stages.
The project scheduling process is in three basic stages, respectively: 3.1.2.1 Planning Stage.
This phase involves the collection and analysis of data on each project activity, identify the resources required for each activity, especially the time, add to determine the nature of the relationship between the activities, and fix the date of project termination (due date), so that the project network can be built on the basis of these data, then determine the budget of the project, and indicate the amount of fine for completion late than the deadline (Acuña, 2010, p. 154).
3.1.2.2 Scheduling the Activities Stage.
The Project Manager decides at this stage to estimate the time needed to complete each project activity, with an assessment and calculation of the physical and human resources needed for each activity, and critical path determination, after that the total costs required for completion and the total duration for the project are estimated (Heizer & Rander, 2011, p. 93).
3.1.2.3 Control Stage.
Another important stage of project management using scheduling is project control, its function is to coordinate resources from manpower, funds, equipment, machinery and
22
time within a specific time frame to achieve project objectives for satisfactory performance and results (Abdulla et.al, 2011, p. 45).
3.2 Project Networks.
The main problem with scheduling is often when tasks are scheduled without resource scheduling, and no systematic objective functions are used for measurement and evaluation (Francis & Philippe, 2003, p. 151). Therefore network planning is a scientific approach to project planning and organization through a network that reflects the chronological and logical sequence of the project activities and the interrelationship between these activities. The process of implementing the project is determined according to the planned program and identifying the necessary resources and their appropriate timing (Hafeza, 2014, p. 13).
3.2.1 Time Charts.
The charts, sometimes called the graph bar, were developed by Henry Gantt in 1915 and included in the project management plan as a visual presentation tool that includes clarification of project activities and completion times (Cooke, 2015, p. 35), until 1980, the tasks and activities of the project were often carried out manually through Gantt charts, due to the shortcomings in the bar charts and to meet the requirements of modern management efforts have been made to develop them and search for more efficient and appropriate methods for large and complex projects. One of the most important modifications is the discovery of Network Planning and the most prominent types are (critical path method CPM and PERT), perhaps the most important drawbacks of the Gantt chart, which led to new approaches, are: (Lewis, 2007, p. 71):
A. The lack of clarity of relations of precedence especially in relationships that cannot be inferred from the scheme.
B. Cost considerations are not considered in this chart.
C. Lacks Gantt charts to provide alternatives to accelerate the use of additional resources.
23
D. Lack of expected data on activities compared to other methods, especially the critical path method.
3.2.2 Network Planning.
Using the network planning is the response to the expansion and complexity of projects and the creation of more efficient means in the planning, scheduling and controlling of projects, and to overcome the above defects and problems.
Almost in the mid-1950s, two methods of network analysis were developed independently, in both, the matrix diagram was used to establish sequence relationships and parallels between activities. In 1956, a critical path method was introduced by Du Pont Company, which was widely spread and focused especially in the construction industries. After that in 1958, pert was introduced as a method of evaluation and review of the project by the consulting firm (Booz – Allen, and Hamilton), to improve and manage the US submarine missile program Polaris, the program was large and required planning, scheduling, and supervision of the activities of more than (3000) contractors. In order to achieve it, this method was developed, which contributed efficiently to the estimated time of the project by about two years (Wong, 1964, p. 54).
Due to the many advantages that are available in the networks planning especially the possibility of using it in the planning of large projects and complex nature, which includes a lot of activities, as most of the workers in the planning of construction projects prefer to use these methods in the manner of the chart, because the latter method is only suitable for small projects (Naseer, 2007, p. 119).
3.2.3 Key Networks Elements.
There is a set of key elements that make up the network diagram so that it can be drawn in the final form by translating these elements into a plan that facilitates monitoring the project for the purpose of controlling its course within the plan. The most important elements are:
24
Activity: One of the main elements of the project expressed in a two- nodes and requires implementation of human, material resources and a period of time, add to It is the smallest unit of physical work in the project and has a cost (Aziz & others, 2011, p. 188)
Critical Activities: Activities that are on the critical path and the delay in their completion are delaying the project (Morder, 1983, p. 23).
Dummy Activities: These are activities that do not take time and require no resources, its time is zero, and marked by a dashed line (---). It is merely a representation of activity dependence to avoid confusion (Morder, 1983, p. 24). Event: is the starting and ending point of activities, and the event does not take
any time period and consume any resources of the project (Ried & Sander, 2002, p. 523).
Critical Path: A continuous chain of critical activities, the longest on the network, giving the minimum time to complete the project, and any delays in the activities of this track delay will make the whole project delayed (Passenheim, 2009, p. 43).
Next figures Drawings show how items are related to each other and some undesirable situations as in the latter:
25
Figure 1: For Each Activity has a Start and Finish.
Source: Al-Anshasi, Adnan Ali, (1997). "Management of Engineering Projects", First Edition, Palestine, Gaza, p. 177.
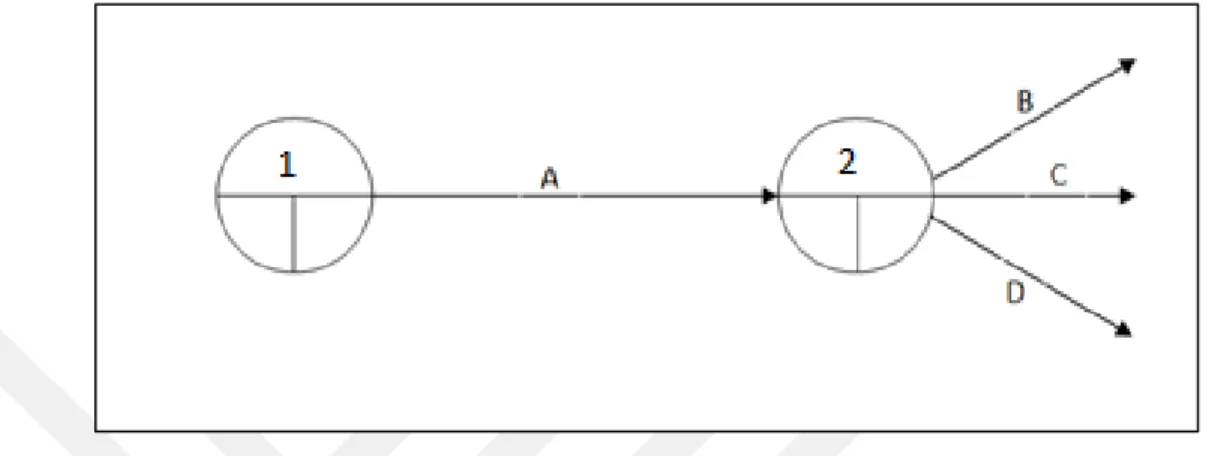
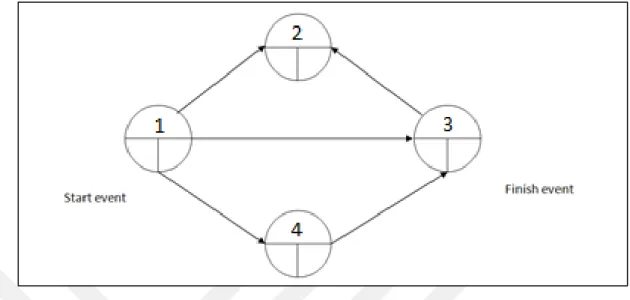
Figure 2: The end event for the previous activity is the start event for subsequent activities. Source: Pinto, Jeffrey K., (2007). "Project Management Achieving Competitive Advantage, BY Pearson Education, Inc.Upper Saddle River, New Jersey, p. 288.
Figure 3: Intersection of Activities (Unwanted status)
Source: Al-Fadl & Al-Obaidi, (2010). "Project Management Quantitative Approach", Dar Al-Rawqq Publishing and Distribution, p. 187.
26
Figure 4: Return Activity From a Subsequent Event to a Previous Event (Wrong Case)
Source: Al-Anshasi, Adnan Ali, (1997). "Management of Engineering Projects", First Edition, Palestine, Gaza, p. 177.
3.2.4 Logical Relationships Between Activities in the Network Diagram.
The network diagram shows the logical sequence of activities. Logical relationships between activities must be determined before drawing begins. There are two basic relationships: (Burke, 2009, p. 132):
A. Parallel Relationships: activities that are performed at the same time and are more efficient in the use of time than serial activities.
B. Serial Relationships: These activities are implemented one by one since, at the beginning of the development of networks, these relations were the most common. The failure to determine the relationship between activities in terms of synchronization and precedence leads to the inability to use the network efficiently and effectively to complete the project on its final date, therefore, it is necessary to divide the project into specific activities that can be distinguished from each other, with precise start and end dates and identification of the type of overlap with other activities (Mantel et.al, 2008, p. 147).
27
This leads to a vital and dynamic plan for the project using a different classification of the relations between the beginnings and endings of the activities, including the conduct of the project activities without collision and intersection and without wasting time, which can be specified in four following relationships: (Rad, 2013, p. 20):
1. Finish to Start (FS): It is the most used relationship between activities, where the activity ends and start the other, we can note that the start of activity (B) is affected by the previous activity as it is associated with the relationship (FS) cannot be implemented without the completion of the implementation of activity (A), which is common relationship between activities by about 90%.
2. Finish to Finish (FF): Which is the relationship between the two activities associated at the time of termination for both of them, where we note that the end of activity (B) is affected by the end of activity (A) because the relationship they are associated with (FF), both activities must be terminated at the same time.
3. Start to Start (SS): This is the relationship between the two activities that are linked together at the start time, so Activity (A) should begin to let activity (B) begins.
28
4. Start to Finish (SF): It is a rare and undesirable relationship and most specialists are advised to avoid it because it is a relationship that complicates planning and makes confusion.
Of all the above, two important observations must be made to avoid suspension and intersection of activities “dangling activities” (Rad, 2013, p. 20):
The first relationship (FS) is the most used relationship, it is used to ensure that there is no undesirable intersection during the implementation process.
Avoid the use of the relationship (SF), because it creates a situation of undesirable overlap between activities and thus complicates the process of implementation of the project.
3.2.5 Formulas and Design Forms of Business Networks.
There are different forms of network design work, and the reason for this difference is due to the type and nature of the project, as well as the nature of the activities of the project, there are two basic formulas for the design of business networks:
A. Designing networks based on activities on arrow (AOA): The activities are expressed through arrows, this means that the design of the work networks is based on the expression that the activities in the project are in arrow, the period of activity is written on the arrow, and for events it is expressed through the node or the circles. This formula is usually applied in PERT technique (Heizer & Render, 2011, p. 100). Figure (3.5) illustrates the representation of activities on arrows:
29
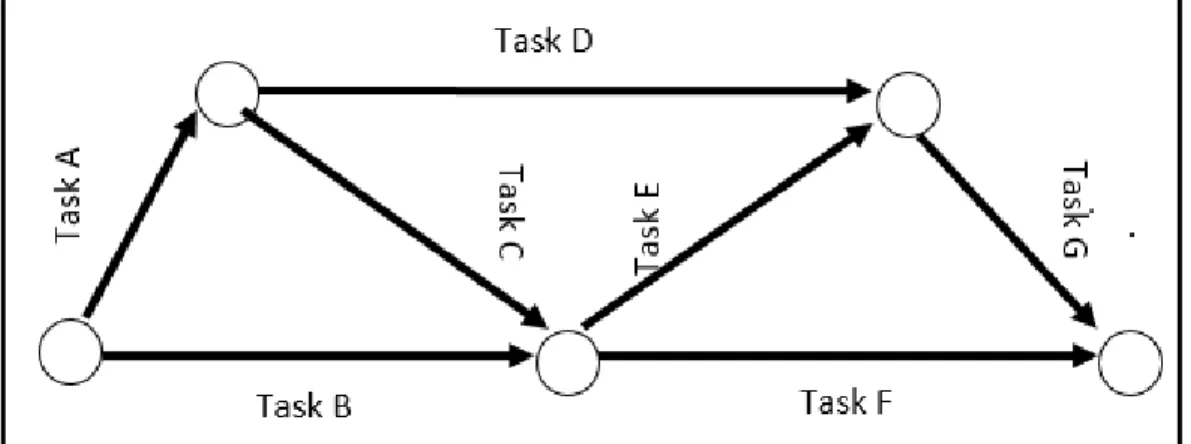
Figure 5: Design of Arrows-Based Work Networks (AOA).
Source: Lewies, James, (2007). Fundamentals of project management, 3th, New York: Project Management Institute, Inc. p. 72.
B. Designing Networks Based on the Activities On Node (AON): In this kind of formulas for the network's nodes are (Node) reflect activity while the arrow reflects the event, this formula is applied in (CPM), and writes the periods of time in the activity box or node as in Figure (3.6) (Krajewiski, 2010, p. 78), this type is called multiple names such as (scheme of precedence, circuit diagram or linkage) and its features are easier than the first type in terms of its comprehension by users of the scheme (Lewis, 2001, p. 225).
30
Figure 6: Design of Networks on the Basis of the Node (AON).
Source: Lester, Albert, (2014). Project Management, Planning, and Control, 6th, United States: Published by Elsevier Ltd. P. 116.
Both methods can be used in network analysis techniques, but project networks will be drawn in the practical aspect of current research according to the second method because they are more common in practical fields and have the following features: (Hillier & Lieberman, 2010, p. 401):
- The (AON) method is easier to create and configure than (AOA).
- The method of representation (AON) is easily understood by users, including managers, rather than (AOA).
- The method of representation (AON) is easily reviewed and scrutinized when project changes are made or made more than (AOA).
3.2.6 Advantages of Network Scheduling Schemes.
There are many ways in which the scheduling of projects, perhaps the most important are the critical path method CPM, the Program Evaluation and Review Technique PERT, the system of scheduling the specific operations and conduct the distribution of manpower, these methods have achieved widespread in the field of application in
31
organizations and in all types of projects (Mishra & Soota, 2005, p. 120), because they were characterized by many of the advantages addressed by most of the literature and scientific books on networks, including the following; (Kerzner, 2009, p. 494); (Lewis, 2001, p. 256):
A. Network diagrams form the basis of all planning and forecasting processes.
B. It helps the manager of the project in how resources are used to achieve cost and time objectives.
C. Provides a clear vision and allows managers to control a unique program.
D. It assists management in evaluating alternatives by identifying the time delays that affect project completion, with the possibility of determining the excess time between activities and the critical elements that lead to compliance with the deadline.
E. Can be considered as a means of examining the progress of work.
F. Demonstrates the independence of activities within the project.
G. Specifies the longest path or critical path.
H. Is a way to estimate the time and cost of the project, the most important in the project constraints and the most influential on the project plan.
3.3 The Difference between the PERT and the Critical Path Method CPM.
The critical path method has emerged from construction projects, while the PERT technique has evolved through R & D projects. Both ways share the same way in building the project network and in identifying the critical path on the network, and both of them is a method of planning, scheduling and project control.
32
There are some fundamental differences between the two methods, the PERT method is related to uncertainty regarding the estimated time of activities, while the critical path method deals with time estimates as somewhat inevitable, and the critical path method also extends to time and cost tradeoff (Mishra & Soota, 2005, p. 143).
According to the current study, project times and critical paths will be calculated according to the Critical Path method CPM because it is more suitable for projects where resource allocation problems, as well as activity times, are known and documented such as construction projects, therefore, the focus will be on explaining the critical path method and how to calculate time for project activities by applying its steps.
3.4 Network Calculations.
Network analysis involves two basic processes; (Lester, 2014, p. 106): 1. Draw the network and appraise the individual activities times.
2. Analyzing those times, in order to find critical activities and the amount of Float time in non-critical activities.
These processes are carried out through a set of calculations for network planning and analysis, using equations and mathematical relationships to find many values that represent indicators that help specialists and project managers to manage the risks of uncertainty in the project, the most important of which is the sequence that the researcher believes necessary:
A. Calculate Early and Late Times for Activities
Networks assume estimates of activity times, and the time of the activity being confirmed is determined the typical time frame for carrying out that activity.
The timing of the activities depends on the ability and experience of the project's management or its implementers and previous experiences with similar activities, the activity time usually indicates the arrow of the activity in the network (AOA) and on the node in the network (AON).
Both PERT and critical path method CPM to calculate early and late times include two types of Computations:
33
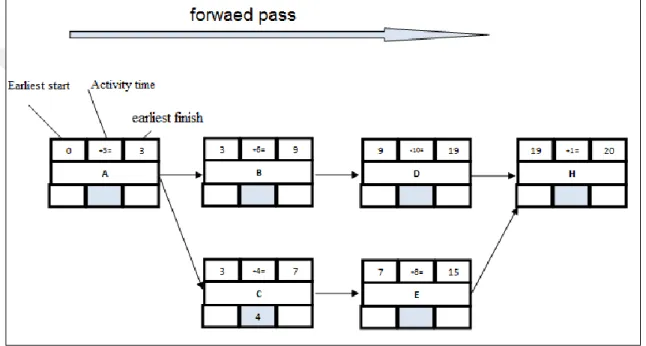
A.1 Forward Computations: These calculations usually start from the first event in the network and are sequentially extended to the last event in the network, this type of calculation is necessary to find the start and end times of the activities to determine the possible time to start the project, the early date of the first activity represents the start date of the project as a whole (Passenheim, 2009, p. 50).
The following figure shows the forward path of the calculations
Figure 7: The Forward Path to Calculate the Early Times
Source: Peterson, Chrstine, (2013). The Practical Guide to Project Management, BookBoon.com, p. 31.
A.2 Backward Computations: These calculations are carried out for the purpose of calculating the latest start and finish times of the activities it starts from the endpoint of the forward end of the last event in the network down to the first event.
Through this method, late start and late completion of each activity are determined, where the late start date for any activity is the maximum date that the activity can begin without delaying the project from its expiry date, while the late completion date is the
34
maximum date that the activity can end without causing delay in the project as a whole (Schwalbe, 2007, p. 236).
The following figure shows the backward path of the calculations:
Figure 8: The Backward Path to Calculate the Late Times.
Source: Menesi, Wail, (2010). Construction Scheduling Using Critical Path Analysis with Separate Time Segments, Waterloo, Ontario, Canada, p. 15.
For the purpose of determining the time needed to complete the activities of the project it is necessary to calculate the early and late times and clarify them as follows and according to the sources; (Hillier & Lieberman, 2010, p. 477); (Stevenson, 2007, p. 774):
1. Earliest Start Time (ES): This time for the first activity in the network is zero, and for the following activities it is as early as possible to start the activity.
2. Earliest Finish Time (EF): equal to the early start time of the activity, plus the duration of the activity itself.
EF = ES + T
35
3. Latest Start Time (LS): Starts by selecting subsequent activities for each activity in the network, after which the late start time and the late termination time are calculated minus the time that the activity takes.
LS = LF-T
4. Latest Finish Time (LF): It is the late start time of the activity plus the time of that activity.
Therefore, the full time available to perform the activity is equal to the difference between the early start time of the activity and the late completion time of the activity itself.
Maximum Time Available = LF – ES
When we want to calculate the early and late times for the activity there are several rules to be observed:
1. The early start time of the first activity in the project network at the first node should be equal to zero.
2. If there is one arrow linked to the node (one activity), the early start time for this activity (ES) will be the same time of early finish (EF) of the previous activity, for a node that is connected to more than one arrow within it, the early start (ES) time for subsequent activities is equal to the largest early finish (EF) time of previous activities 3. The late finish time of the last activity (LF) is equal to the time of early finish (EF) for the same activity, for the last node in the network.
4. If there is one arrow (one activity) goes outside of the node, the late finish time (LF) for the incoming activities will be equal to the late start time (LS) of the outbound arrow representing the subsequent activity, as the node owns more than one arrow goes out, the time of the late finish (LF) activities coming from it will be equal to the largest late start (LS) time of the exiting arrows.
B. Calculate the Float or Slack Time
The commencement of the activity may be delayed from the early start date without delaying the completion of the project on time, which occurs when there is a surplus of