Intensity noise of mode-locked fiber lasers
Ibrahim Levent Budunog˘lu,1,*Cos¸kun Ülgüdür,1Bulent Oktem,2and Fatih Ömer Ilday11
Department of Physics, Bilkent University, Çankaya, Ankara 06800, Turkey 2
Material Science and Nanotechnology Graduate Program, Bilkent University, Çankaya, Ankara 06800, Turkey
*Corresponding author: [email protected]
Received May 6, 2009; revised July 11, 2009; accepted July 14, 2009; posted July 27, 2009 (Doc. ID 111059); published August 14, 2009
Intensity noise of mode-locked fiber lasers is characterized systematically for all major mode-locking regimes over a wide range of parameters. We find that equally low-noise performance can be obtained in all regimes. Losses in the cavity influence noise strongly without a clear trace in the pulse characteristics. Given that high-energy fiber laser oscillators reported to date have utilized large output coupling ratios, they are likely to have had high noise. Instabilities that occur at high pulse energies are characterized. Noise level is vir-tually independent of pulse energy below a threshold for the onset of nonlinearly induced instabilities. Continuous-wave peak formation and multiple pulsing influence noise performance moderately. At high en-ergies, a noise outburst is encountered, resulting in up to 2 orders of magnitude increase in noise. These results effectively constitute guidelines for minimization of the laser noise in mode-locked fiber lasers. © 2009 Optical Society of America
OCIS codes: 060.2320, 320.7090, 060.3510.
Rapid progress is reported for mode-locked fiber la-sers, which have been limited to pulse energies of 1 – 3 nJ prior to 2003. The latest results report more than 30 nJ in 80 fs pulses [1]. These lasers have rich dynamics, arising from the intricate interplay of the strong nonlinear, dispersive, and dissipative pulse shaping effects [2]. Several distinct mode-locking re-gimes, namely, similariton [3,4], all-normal disper-sion [5], and soliton–similariton [6] have been identi-fied recently, adding to the well-known solitonlike [7] and stretched-pulse (dispersion-managed soliton) [8] regimes. As increasingly higher pulse energies are being generated from these lasers, it is natural to wonder about their noise performance. Applications in optical frequency metrology, spectroscopy, laser-material interactions, free electron laser based accel-erators are influenced by the laser intensity noise. Laser noise is particularly important when seeding a chain of amplifiers [9]. However, it is difficult to dis-cern changes in noise level through the usual pulse characterization methods.
There is no systematic characterization of the noise performance of mode-locked fiber lasers to our knowl-edge. Laser noise has been theoretically investigated with an emphasis on timing jitter [10,11], and several studies on a particular fiber laser design include characterizations of oscillator [12–15] and amplifier [15,16] noise. However, there is no clear picture of how the noise performance varies over the rich vari-ety of pulse-shaping schemes and the vast accessible parameter ranges. Here, we report systematic char-acterizations of relative intensity noise (RIN) of fiber oscillators operating in all the major mode-locking re-gimes, over a wide range of laser parameters. Sys-tematic results are obtained with a Yb-doped fiber la-ser specifically constructed to switch easily between soliton, stretched-pulse, similariton, and all normal dispersion regimes. All the main results were quali-tatively verified with an Er-doped fiber laser [6] and several other Yb-fiber lasers in our laboratory.
The cavity of the primary laser used in this study is similar to those reported in [3,5], comprised of 60 cm long highly doped Yb-fiber, approximately 450-cm-long single-mode fiber (SMF), and a free-space section. All the fibers have normal group-velocity dispersion (GVD) 共⬃24 fs2/ mm兲. The total
cavity dispersion is controlled with a pair of diffrac-tion gratings (GVD of −0.0141 ps2/ cm). For all-normal dispersion operation, the grating compressor is replaced by a bandpass filter of 10 nm bandwidth. The repetition rate varies between 35 and 40 MHz, depending on the particular configuration. Mode locking is achieved with nonlinear polarization evolu-tion (NPE) [17]. Measurements are taken from the polarization rejection port, the 5% fiber coupler, and the reflection off the first diffraction grating, such that power levels at every point throughout the laser cavity can be deduced.
The RIN characterization is done using the stan-dard method [18]. The optical signal is detected with a photodiode (InGaAs). The signal at baseband is ob-tained by low-pass filtering (dc to 1.9 MHz) the pho-tocurrent and analyzed with a high dynamic range baseband spectrum analyzer (bandwidth of 250 kHz). Integrated noise is obtained by integrating the noise spectrum, multiplying by 2 (to account for the double sidebands), and taking the squre root over the de-sired bandwidth. Long-range autocorrelation, optical, and rf (12 GHz bandwidth) spectra measurements establish the mode-locking characteristics.
As a first step, we tested the noise performance of pump diodes from three different vendors, which yielded similar results at all power levels. The RIN of the laser was characterized over different mode-locking regimes and over the entire pump power range where mode locking can be maintained. We systematically investigated the effects of the (i) mode-locking regime, (ii) cavity finesse (i.e., losses), and (iii) pulse energy, including nonlinearly induced instabilities.
2516 OPTICS LETTERS / Vol. 34, No. 16 / August 15, 2009
The minimum noise state for each mode-locking re-gime was searched by varying the pump power, fine-tuning cavity dispersion, and by adjusting the wave plates that control the NPE, yielding nearly the same noise levels for the soliton, similariton, stretched pulse, and all-normal dispersion regimes (Table 1). We believe that the marginally lower RIN of the all-normal dispersion regime is simply because high losses at the grating compressor are avoided.
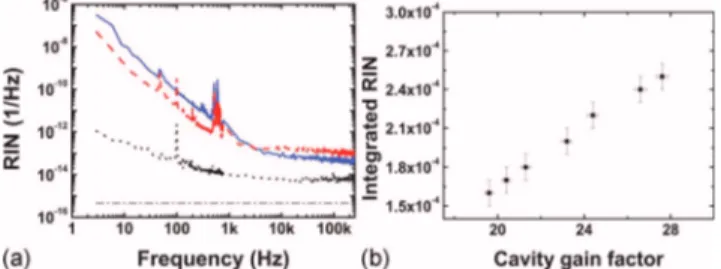
An important factor is the finesse of cavity, which determines the amplification factor per round trip. Higher gain leads to larger noise due to increased amplified spontaneous emission [19,20]. Keeping pump power and polarization setting fixed, losses of cavity have been varied with a variable output cou-pler: an additional half-wave plate is positioned be-hind the polarizing beam splitter cube, and the dif-fraction gratings act as a polarizer. Over the range losses that can be adjusted without losing mode lock-ing, we find that the total RIN increases linearly with increasing cavity losses (Fig.1). For lasers employing NPE, output power from the polarization port is con-trolled through the polarization parameters. It is common practice to maximize the pulse energy by in-creasing the power coupled out, thus minimizing the nonlinear effects. We investigate the effect of the fi-nesse by adjusting the NPE parameters under con-stant pump power and find that the total RIN again increases by up to 1 order of magnitude with increas-ing NPE output couplincreas-ing (Fig.2). In other words, in-creased power extraction both from a linear port and the NPE port deteriorates the noise performance. Quite significantly, this implies that many of the pre-viously reported high-energy fiber lasers are likely to have been relatively high-noise lasers.
A natural question is how the noise performance depends on the pulse energy for given cavity finesse. Although it is difficult to make controlled experi-ments over a broad range of pulse energies owing to the finite stability window, measurements indicate that up to a critical pulse energy, noise performance remains constant, irrespective of the mode-locking regime (Table1). However, beyond the critical energy, the precise value of which differs from laser to laser, instabilities induced by nonlinear effects are encoun-tered. The formation of a cw peak on the spectrum and multiple pulse formation are well known. Al-though cw peak formation is undesirable, the overall intensity noise of the laser is not increased by much; for example, the emergence of a cw peak in the stretched-pulse regime (2.8 nJ of intracavity pulse energy) leads to an increase of integrated RIN by
25% of its value without cw peak formation [Fig.
3(a)]. The highest increase we have observed was by a factor of 2. We find that the effect of multiple puls-ing is similar. The Er-doped fiber laser exhibits mul-tiple pulsing more readily. A typical case is shown in Fig. 3(b), where the integrated RIN during bound pulsing (pulse-to-pulse spacing of 3 ps, combined in-tracavity pulse energy of 1.7 nJ) increases by ⬃40% of its value without multiple pulse formation.
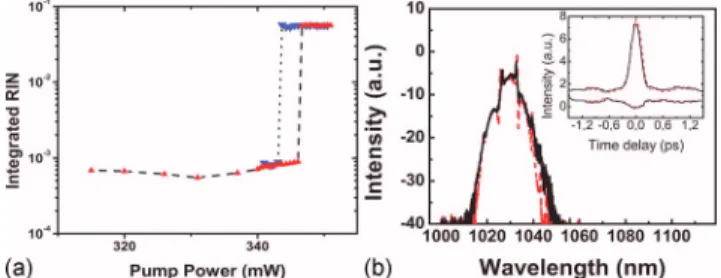
As the pulse energy is increased beyond a thresh-old, the laser can experience a noise outburst without cw peak formation or multiple pulsing. We observed this behavior for the soliton and stretched-pulse re-gimes in this study. The precise value of the thresh-old depends on the laser configuration. The high-noise state has nearly 2 orders of magnitude higher integrated RIN. Once in the high-noise state, power has to be reduced to a lower threshold to switch back to the low-noise state, tracing a clear hysteresis curve [Fig. 4(a)]. Switching between the states is abrupt (initiated over a change of power by ⬍1%). With the possibility of an environmental effect or pump diode instability ruled out, these observations are characteristic of a strongly nonlinear system un-dergoing relaxation oscillations [21]. As a practical matter, we note that it may be difficult to discern if a given laser is in such a high-noise state, as the auto-correlation, optical spectrum measurements look
in-Table 1. Lowest Integrated (from 2.9 Hz to 250 Hz) RIN Values at a Low and a High Pulse Energy
Laser GVD共ps2兲 RIN-LO (%) RIN-HI (%)
A −0.070 0.028共2.6 nJ兲 0.029共5.2 nJ兲
B +0.005 0.029共2.8 nJ兲 0.030共5.3 nJ兲
C +0.020 0.028共2.8 nJ兲 0.029共5.6 nJ兲
D +0.100 0.023共3.2 nJ兲 0.023共5.8 nJ兲
A, Solitonlike laser; B, stretched-pulse laser; C, similariton laser; D, all-normal dispersion laser.
Fig. 1. (Color online) (a) Measured noise spectrum corre-sponding to the highest (solid curve) and lowest (dashed curve) cavity finesse levels obtained by adjustment of the linear loss. Dotted curve shows the measurement noise floor. Dash–dotted line indicates the shot noise limit. (b) Corresponding RIN of the laser integrated over the fre-quency range from 2.9 Hz to 250 kHz as a function of the net gain through the amplifying fiber segment.
Fig. 2. (Color online) (a) Measured noise spectrum corre-sponding to highest (solid curve) and lowest (dashed curve) cavity finesse levels obtained by adjustment of the NPE loss. Dash–dotted curve shows typical noise spectrum of the pump diode. Dotted curve shows the measurement noise floor. Dash–dotted line indicates the shot noise limit. (b) Corresponding RIN of the laser integrated over the fre-quency range from 2.9 Hz to 250 kHz as a function of the net gain through the amplifying fiber segment.
distinguishable from normal operation. Only in some of the cases we have seen that a high-dynamic range optical spectrum measurement reveals indications of increased noise [Fig.4(b)].
In conclusion, we report a systematic investigation of the intensity noise of passively mode-locked fiber lasers with the following main result: (1) Noise level appears to be independent of the mode-locking re-gime. (2) Higher cavity finesse minimizes noise. Con-sequently, maximizing energy extraction by increas-ing the output couplincreas-ing ratio has a detrimental effect on the noise performance. Most high-energy lasers reported thus far may have had relatively poor noise performance. (3) Well-known indicators of instability, such as formation of a cw peak or onset of multiple pulsing, lead to relative increases in noise of 30%– 200% only. (4) An outburst of noise is encountered when a threshold in pulse energy is exceeded. Al-though further work is needed to fully understand this phenomenon, it appears to result from coupling of nonlinear effects to noise. This is remarkable given
that noise processes occur on a microsecond time scale, whereas nonlinear pulse shaping acts on a much faster (fs–ps) time scale. The lowest noise val-ues reported here are comparable to the best perfor-mances reported for Ti:sapphire lasers [18].
This work was supported by the Scientific and Technological Research Council of Turkey (TÜBI˙-TAK) under grants 106T017, 106G089, Marie Curie International Reintegration Grant (IRG) 46585 FiberLaser, Bilkent University Research Funds, and by the Distinguished Young Scientist Award of the Turkey National Academy of Sciences (TÜBA).
References
1. K. Kieu, W. H. Renninger, A. Chong, and F. W. Wise, Opt. Lett. 34, 593 (2009).
2. H. A. Haus, J. G. Fujimoto, and E. P. Ippen, IEEE J. Quantum Electron. 28, 2086 (1992).
3. F. Ö. Ilday, J. R. Buckley, W. G. Clark, and F. W. Wise, Phys. Rev. Lett. 92, 213902 (2004).
4. J. R. Buckley, F. Ö. Ilday, T. Sosnowski, and F. W. Wise, Opt. Lett. 30, 1888 (2005).
5. A. Chong, J. Buckley, W. Renninger, and F. Wise, Opt. Express 14, 10095 (2006).
6. B. Oktem, C. Ülgüdür, and F. Ö Ilday, in Proceedings of the Conference on Lasers and Electro-Optics (Optical Society of America, 2008).
7. I. N. Duling III, Electron. Lett. 27, 544 (1991).
8. K. Tamura, J. Jacobson, H. A. Haus, and L. E. Nelson, Opt. Lett. 18, 1080 (1993).
9. See, for example, K. Hong, A. Siddiqui, J. Moses, J. Gopinath, J. Hybl, F. Ö. Ilday, T. Y. Fan, and F. X. Kaertner, Opt. Lett. 33, 2473 (2008).
10. S. Namiki and H. A. Haus, IEEE J. Quantum Electron.
33, 649 (1997).
11. R. Paschotta, Appl. Phys. B 79, 153 (2004).
12. C. X. Yu, S. Namiki, and H. A. Haus, IEEE J. Quantum Electron. 33, 660 (1997).
13. J. Chen, J. W. Sickler, E. P. Ippen, and F. X. Kaertner, Opt. Lett. 32, 1566 (2007).
14. H. Byun, D. Pudo, J. Chen, E. P. Ippen, and F. X. Kaertner, Opt. Lett. 33, 2221 (2008).
15. P. K. Mukhopadhyay, K. Özgören, I. L. Budunoglu, and F. Ö. Ilday, IEEE J. Sel. Top. Quantum Electron. 15, 145 (2009).
16. A. Liem, J. Limpert, H. Zellmer, and A. Tünnermann, Opt. Lett. 28, 1537 (2003).
17. M. Hofer, M. E. Fermann, F. Harberl, M. H. Ober, and A. J. Schmidt, Opt. Lett. 16, 502 (1991).
18. R. P. Scott, C. Langrock, and B. H. Kolner, IEEE J. Sel. Top. Quantum Electron. 7, 641 (2001).
19. S. Sanders, N. Park, J. W. Dawson, and K. J. Vahala, Appl. Phys. Lett. 61, 1889 (1992).
20. N. R. Newburry and W. C. Swann, J. Opt. Soc. Am. B
24, 1756 (2007).
21. S. H. Strogatz, Nonlinear Dynamics and Chaos (Perseus Books, 1994).
Fig. 3. (Color online) (a) Laser noise spectrum with (solid curve) and without (dashed curve) cw peak. Inset shows the measured optical spectra with (solid curve) and without (dashed curve) a cw peak. (b) Laser noise spectrum for double-pulsed (solid curve) and single-pulsed (dashed curve) operation. Inset shows the measured optical spectra for double-pulsed (solid curve) and single-pulsed (dashed curve) operation.
Fig. 4. (Color online) (a) Integrated (from 2.9 Hz to 250 kHz) RIN of the laser as the pulse energy is first increased (up triangles) and then decreased (down triangles). (b) Op-tical spectra and autocorrelation traces (inset) measured immediately before and after the transition are shown by dashed and solid curves, respectively.