İSTANBUL BİLGİ UNIVERSITY INSTITUTE OF SOCIAL SCIENCES
FINANCIAL ECONOMICS MASTER’S DEGREE PROGRAM
THE DETERMINANTS OF CORPORATE CASH HOLDINGS IN TURKEY
YUSUF KENAN YILMAZ 115620006
SUPERVISOR
Assoc. Prof. ENDER DEMİR
İSTANBUL 2017
iii PREFACE
The writing of this thesis has been one of the most significant challenges in my life. I would like to specifically express my thanks to some people who have always stood by me in this challenging process. First of all, I’m grateful to Assoc. Prof. Dr. Ender Demir for his guidance, interest and help in writing my thesis.
I would like to thank to my dear wife, Zeynep Şüheda Yılmaz, for her limitless understanding, patience and support. I couldn’t have been accomplished this process, without her support.
I’m thankful to all members of my family for everything. I also express my gratitude to my dear aunt, Gül Demirci, who is always so valuable for me. Then, I am so thankful to my manager, İsmail Üner, for his motivating attitude and continuous support in this process. Lastly, I would like to thank to my associate, Ahmet Ağlar, for helping me every time.
iv
TABLE OF CONTENTS
INTRODUCTION ... 1
SECTION 1 OUTLOOK OF THE TURKISH ECONOMY ... 4
1.1. GDP GROWTH ... 4
1.2. UNEMPLOYMENT RATES ... 5
1.3. INFLATION RATE ... 6
SECTION 2 LITERATURE REVIEW ... 8
2.1. THE MOTIVES OF CASH HOLDINGS ... 8
2.2. THE DETERMINANTS OF CASH HOLDINGS ... 10
2.2.1. Firm Size ... 10 2.2.2. Capital Expenditure ... 11 2.2.3. Bank Debt ... 12 2.2.4. Cash Flow ... 13 2.2.5. Leverage ... 14 2.2.6. Payout Ratio ... 16 2.2.7. Profitability ... 17 2.2.8. R&D Expenses ... 18 2.2.9. Multinationalism ... 19
2.2.10. Net Working Capital ... 20
SECTION 3 HYPOTHESIS DEVELOPMENT ... 21
3.1. CASH HOLDINGS ... 21
3.2. FIRM SIZE ... 21
v
3.4. PROFITABILITY ... 23
3.5. NET WORKING CAPITAL ... 23
3.6. PARLIMENTIARY ELECTIONS ... 24
SECTION 4 DATA AND METHODOLOGY ... 27
4.1. SAMPLE ... 27
4.2. DESCRIPTIVE STATISTICS ... 28
4.3. METHODOLOGY ... 30
SECTION 5 FINDINGS ... 32
vi
LIST OF ABBREVIATIONS R&D Research and development
GDP Gross domestic product
EMDE Emerging Markets and Developing Economies IMF International Monetary Fund
OECD Organization for Economic Co-operation and Development
U.S. United States
BRIC Brazil, Russia, India and China U.K. United Kingdom
CEO Chief executive officer CAPEX Capital expenditure SME Small and medium-sized
EMU European Economic and Monetary Union ROA Return on asset
ROE Return on equity CPI Consumer price index EPU Economic policy uncertainty BIST Borsa İstanbul
PM Profit margin
vii
LIST OF FIGURES
Figure 1.1 GDP Growth Rates (%) 5
Figure 1.2 Annual Unemployment Rates (%) 6
Figure 1.3 Inflation Rates (Average Consumer Prices, %) 7 Figure 4.1 Average Cash Holding Ratios of Turkish Firms 29
viii
LIST OF TABLES
Table 4.1 Definitions of Variables 27
Table 4.2 Descriptive Statistics 29
Table 5.1 Regression Estimations-I 32
Table 5.2 Regression Estimations-II 33
ix ABSTRACT
In this study, we investigate the determinants of cash holdings of publicly traded firms in a developing country, namely Turkey. We use the data of 3,557 firm-year observations from 2000 to 2016 belonging to 387 publicly traded firms. We run a panel data method in our analysis. The results show that there is a significant and negative association between NWC and cash holdings. Moreover, in consistent with our expectations, we find that level of cash holdings increases when leverage decreases. We also show that size has not only negative but also a significant impact on cash holdings. On the other hand, we provide empirical evidence that profitability is positively correlated with cash holdings. It means that the more profitable the firms are, the more cash they hold. We also contribute to the literature by investigating the impacts of Turkish parliamentary elections on the cash holdings. Considering the related literature, we use parliamentary elections as a measure of uncertainty and we show that firms increase their level of cash holdings in and before the year of parliamentary elections.
x ÖZET
Bu çalışmada, gelişmekte olan bir ekonomiye sahip Türkiye’deki kurumsal nakit tutmayı belirleyen faktörler halka açık firmalar üzerinden incelenmiştir. Çalışma kapsamında 2000 yılından 2016 yılına kadar olan süre zarfında 387 adet firmaya ait yıl ve firma bazında toplam 3.557 adet gözlem kullanılmıştır. Analizlerimizde panel data metodu kullanılmıştır. İnceleme sonuçlarımız net işletme sermayesi ve nakit tutma arasında negatif ve belirgin bir ilişki olduğunu göstermektedir. Bununla birlikte beklentimize paralel olarak kaldıraç oranı düşerken nakit tutma seviyesinin arttığı gösterilmiştir. Ayrıca firma büyüklüğünün nakit tutma üzerinde hem negatif hem de belirgin bir etkisinin olduğu da ifade edilmiştir. Diğer yandan, karlılık ve nakit tutma kararı arasında pozitif bir ilişki olduğu kanıtlanmıştır. Bu durum daha karlı firmaların daha fazla nakit bulundurduğunu göstermektedir. Aynı zamanda Türkiye’deki parlamenter seçimlerin nakit tutma kararı üzerindeki etkisi de incelenerek literatüre katkı sağlanmıştır. Literatürdeki ilgili kaynakları da göz önüne alarak parlamenter seçim bir belirsizlik ölçüsü olarak kabul edilmiş ve seçim yılları ile seçimden önceki yıllarda firmaların nakit tutma oranlarının arttığı sonucuna ulaşılmıştır.
1
INTRODUCTION
The determinants of corporate cash holdings attract a lot of attention from all over the world. The reason behind this is that determining the level of corporate cash holding is very important and critical issue for firms. If firms don’t have enough cash or liquid assets which can be easily converted to cash or if they can’t obtain enough financial source from the financial markets when they face financial difficulties because of several reasons, they may not survive and they may go bankruptcy as well. Moreover, firms may also forego from the profitable investment opportunities because of lack of cash. On the other hand, the managers who prefer to hold excess cash make their firms more resistant to financial distress. Because more liquid assets are not only traded easier but also they provide more value in the short-term sales (Myers & Rajan, 1998). However, the firms which have cash in high levels should accept the cost of holding excess cash instead of borrowing. Because of such arguments, either holding or not holding excess cash have advantages and disadvantages. Therefore, firms pay much importance to setting optimum cash level which they hold in order to prevent cost of cash, financial distress, foregoing profitable investments and so on. According to Opler et al. (1999), managers aiming to increase the shareholders’ wealth as much as possible should determine the level of cash holdings according to its marginal benefit and marginal cost. They should set the optimum cash holding level which make equals the marginal cost and the marginal benefit of the cash holdings. Keynes (1936) provides a comprehensive theoretical background in order to explain the reasons for cash holdings. According to him, money is held because of four motives. The first one, income motive states that money is basically needed to pay expenditures. The second one, business motive, is to hold cash in order to pay the cost of business, similar to the first one. The third and fourth ones are precautionary and speculative motives respectively.
The number of researches examining the corporate cash holdings increases significantly and the literature provides several views and empirical evidence especially for the determinants of cash holdings. Firm size is one of the most
2
significant determinants mentioned in the literature. Opler et al. (1999), D'Mello et al. (2008), Dittmar & Smith (2007), Harford et al. (2008), Kim et al. (1998) and Dittmar et al. (2003) report a negative relationship between firm size and the level of cash holdings. One reason for such relationship is that the firms which can easily obtain cash from financial markets such as large firms tend to hold cash in lower levels (Opler, et al., 1999). According to D'Mello et al. (2008), the transaction cost of borrowing from capital market is higher for smaller firms and therefore, such firms tend to have excess cash holdings. In addition to firm size, leverage frequently appears as another determinant of cash holdings. As well as leverage is seen as a substitute for cash, another reason why firms prefer borrowing instead of cash holding is that the cost of leverage is lower compared to cash holdings (Ozkan & Ozkan, 2004). Another determinant of cash holdings is profitability. Dittmar et al. (2003) and Bigelli & Sánchez-Vidal (2012) report a positive relationship between cash holdings and profitability. Because of the fact that more profitable firms have potentially more investment opportunities that are also more profitable, such firms tend to have excess cash holdings (Demir & Ersan, 2017). Furthermore, the relationship between cash holdings and net working capital is investigated in many studies. Harford et al. (2008), Dittmar et al. (2003) and Boubakri et al. (2013) show that cash holdings is negatively correlated with net working capital. Dittmar et al. (2003) also state that net working capital is not only seen as a substitute of cash but also converting it into the cash is easy. Additionally; capital expenditure, bank debt, cash flow, payout ratio, R&D expense and multinationalism are mentioned as other determinants of cash holdings in the literature.
In this study, we examine the determinants of cash holdings in a developing country, namely Turkey. We use 3,557 firm-year observations from 2000 to 2016 belonging to 387 publicly traded firms in our analysis. We find that while firm size, leverage and net working capital have a negative; profitability and parliamentary elections have a positive impact on the cash holdings.
We contribute to the related literature by examining the financial determinants of cash holdings in a developing country, namely Turkey. In addition,
3
considering the findings of Jens (2017) and Smales (2016) showing the relationship between “elections and uncertainty” and Im et al. (2017) and Demir & Ersan (2017) indicating a positive association between “uncertainty and cash holdings”, we also examine the impacts of Turkish parliamentary elections on the cash holdings.
The rest of the paper as follows: Section 1 discusses the outlook of Turkish economy; Section 2 reviews the related literature; Section 3 develops the hypotheses; Section 4 explains the data and methodology; Section 5 describes our findings and we conclude our study in the last section.
4 SECTION 1
OUTLOOK OF THE TURKISH ECONOMY
In this part of the study, we discuss the Turkish economy. In this context, we provide some brief information and analysis from the points of GDP growth, unemployment and inflation.
1.1. GDP GROWTH
Turkish economy decreased by 1.3% in the third quarter of 2016 and grew by 3.5% in the last quarter of 2016 which was above expectations. Hence, the economy grew 2.9% annually in 2016. Considering the growth rate of 2015 (6.1%), it is clear that the economic activity of Turkey significantly slowed in 2016 (Deloitte, 2017). Definitely, the main reasons behind this decline was the unsuccessful putsch attempt on 15th of July and the increase of tension in the region (OECD Economic Outlook, 2017). While the main dynamic of the growth was private consumption for both the years 2015 and 2016, it seriously decreased in 2016. Additionally, the contribution of government expenditures to the growth rate increased in 2016 (Deloitte, 2017). Nevertheless, both private consumption and investment provide a positive support to recover the economy with the protective actions of government in 2016. In addition, exchange rate depreciation and increasing demand from Europe result a rise in goods exports which support growth (OECD Economic Outlook, 2017).
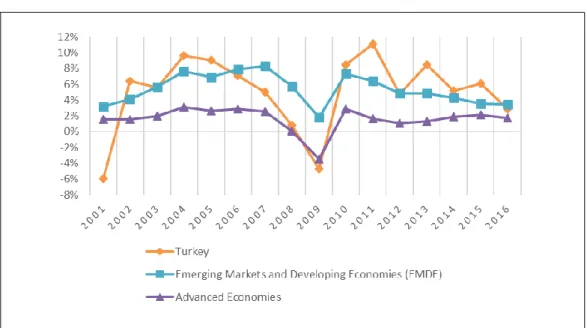
GDP growth rate of Turkey was negative only in 2009 over the past 15 years. In the same year, while the whole world was coping with a financial crisis, Turkish economy declined by 4.7%. The average growth rate of Turkish economy is 5.7% in the last 15 years. Moreover, GDP growth of Turkey performed better than or close to Emerging Markets and Developing Economies (EMDE) between the periods of 2002-2005 and 2010-2015. On the other hand, the GDP performance of Turkey fell behind the EMDE between the years of 2005-2010.
5
Growth rates of Turkey actualized higher than expected in 2017. Turkish economy grew 5% in the first quarter of 2017 and 5.1% in the second quarter of 2017. After the declaration of these growth ratios, the growth expectations of Turkey for 2017 has been revised by some international organizations such as IMF. According to the IMF, thanks to the recovery of exports after decreasing for several quarters and more expansionary fiscal policy, the production of Turkey was better than expected in the first quarter of 2017. Therefore, growth expectation of Turkey in 2017 has been revised from 2.5% to 5.1% (IMF, 2017).
Figure 1.1: GDP Growth Rates (%)
Source: http://databank.worldbank.org
1.2. UNEMPLOYMENT RATES
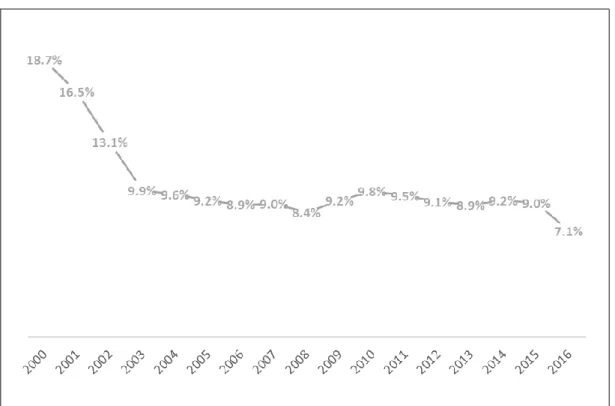
Unemployment in Turkey reached the highest level in 2009 by 13% over the past 15 years. After this peak, it had started to decrease and reached the lowest ratio (8.4%) in 2012. Unemployment rate in Turkey has followed an upward direction since 2012 and it reached to nearly 11.7% as of February 2017. Unlike Turkey, the OECD average unemployment rate has been decreasing since 2009 and it is 5.9% as of 2016 (OECD Employment Outlook, 2017). However, before the gap has started to diverge, unemployment rate of Turkey approached to the OECD average
6
in 2012 by reducing the difference up to only 0.4% points between two. In addition to these, while employment in Turkey has performed worse than Euro area from 2002 to 2010, the Turkish economy was more successful in reducing unemployment rates between the periods of 2011 to 2015 in comparison to Euro area. Because of the fact that unemployment rate of Euro area has been steadily declining contrary to Turkey since 2013, unemployment rate of Turkey surpassed Euro area as of 2016.
Employment of the population in Turkey aged 15-74 (48%) is lower than OECD average (61%) as of the last quarter of 2016. One of the most important reasons for this situation is that female employment rate of Turkey (27.9%) is still far below than OECD average. On the other hand, employment rate of Turkey has been increased from 40% in the second quarter of 2009 to 48% in 2016 (OECD Employment Outlook, 2017).
Figure 1.2: Annual Unemployment Rates (%)
Source: http://stats.oecd.org
1.3. INFLATION RATE
The consumer inflation in Turkey has followed an uptrend since December 2016 and it reached to 10.9% as of second quarter of 2017 with a limited decrease
7
in this quarter. The fall in oil prices and the appreciation of Turkish Lira in the recent months have a decisive role on this partial recovery. However, the support of demand conditions to the falling consumer inflation decreased as of second quarter of 2017 (Central Bank of the Republic of Turkey, 2017).
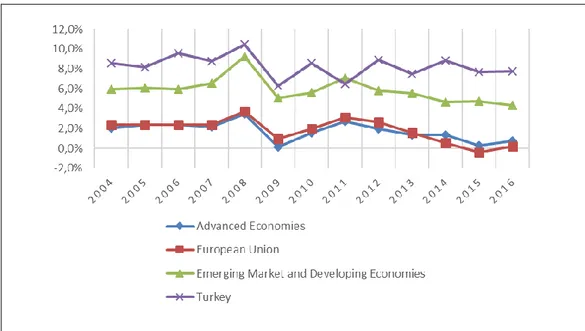
The average consumer inflation rates in Turkey reached to the lowest level in 2009 by the effect of global financial crisis. While the inflation rates in advanced economies, European Union and emerging markets and developing economies (EMDE) has followed a downward trend since 2011 to 2015, the rates of Turkey have fluctuated in the same period.
The average inflation rates of the last 13 years in Turkey and EMDE are 8, 3% and 5, 9% respectively. In addition to these, the inflation rates in Turkey decreased to the one-digit numbers as of 2004 and the average inflation rate in Turkey since 2000 to 2003 is 45%.
Figure 1.3: Inflation Rates (Average Consumer Prices, %)
8 SECTION 2 LITERATURE REVIEW
In this part of the study, firstly, we explain the reasons for cash holdings in the light of Keynes (1936) and some other studies. Secondly, we examine what the previous studies find as a determinant of cash holdings. We see that these 10 determinants of cash holdings are mostly mentioned in the studies: firm size, capital expenditure, bank debt, cash flow, leverage, payout ratio, profitability, R&D expenses, multinationalism and net working capital.
2.1. THE MOTIVES OF CASH HOLDINGS
In this part, we provide an overview by looking at Keynes (1936) in order to understand why cash is held by firms. Keynes (1936) provides a theoretical background of the reasons for cash holdings. According to him, cash is held because of 4 motives; income, business, precautionary and speculative-motives. Each of the motives are briefly explained on the following paragraphs respectively.
The first motive, related to income, posits that cash is held to make disbursement by income. In other words, cash is used to pay expenditures. He also points out that the strength of this motive depends on the amount of income and the length of the gap between income and expenditures. This explanation shows that (i) if the amount of income is higher than expenditures and (ii) the amount of income is high enough, the strength of the decision for holding cash would be increase.
The second motive, the business-motive, is similar to income motive. According to this motive, cash is held to pay the cost of business by sales revenue. As it is seen, it is very similar to the income motive. Because of this similarity, the income-motive and the business-motive are also classified under the one heading which is called transaction cost-motive.
The third motive explaining the reasons for cash holdings by economic actors like households, firms and institutions is precautionary motive. In view of this
9
motive, holding cash does not only provides a support to finance unexpected sudden expenditures but it also makes possible to benefit from unforeseen and advantageous opportunities such as purchasing. Furthermore, another reason for holding cash from the standpoint of the precautionary motive is to hold a fixed (in terms of money) asset to meet a fixed (in terms of money) liability that will possibly face in the future.
The strength of the foregoing three types of motives partly depend on whether the methods of obtaining cash are cheap or not and whether such methods are reliable or not. Therefore, if it is possible to obtain cash easily when it is needed, holding cash is not necessary. Additionally, the strength of first three motives also depend on the relative cost of holding cash. In this context, if the cash can be used only to purchase a profitable asset, it causes an increase on the cost of holding cash and a decrease on the strength of the motive. On the other hand, if earning interest from deposit and avoiding from bank charges are possible, this situation causes a decrease on the cost of holding cash and provide more incentive for holding cash.
According to Keynes (1936), the fourth motive which is partly different from the first three motives is speculative motive. The ones which hold cash for speculative motive think that they know what is going to happen in the future better than market. Therefore, they aim to obtain profit from such knowledge by holding cash. The amount of cash which is held for the transaction-motive and the precautionary-motive is basically a result of the amount of income and general economic system. Furthermore, such demand for cash is generally affected only when the general economic activity and the level of income are changed. Speculative motive is generally not affected by the things except these foregoing determinants. On the other hand, experiences show that the ones who hold cash for speculative-motive give a perpetual reaction when the interest rates change gradually. This can be seen as an exception of two main determinants of speculative motive.
10
2.2. THE DETERMINANTS OF CASH HOLDINGS
In this section of the study, we examine what the previous studies find about cash holdings. We see that these 10 determinants of cash holdings are mostly mentioned in the studies: firm size, capital expenditure, bank debt, cash flow, leverage, payout ratio, profitability, R&D expenses, multinationalism and net working capital.
2.2.1. Firm Size
Opler et al. (1999) argue that the level of cash and firm size is negatively correlated. They show this result by the examining the data of publicly traded U.S. companies between the years of 1971 and 1994. They also conclude that the firms which can easily obtain cash from financial markets when needed such as large firms do not prefer keeping excess cash (Opler, et al., 1999). Another study which is conducted by D'Mello et al. (2008) examine cash holding issue in the light of U.S. spin-offs which are formed by divesting a department or a segment of company into a new firm. According to this study which support that excess cash holdings and firm size are negatively correlated, the transaction cost of borrowing from capital market is higher for smaller firms (D'Mello, et al., 2008). Dittmar & Smith (2007) investigate the effects of corporate governance on the use and value of cash holdings and they use 13,095 observations as a final sample which belonging to 1,952 publicly traded U.S. firms in their study. They point out similar results and similar reasons for the association between size and the level of cash (Dittmar & Smith, 2007). They state that while size negatively determines the cash holding decision, large firms tend to keep more cash than small firms, in the cases of excess cash holding. Moreover, another paper finds changing results (Demir & Ersan, 2017). In this study, the association between economic policy uncertainty and cash holdings are examined by providing evidence from BRIC countries. Their data belongs 7007 firms and consists of the years from 2006 to 2015. According to the pooled results of this study there is a positive link between size and cash holdings. However, in view of country specific estimations, the effect of size on cash holding
11
is positive for only Indian firms but negative for other countries. The reason behind this result is that 54% of their data set consists of Indian firms which are relatively smaller and which have relatively lower cash level than the firms in Brazil, Russia and China. Because of the fact that there is a potentially positive link between cash holdings and size for such Indian firms, their results affect the pooled results directly. In addition to these studies, most of other studies also found a negative relationship between size and cash holding (Harford, et al., 2008; Kim, et al., 1998, Dittmar, et al., 2003).
Contrary to the arguments above, it is argued by Ozkan & Ozkan (2004) who use the data of U.K. companies between the period of 1984 and 1999 that firm size and cash holdings are positively correlated unlike other studies and it is probable that firms might decide to hold excess cash by considering other factors. According to this study, because of the fact that large firms generally make profit more than small firms and their growth possibility is higher compared to small firms, large firms may decide to keep excess cash (Ozkan & Ozkan, 2004).
2.2.2. Capital Expenditure
It is claimed that cash holding and capital expenditure are positively correlated but increasing excess cash has small impact on the capital expenditure (Opler, et al., 1999). According to this study, increase in the investment of the firms which hold cash above the predicted level is lower than the decrease in the investment of firms whose cash balance is below predicted level by the model (Opler, et al., 1999). In addition to these, they also find that even if the firms with cash surplus do not have investment opportunities well enough, their propensity to invest is still higher than other firms. Furthermore, the relationship between corporate governance and cash holding is investigated by Harford et al. (2008) and they use the data of 1,872 U.S. firms in this study. Because of the fact that the shareholder rights are powerfully protected and managers may be exposed to the punishments if the value of excess cash is destroyed, US firms which has weaker management hold less cash and such firms use excess cash on the capital
12
expenditures and acquisitions (Harford, et al., 2008). In addition to these studies, Kim et al. (2011) aim to find out which factors determine the levels of cash holding in the restaurant sector of the U.S. and they use the data of 125 publicly traded companies since 1997 to 2008 in their study. According to their findings, there is a negative correlation between excess cash holdings and capital expenditure that restaurant firms canalize excess cash to the buying assets. Buying assets not only contributes to improve borrowing capability but it also reduces the need for holding cash in high levels (Kim, et al., 2011). Moreover, Liu et al. (2014) examines the impacts of CEO inside debt on the cash holdings in the U.S. with sample of 6,009 firm-year data between 2006 and 2011. In this study, they find out a positive relationship between CEO inside debt and cash holding decision (Liu, et al., 2014). Additionally, this study posits that larger firms which have more acquisition activities and higher CAPEX/net assets ratio have more investment activities and they hold less cash in comparison to smaller firms (Liu, et al., 2014).
2.2.3. Bank Debt
The firms which hold cash in lower levels have also more bank debt because such firms which have close relationships with banks do not need to hold excess cash and obtaining cash from capital markets is easier for these firms (Ozkan & Ozkan, 2004). Another study which compares bank loans and publicly traded debt suggest that the firms which have higher probability to be in financial distress prefer to borrow from banks despite accepting higher interest rates than publicly traded loans (Chemmanur & Fulghieri, 1994). Because of the fact that banks make better decisions (liquidation or renegotiation) than bondholders when the borrowing firm face financial difficulty, the companies which have a higher probability of having financial distress are more likely to incline to bank debts. Considering this rationale, such firms believe that the good relationships they build up with banks help them in cases of financial distress (Chemmanur & Fulghieri, 1994). Based on this arguments, the propensity of cash holding of the firms which have good relations with banks may be low and this may support the negative association between the level of cash and bank debt. In addition to these, García-Teruel & Martínez-Solano
13
(2008) examine the issue of corporate cash holding through small and medium-sized firms (SME) of Spain and their sample consists of the data belongs to 860 firms between the years of 1996-2001. According to this study, Spanish SME’s which hold cash in lower levels have higher bank debt and this contributes to lower the cost of external financing by decreasing the agency costs and asymmetrical information between firms and banks (García-Teruel & Martínez-Solano, 2008). Another study conducted by Ferreira & Vilela (2004) provide evidence from EMU (European Economic and Monetary Union) countries and they use the data (6,387 firm years observations) of publicly traded firms between the years of 1987 and 2000. As well as Ferreira & Vilela (2004) supports the negative link between cash holdings and bank debt, they also posits that banks are more successful to evaluate the credit quality of firms and to follow up and control their financial strategies.
2.2.4. Cash Flow
It is argued that cash flow has positive effect on the cash holdings whereas the firms with higher level of internal liquid sources tend to accumulate and use these for paying debt in date of maturity, the other firms with lower level of internal funds prefer to reduce the cash holdings and increase debt (Opler, et al., 1999). They also point out that the most important reason which pushes firms to keep excess cash as much as they can is defending themselves (Opler, et al., 1999). Moreover, Ozkan & Ozkan (2004) confirm the positive relationship between cash holding and cash flow. They also propose that firms which have higher cash flows tend to raise internal funds instead of external finance and this drives firm to hold cash in higher levels (Ozkan & Ozkan, 2004). According to Ozkan & Ozkan (2004), another reason why such firms hold excess cash is that they do not want to expose to give up important investment opportunities because of cash deficit. Furthermore, the study which explores the relationship between financial constraints and the demand of liquidity with the data of publicly traded manufacturing companies provides empirical evidence that the firms exposed to financial constraints tend to response to higher cash flows by increasing both liquid assets and cash levels (Almeida, et al., 2004). However, they claim that there is no systematic patterns about the
14
positive relationship between cash flows and cash holdings of the firms without any financial constraints (Almeida, et al., 2004). According to another study, because of the fact that the managers of the firms that have weak governance prefer to spend their current cash flow instead of saving cash which can provide them flexibility in the future, have cash in lower levels (Harford, et al., 2008). Moreover, the aim of the research of Račić & Stanišić (2017) is to analyze cash holdings issue through Serbian firms with a data consists of 2,352 non-financial firms from 14 different sectors between the years of 2008 and 2013. They declare that cash flow has a positive effect on the cash holdings and, Serbian firms hold more cash when their cash flows are high. Because of the fact the financial industry is dominated by banks and interest rates are relatively high (especially during the research dates) in Serbia, Serbian companies which have high cash flows may incline to prefer internal financing by holding more cash.
Unlike the studies above, the study of Kim et al. (1998) do not support the positive impact of cash flow on the cash holdings. Because of the fact that companies can pay the expenses and borrowings by high cash flow which is seen an available internal financial source, higher cash flow has negative impact on the cash holdings.
2.2.5. Leverage
Guney et al. (2007) investigate cash holding issue by the data of 4,069 firms from Germany, Japan, the UK, France and US between the years of 1996 and 2000. They state that although there is a negative relationship between cash holding and leverage at the lower levels of leverage, they found the propensity of holding cash for the firms with higher leverage is positive. According to them, in spite of the fact that leverage is initially seen as an instrument which can be used in place of cash, leverage at higher levels is also regarded as a factor increases the probability of financial difficulty. The latter argument pushes the firms to reduce the financial risk by accumulating cash (Guney, et al., 2007). In addition to this study, while Ozkan & Ozkan (2004) share the view that high leverage ratio may also increase the cash
15
holdings because of the same reasons mentioned in the previous study, they declare that leverage is negatively correlated with cash holdings. According to them, as well as leverage can be preferred in place of cash, another reason why borrowing is preferred instead of holding cash is that the cost of leverage is lower compared to cash holdings (Ozkan & Ozkan, 2004). Furthermore, Al-Najjar (2013) examines the cash holdings from the point of four developing countries which are Brazil (83 companies), China (494 companies), India (542 companies) and Russia (93 companies) and a comparison is made between these firms and other firms from U.K. (204 companies) and U.S. (576 companies). As a result of the study, although it is found that leverage and cash holding are negatively correlated for Indian, Chinese and Russian firms, there is no strong evidence which shows the impact of the leverage on cash holdings for Brazilian firms (Al-Najjar, 2013). In addition, it is also stated that the result of the firms from developed countries are nearly similar to the firms from developing countries (Al-Najjar, 2013). Moreover, Ferreira & Vilela (2004) support the view that higher leverage has negative impact on the cash holdings and according to them, this result is supported by pecking order and free cash flow theories. They state that according to pecking order theory, when the investments are more than retained earnings, it causes to high leverage and less cash holdings. If the investments are less than retained earnings, the results would be vice-versa (Ferreira & Vilela, 2004). Likewise, it is suggested as an another reason explaining the negative link between cash holdings and leverage in the light of the free cash flow theory is that the firms with higher debts have the higher probability of being monitored by the capital markets, therefore, it leads such firms to keep cash in lower levels (Ferreira & Vilela, 2004). Fernandes et al. (2017) examine the reasons for keeping cash among publicly traded firms from Portugal and their data consists of 24 firms between the period of 2005 and 2009. The study finds that Portuguese firms prefer to hold cash in lower levels while their leverage increase. The reason explaining the finding is that Portuguese firms can easily access to the funds, especially after joining the European Union (Fernandes, et al., 2017). It is additionally stated in this study that firms prefer to borrow instead of accumulating cash when the debt is easily available and its cost is low.
16 2.2.6. Payout Ratio
Al-Najjar (2013) examines firms from 4 different countries. Whereas payout ratio is positively associated with the level of cash holdings for Brazilian firms, the result of Russian firms is just the opposite. The result of Brazilian firms is explained that additional external borrowing is not so easy for the less profitable of these firms which might pay dividends in order to gain reputation, hence, such firms prefer to hold cash to become ready in case of any financial difficulty (Al-Najjar, 2013). On the other hand, there is no evidence proving the impact of payout ratio on the cash holdings for Indian and Chinese firms (Al-Najjar, 2013). Another study suggest that when the firms which pay dividend need to cash, they have an option to decrease the amount of dividends instead of borrowing from external sources. However, it is not possible for the firms which do not pay dividends (Opler, et al., 1999). Due to such an argument, the firms which pay dividends or which have higher payout ratios might tend to hold less cash than the firms which do not pay dividends or which have lower payout ratios. Another study point out that the firms holding cash in high levels prefer to pay dividends in common rates and they do not tend to pay unusual amounts (Mikkelson & Partch, 2003). It may be thought that this claim is against to the view that cash holdings and payout ratios are positively correlated. Furthermore, it is suggested that dividend has a positive impact on the cash holding of German firms and it has negative impact on the U.S. firms while there is no significant link between cash holding and dividends for the firms from UK, Japan and France (Guney, et al., 2007). In addition, according to the pooled results of the study, Guney et al. (2007) posit that there is a negative relationship between cash holdings and payout ratio. However, Harford et al. (2008) find that cash holding level and payout ratio are positively associated. Therefore, while the level of cash holding increases, firms tend to pay dividend in higher ratios. Additionally, the methods of payout of excess cash depend on the governance of firms. While the firms which are governed strongly prefer to pay dividend and promise to increase the level of dividend in the future, the firms which have weaker governance prefer
17
to repurchase stocks and do not promise anything about future payouts such as strongly governed firms.
Another study which is conducted by Al-Najjar & Belghitar (2011) investigate the same subject by using the data of nearly 400 U.K. non-financial firms between the years of 1991-2008. Unlike other studies, they adopt different approach to investigate the relationship between cash holdings and dividend. They aim to find relationship between such variables by considering simultaneity (Al-Najjar & Belghitar, 2011). According to the results, because of the fact that cash holdings and dividends have same determinants and they are also determined by each other, it seems that they have not significant effects on the each other’s when the endogeneity is controlled.
In addition to the studies above, Dittmar et al. (2003) investigate the impacts of international corporate governance on cash holdings. As a result, they find that the firms from the countries where the rights of shareholders are not protected well pay less dividends.
2.2.7. Profitability
Dittmar et al. (2003) examine the impacts of corporate governance on the cash holdings and their sample consist of more than 11,000 companies from 45 countries. They find that there is a positive relationship between cash holdings and profitability. Moreover, Bigelli & Sánchez-Vidal (2012) examines cash holding issue by considering private firms from Italia. They support the view of previous study and they state that the firms with more cash holdings are more profitable. Demir & Ersan (2017) report a positive effect of profitability on cash holdings. According to them, because of the fact that more profitable firms have potentially more investment opportunities which are also more profitable, such firms have excess cash holdings.
Al-Najjar (2013) finds different results about relationship between cash holdings and profitability that such relation is positive for Russian firms while it is vice versa
18
for Brazil firms. In addition to this, enough evidence is not found to support negative or positive correlation between the level of cash and profitability for the Indian firms and only little evidence exists which support the negative relationship between such variables for the Chinese firms in this study (Al-Najjar, 2013). Another study states that holding cash in high levels can have negative effects on firm value via low profitability in the short run or long run and it can also push firms to make acquisitions which may be thought as a value reducing action. (Harford, et al., 2008). Moreover, this study also claims that the profitability and valuations of the firms which hold cash in excess levels and which have low shareholder rights are lower (Harford, et al., 2008).
2.2.8. R&D Expenses
Chen (2008) investigates how cash holding is affected from the corporate governance. According to this study, “new economy firms” which operate in the computer, software, Internet, telecommunication or networking industries have high return possibilities (Chen, 2008). Because of this, such firms also need high levels of cash unlike old economy firms and hold high levels of cash which is a natural result of the necessity of need for cash (Chen, 2008). Moreover, this study also states that the firms with high research and development expenses are exposed to high firm risk (Chen, 2008). Thus, they prefer to hold cash in excessive levels in order to be prevented from the probable financial distress (Chen, 2008). Another study support the view that the firms which have R&D expenses in high levels are also expected to hold excess cash (Ramírez & Tadesse, 2009). Furthermore, Liu, et al. (2014) declare that the firms with larger growth opportunities which can be inferred from higher market to book and R&D/sales ratios also prefer to hold cash in higher levels. In addition to these, Gao et al. (2013) investigate the determinants of corporate cash holdings by comparing the private and public U.S. firms. According to them, capital expenditures and acquisitions are negatively correlated with cash holding decision. They also posit that public companies increase their R&D investments when they have excess cash. In addition, such firms are more likely tend to use excess cash on the short-term projects unlike private firms.
19
Another finding of this study is that the firms which have better governance are more prone to use their excess cash for the R&D investments. Furthermore, Opler et al. (1999) expect and find a positive relationship between R&D expenses and cash holdings.
Unlike the studies above, Harford et al. (2008) posit that there is generally no relationship between cash holdings and R&D expenses. However, they find that the firms with low shareholder rights and excess cash have less R&D investments.
2.2.9. Multinationalism
Ramírez & Tadesse (2009) examine how the level of cash holdings, uncertainty avoidance and multinationalism are correlated with each other and their data consist of the firms from 49 countries. According to the study, both uncertainty avoidance and multinationalism are separately positively correlated with cash holdings that the firms which operate in the countries with high uncertainty avoidance and which are multinational prefer to hold cash in excessive levels (Ramírez & Tadesse, 2009). It is also stated that multinationalism moderates the effects of national culture on the cash holding decision (Ramírez & Tadesse, 2009). Arata et al. (2015) investigate the relationship between the cash holdings and internalization and they use data of Brazilian and Mexican non-financial firms between the years of 2010 and 2016. They confirm the positive association between multinationalism and the cash holding level (Arata, et al., 2015). According to them, while the degree of the internalization of the firms in Brazil and Mexico increases, such firms also tend to increase their cash holding level. Moreover, they state that the excess cash levels increase more than the degree of internalization in such countries. Because of the fact that such firms easily access to financial resources in these countries, they may prefer to invest to the fixed income funds with accumulated cash (Arata, et al., 2015). In addition, Gao et al. (2013) state that multinational firms prefer to keep the cash in higher levels than other firms because of taking into account the tax issues.
20 2.2.10. Net Working Capital
It is found out that the firms which have lower cash holdings tend to have net working capital (NWC) at higher levels (Harford, et al., 2008). Because of the fact that NWC can be used instead of cash and it can be easily converted into cash, the companies which have net working capital in high levels prefer to keep cash in the lower levels (Dittmar, et al., 2003). Another study also find out that NWC has a significant and negative impact on the cash holdings (Boubakri, et al., 2013). As a reason of such a negative association, they posit that short term assets can be used in place of cash. Ferreira & Vilela (2004) provide empirical evidence that there is a negative correlation between cash holdings and NWC. Additionally, they declare that the companies which keep liquid assets in higher levels are also predicted to have cash in lower levels according to trade-off model. Furthermore, another paper belonging to Ozkan & Ozkan (2004) and indicating a negative association between the mentioned variables suggest that companies can convert the non-cash liquid assets into cash with less costs than other assets. Because of this, the firms with high liquid assets which are other than cash may not prefer to keep cash in high levels and they may not prefer borrowing from capital markets.
21 SECTION 3
HYPOTHESIS DEVELOPMENT
In this section of the paper, we propose and explain our hypotheses. We examine firm size, leverage, profitability, capital expenditure and payout ratio as determinants of cash holding for Turkish firms.
3.1. CASH HOLDINGS
Cash holding is our dependent variable. There are different approaches to the measuring cash holdings. While Harford et al. (2008) use the cash to total sales as a primary ratio of cash holdings, they also look at the ratio of cash and marketable securities to the net assets which is calculated by subtracting cash and marketable securities from total assets. Ozkan & Ozkan (2004) measure the cash holdings by the ratio of cash and cash equivalents to total assets. Boubakri, et al. (2013) use the ratio of cash and cash equivalents to net assets (total assets minus cash and cash equivalents) and they also look at ratios of “cash to total assets” and “cash to total sales as a sensitivity check.
Considering the literature above, we fundamentally use the ratio of cash and cash equivalents to total assets in order to measure cash holdings. Furthermore, we aim to make a sensitivity check and we also look at the ratio of cash and cash equivalents to net assets which is calculated as total asset minus cash and cash equivalents.
3.2. FIRM SIZE
Large firms do not prefer holding excess cash as they can easily access financial markets (Opler, et al., 1999). As transaction cost of borrowing is higher for small firms, they tend to hold cash in higher levels (D'Mello, et al., 2008). Some of other studies find that company size is negatively associated with the level of cash holdings. (Dittmar & Smith 2007, Harford et al. 2008, Kim et al. 1998, Dittmar et al. 2003). However, Ozkan & Ozkan (2004) find positive link between cash
22
holdings and firm size that larger firms keep more cash as they make more profit and have more growth opportunities.
Following Opler et al. (1999), Harford et al. (2008) and Ozkan & Ozkan, (2004), we measure the size as the logarithm of total assets.
Considering the studies above, we expect a negative relationship between size and cash holdings.
H1. There is a negative relationship between firm size and cash holdings. 3.3. LEVERAGE
Leverage is initially (at lower levels) seen as an instrument which can be used in place of cash. However, leverage at higher levels is also regarded as a factor which increases the probability of financial difficulty and this argument pushes the firms to reduce the financial risk by accumulating cash (Guney, et al., 2007). According to another study which support the negative relationship between related variables, leverage is not only seen as a substitute for cash but also its cost is lower compared to cost of keeping cash (Ozkan & Ozkan, 2004). Ferreira & Vilela (2004) declare that when the investments are more than retained earnings, this situation causes to high leverage and less cash holdings and if the investments are less than retained earnings, the results would be vice-versa. Fernandes et al. (2017) find negative link between cash holdings and leverage that firms prefer to borrow instead of accumulating cash when the debt is easily available and its cost is low.
Leverage of the firms is generally measured by the ratio of total debt (short term and long term) to total assets in the literature (See e.g. Opler et al., 1999; Al-Najjar 2013; Ozkan & Ozkan, 2004, Guney et al., 2007). Thus, we measure the leverage by the ratio of total debt to total assets.
Based on the studies above, we expect that leverage is negatively associated with cash holdings.
23
H2. There is a negative relationship between leverage and cash holdings. 3.4. PROFITABILITY
It is found that the firms with more cash holdings are more profitable (Bigelli & Sánchez-Vidal, 2012). Moreover, more profitable firms have potentially more investment opportunities which are also more profitable, such firms have excess cash holdings (Demir & Ersan, 2017). However, excess cash can have negative effects on firm value via low profitability in the short run or long run and it can also push firms to make acquisitions which may be thought as a value reducing action (Harford, et al., 2008).
Profitability is measured by different approaches in the literature. While Bigelli & Sánchez-Vidal (2012) prefer to measure it through the ratio of operating income to total assets, Demir & Ersan (2017) use the return on assets ratio (ROA). In addition to these, Al-Najjar (2013) use the ratio of return on equity (ROE) in order to measure profitability. In our analysis, we measure the profitability by ROE. In addition, we measure the profitability by two more alternative methods. First, we measure the profitability by return on assets (ROA). Second, we use profit margin. Taken into consideration these studies, we estimate a positive link between cash holding and profitability.
H3. There is a positive relationship between profitability and cash holdings. 3.5. NET WORKING CAPITAL
Firms which have lower cash holdings tend to have net working capital at higher levels (Harford, et al., 2008). Because of the fact that NWC can be used instead of cash and it can be easily converted into cash, the firms which have net working capital in high levels prefer to keep cash in the lower levels (Dittmar, et al., 2003). Because the liquid assets can be easily converted into the cash when there is a need for cash, the firms with high liquid assets are expected to hold less cash according to trade-off model (Ferreira & Vilela, 2004). Ozkan & Ozkan (2004)
24
suggest that firms can convert the liquid assets which are other than cash into cash with less costs than other assets. Because of this, the firms with high liquid assets which are other than cash may not prefer to keep cash in high levels and they may not prefer borrowing from capital markets.
Net working capital is generally measured by the ratio of net working capital net of cash to net assets (See e.g. Ozkan & Ozkan, 2004; Dittmar et al., 2003). We measure the net working capital with the same approach which is the ratio of current assets minus current liabilities minus cash and cash equivalents to net assets.
Considering the studies above, we expect that NWC is negatively correlated with cash holdings.
H4. There is a negative relationship between leverage and cash holdings. 3.6. PARLIMENTIARY ELECTIONS
Jens (2017) finds that the volatility of the U.S. firms is higher in the years in which elections of governor are made and it is lower in the non-election years. This is because of the fact that political uncertainty and thereby, firm level uncertainty is higher before elections of governor. Another study provides empirical evidence that the market uncertainty of Australia is significantly affected by the uncertainty which stems from Australian Federal Election (Smales, 2016).
As it is shown the studies above, there is a direct link between uncertainty and elections that an uncertainty may be created by elections. Therefore, such an uncertainty has several effects on the decisions of firms and markets. Furthermore, there is also a relationship between uncertainty and cash holdings. According to Im et al. (2017), firms which face uncertainty reduce investments and increase cash holdings. It is also stated in this study that the firms which consider high uncertainty hold cash more than twice compared to the firms which consider low uncertainty. Demir & Ersan (2017) declare that economic policy uncertainty has a positive impact on the cash holdings for BRIC (Brazil, Russia, India, China) countries.
25
According to them, the reason behind this positive link between such dependent and independent variables may be consist of the view of the firms which is hedging the uncertainty by increasing cash holdings. In addition, they also posit that firms increase cash holdings by precautionary behavior in the case of high uncertainty. Furthermore, Bhaduri & Kanti (2011) report a positive relationship between cash holdings and both macroeconomic and firm level uncertainties. They state that when uncertainty increases economy become more volatile and firms become more cautious and thereby, Indian companies tend to keep cash in higher levels. However, Xu et al. (2016) investigate how political uncertainty is correlated with the cash holding decision through Chinese firms and they suggest that political uncertainty has negative effect on cash holdings. They declare that Chinese firm prefer to hold less cash in the first year after a new government official is being appointed to a city. Because hiding cash and liquid asset is safer for firms in case of political uncertainty, they prefer to transfer such assets to related firms.
Demir & Ersan (2017) measures the uncertainty by EPU (Economic Policy Uncertainty) Index. Im, et al. (2017) use the standard deviation of a firm’s daily stock returns in order to measure firm-level uncertainty. Bhaduri & Kanti (2011) measure the macro economic uncertainty by conditional variance of consumer price index (CPI) and gross domestic product (GDP). Xu et al. (2016) measure the uncertainty by a dummy variable which equals to 1 if it is the first year of new official and zero if it is not.
As it is stated above in light of the literature, elections can cause to an uncertainty and it is positively correlated with uncertainty. In addition, according to the papers above, firm level uncertainty, economic policy uncertainty and political uncertainty have positive effects on cash holdings. Furthermore, parliamentary elections are always very important in Turkey and it may affect several decisions of firms. Taken into consideration all of these arguments, we use parliamentary elections as a measure of uncertainty. As the measure of election, we take the year of election and before the year of election.
26
Considering the studies above, we expect a positive relationship between cash holdings and parliamentary elections in Turkey. In other words, we expect that cash holdings of the firms increase in the year and before the year of parliamentary elections in Turkey.
27 SECTION 4
DATA AND METHODOLOGY
In this part of the study, we explain the details of our sample and then, we introduce the model used.
4.1. SAMPLE
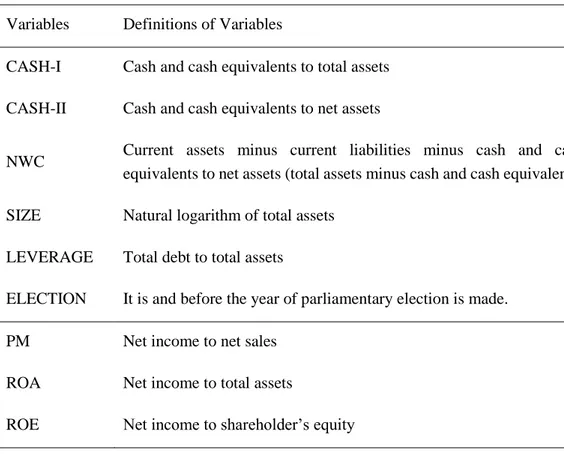
We obtain our data from OSIRIS database. It consists of the year from 2000 to 2016 and contains 387 firms which are traded in Borsa İstanbul (BIST). We exclude the observations of financial companies. Due to missing observations, we have an unbalanced data set. There are total 3557 firm-year observations. In order to exclude the extreme values, the values are winsorized at the 1% and 99% levels (See e.g. Boubakri, et al., 2013). Thus, we aim to ensure that our results are not driven by small number of observations and outliers (See e.g. Harford, et al., 2008). We give the definitions of variables in Table 4.1.
Table 4.1: Definitions of Variables
Variables Definitions of Variables
CASH-I Cash and cash equivalents to total assets
CASH-II Cash and cash equivalents to net assets
NWC Current assets minus current liabilities minus cash and cash equivalents to net assets (total assets minus cash and cash equivalents)
SIZE Natural logarithm of total assets
LEVERAGE Total debt to total assets
ELECTION It is and before the year of parliamentary election is made.
PM Net income to net sales
ROA Net income to total assets
28 4.2. DESCRIPTIVE STATISTICS
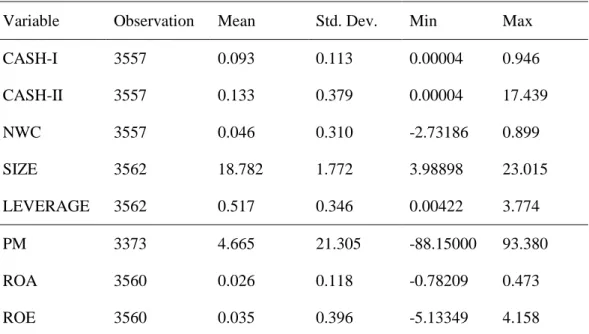
We give the descriptive statistics of variables which are cash-I, cash-II, NWC (net working capital), size, leverage, PM (profit margin), ROA (return on assets) and ROE (return on equity) in Table 4.2.
Table 4.2: Descriptive Statistics
Variable Observation Mean Std. Dev. Min Max CASH-I 3557 0.093 0.113 0.00004 0.946 CASH-II 3557 0.133 0.379 0.00004 17.439 NWC 3557 0.046 0.310 -2.73186 0.899 SIZE 3562 18.782 1.772 3.98898 23.015 LEVERAGE 3562 0.517 0.346 0.00422 3.774 PM 3373 4.665 21.305 -88.15000 93.380 ROA 3560 0.026 0.118 -0.78209 0.473 ROE 3560 0.035 0.396 -5.13349 4.158
Note: CASH-I is the first cash ratio, cash and cash equivalents to total assets; CASH-II is the second cash ratio, cash and cash equivalents to net assets (total assets minus cash and cash equivalents); NWC is the ratio of current assets minus current liabilities minus cash and cash equivalents to net assets (total assets minus cash and cash equivalents); SİZE is the natural logarithm of total assets; LEVERAGE is leverage ratio, total debt to total assets; PM is profit margin, net income to net sales; ROA is return on asset ratio, net income to total assets; ROE is return on equity ratio, net income to shareholder’s equity.
The mean ratio of cash-I which is calculated as the ratio of cash and cash equivalents divided by total assets is 9.3%. The mean ratio of cash-II which is calculated as the ratio of cash and cash equivalents divided by net assets is 13.3%. Al-Najjar (2013) examines the factors affecting the decision of keeping cash in some of the emerging countries and makes a comparison between such countries and control samples from UK and US. It is found out in this study that cash to total asset ratio of Brazil, Russia, India, China, UK and US are 2.2%, 4.8%, 3.3%, 3.4%, 10.1% and 7.8% respectively. The ratios of UK and US firms in this study are close to the ratio of Turkish firms while others are not. Although Turkey is also an
29
emerging country, its mean cash ratio is much more than other emerging markets mentioned in this study. It seems that Turkish firms prefer to hold more cash than such countries. Furthermore, the ratio of cash and cash equivalents to total assets for Italian firms is found 10%, close to the Turkish firms (Bigelli & Sánchez-Vidal, 2012).
The mean leverage ratio of Turkish firms is 51.7%. Al-Najjar (2013) finds leverage ratio of Brazil, Russia, India, China, UK and US 31.2%, 21.8%, 30.8%, 27.3%, 23.1% and 17.6% respectively. The leverage ratio in UK is found 16.2% in the study of Ozkan & Ozkan (2004). Additionally, Ferreira & Vilela (2004) report the leverage ratio of EMU countries (Germany, France, Netherlands, Italy, Spain, Finland, Belgium, Austria, Ireland, Luxemburg, Greece and Portugal) as 24.8%. It seems that the leverage ratio of Turkish firms are higher than all of these countries. However, Wang et al. (2014) report in their study which contains the data of Chinese listed companies from 2003 to 2012 that the leverage for China as 49% which is close to our finding for Turkish firms.
30
We give the average cash holding ratios of Turkish firms in Figure 4.1. There is a dramatic decline on the average cash ratios of Turkish firms in the period of 2000 - 2003. The average ratios of Turkish firms have fluctuated between 9.9% and 8.4% from 2004 to 2015. Then, the ratio decreased to 7.1% in 2016.
4.3. METHODOLOGY
We use panel data method in our analysis. A longitudinal, or panel, data set is one that follows a given sample of individuals over time, and thus provides multiple observations on each individual in the sample. Panel data sets for economic research possess several major advantages over conventional cross-sectional or time-series data sets. Panel data gives the researcher a large number of data points, increasing the degrees of freedom and reducing the collinearity among explanatory variables-hence improving the efficiency of econometric estimates. (Hsiao, pp.1-3, 2003).
In panel data approach, fixed effects model or random effects model can be implemented. In order to decide which model will be implemented, the mostly used way is using the Hausman test which determines the more efficient model to be used. We run the Hausman test and the fixed effect model is chosen for all of the regressions according to it.
We run the following estimations: Regression I:
CASH-Iit = Β1NWCit + Β2SIZEit + Β3LEVERAGEit + Β4ROEit + αt + uit
CASH-Iit = Β1NWCit + Β2SIZEit + Β3LEVERAGEit + Β4ROAit + αt + uit
31 Regression II:
CASH-IIit = Β1NWCit + Β2SIZEit + Β3LEVERAGEit + Β4ROEit + αt + uit
CASH-IIit = Β1NWCit + Β2SIZEit + Β3LEVERAGEit + Β4ROAit + αt + uit
CASH-IIit = Β1NWCit + Β2SIZEit + Β3LEVERAGEit + Β4PMit + αt + uit
Regression III:
CASH-Iit = Β1NWCit + Β2SIZEit + Β3LEVERAGEit + Β4ROAit + Β5ELECTIONit + αt
32 SECTION 5
FINDINGS
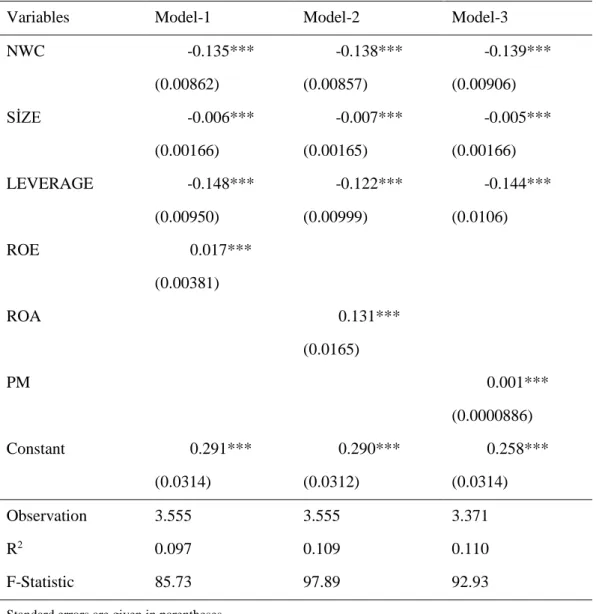
Table 5.1 presents results of the first regression in which cash and cash equivalents to total assets (cash-I) is used as a dependent variable. There are three models because of measuring the profitability by three different values. In Model 1, profitability is measured by ROE. We use ROA and profit margin in Model 2 and Model 3 respectively as a variable of profitability.
The results show that there is a significant and negative relationship between net working capital (NWC) and cash holdings. This means that the firms with higher NWC hold cash in lower levels. The results are consistent with the findings of Harford et al. (2008). Our findings also indicate that converting NWC into cash is easy and it is seen as a substitute instead of cash (Dittmar, et al., 2003). Our results are in line with Hypothesis 4 (H4) and prior studies which are citied and mentioned in the sections of hypothesis development and literature review.
We expect and find a negative relationship between size and cash holdings. We show that size has not only negative but also a significant impact on cash holdings. This indicates that large firms do not hold excess cash as they can easily access financial markets (Opler, et al., 1999). Our findings are also in line with D'Mello et al. (2008) that because transaction cost of borrowing is higher for small firms, such firms hold cash in higher levels. The results are consistent with most of the studies which are given in the section of literature review.
In consistent with our expectations, we find a negative relationship between leverage and cash holdings. This result suggests that the level of cash holdings increases when leverage decreases. The association between them is statistically significant at 1%. The reason for this negative link is that leverage is seen as a substitute of cash and its cost is lower than holding cash (Ozkan & Ozkan, 2004). Such a negative association is also in line with the pecking order theory that indicates when the investments are higher than retained earnings, it causes to high leverage and less cash holdings (Ferreira & Vilela, 2004).
33
Table 5.1: Regression Estimations-I
Variables Model-1 Model-2 Model-3
NWC -0.135*** -0.138*** -0.139*** (0.00862) (0.00857) (0.00906) SİZE -0.006*** -0.007*** -0.005*** (0.00166) (0.00165) (0.00166) LEVERAGE -0.148*** -0.122*** -0.144*** (0.00950) (0.00999) (0.0106) ROE 0.017*** (0.00381) ROA 0.131*** (0.0165) PM 0.001*** (0.0000886) Constant 0.291*** 0.290*** 0.258*** (0.0314) (0.0312) (0.0314) Observation 3.555 3.555 3.371 R2 0.097 0.109 0.110 F-Statistic 85.73 97.89 92.93
Standard errors are given in parentheses.
* Significant at 10% level, * * Significant at 5% level, * * * Significant at 1% level
Note: NWC is the ratio of current assets minus current liabilities minus cash and cash equivalents to net assets (total assets minus cash and cash equivalents); SİZE is the natural logarithm of total assets; LEVERAGE is leverage ratio, total debt to total assets; PM is profit margin, net income to net sales; ROA is return on asset ratio, net income to total assets; ROE is return on equity ratio, net income to shareholder’s equity.
In line with our hypotheses, profitability has a significant and positive impact on cash holdings. It means that the more profitable the firms are, the more cash they hold. We use three different variables which are ROE, ROA and profit margin in order to measure profitability. We perform three models of regressions
34
with using each of them. We obtain a positive and significant results from each of the models. Our findings is consistent with the argument of Demir & Ersan (2017) that more profitable firms have potentially more investment opportunities which are also more profitable and such firms have excess cash holdings. Our results are also in line with the arguments of Bigelli & Sánchez-Vidal (2012).
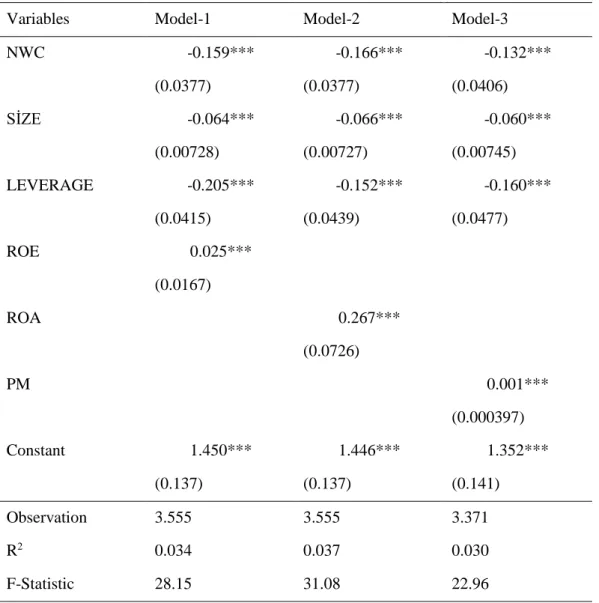
Table 5.2: Regression Estimations-II
Variables Model-1 Model-2 Model-3
NWC -0.159*** -0.166*** -0.132*** (0.0377) (0.0377) (0.0406) SİZE -0.064*** -0.066*** -0.060*** (0.00728) (0.00727) (0.00745) LEVERAGE -0.205*** -0.152*** -0.160*** (0.0415) (0.0439) (0.0477) ROE 0.025*** (0.0167) ROA 0.267*** (0.0726) PM 0.001*** (0.000397) Constant 1.450*** 1.446*** 1.352*** (0.137) (0.137) (0.141) Observation 3.555 3.555 3.371 R2 0.034 0.037 0.030 F-Statistic 28.15 31.08 22.96
Standard errors are given in parentheses.
35
Table 5.2 shows results of the second regression in which the ratio of cash and cash equivalents to total assets net of cash and cash equivalents (cash-II) is used as the dependent variable. The only difference between Regression-I and Regression-II is measuring the cash ratio differently. As a result of performing second regression, we find the similar results with first regression. The direction and significance of the association between variables are similar in Regression-I and Regression-II for each of the three models. As a result, we report similar results with two different cash ratios.
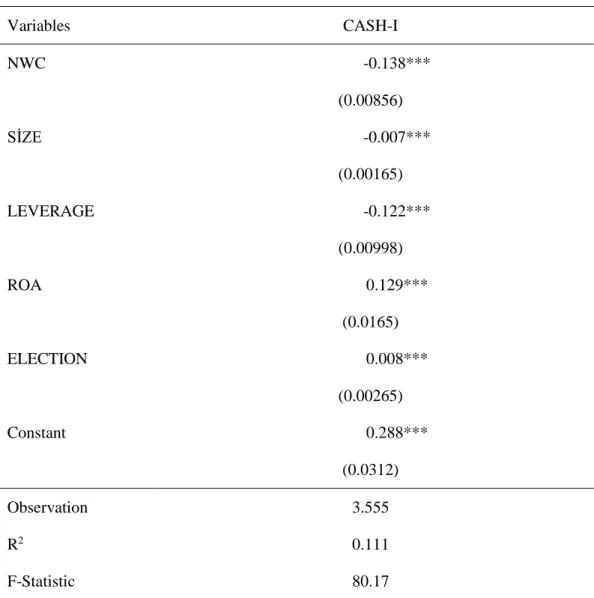
Table 5.3 presents the result of third regression which we include the parliamentary election as another independent variable. In this regression we use the Cash-I ratio as a measure of cash and ROA as a measure of profitability. The other independent variables which are NWC, size and leverage are the same with first two regressions.
In this third regression estimation, we expect and find a positive link between cash holdings and parliamentary elections. This suggest that firms increase their cash holdings in and before the year of parliamentary elections. This may because of the fact that firms aim to hedge uncertainty by excess cash holdings (Demir & Ersan, 2017). The reason for this result can also be explained that firms are more cautious and economies are more volatile in the case of uncertainty occurs (Bhaduri & Kanti, 2011).
36
Table 5.3: Regression Estimations-III
Variables CASH-I NWC -0.138*** (0.00856) SİZE -0.007*** (0.00165) LEVERAGE -0.122*** (0.00998) ROA 0.129*** (0.0165) ELECTION 0.008*** (0.00265) Constant 0.288*** (0.0312) Observation 3.555 R2 0.111 F-Statistic 80.17
Standard errors are given in parentheses.