Journal of Neuroscience Methods 346 (2020) 108946
Available online 12 September 2020
0165-0270/© 2020 Elsevier B.V. All rights reserved.
Myelin detection in fluorescence microscopy images using
machine learning
Sibel Çimen Yetis¸
a, Abdulkerim Çapar
b, Dursun A. Ekinci
b, Umut E. Ayten
a, Bilal E. Kerman
c,*
,
B. U˘gur T¨oreyin
b,*
aYildiz Technical University, Dept. of Electronics and Communication Engineering, Istanbul, Turkey bIstanbul Technical University, Informatics Institute, Istanbul, Turkey
cIstanbul Medipol University, Dept. of Embryology and Histology, Istanbul, Turkey
A R T I C L E I N F O Keywords:
Myelin detection Fluorescence image analysis Machine learning Supervised learning Deep learning Myelin quantification
A B S T R A C T
Background: The myelin sheath produced by glial cells insulates the axons, and supports the function of the nervous system. Myelin sheath degeneration causes neurodegenerative disorders, such as multiple sclerosis (MS). There are no therapies for MS that promote remyelination. Drug discovery frequently involves screening thou-sands of compounds. However, this is not feasible for remyelination drugs, since myelin quantification is a manual labor-intensive endeavor. Therefore, the development of assistive software for expedited myelin detec-tion is instrumental for MS drug discovery by enabling high-content image-based drug screens.
New method: In this study, we developed a machine learning based expedited myelin detection approach in fluorescence microscopy images. Multi-channel three-dimensional microscopy images of a mouse stem cell-based myelination assay were labeled by experts. A spectro-spatial feature extraction method was introduced to represent local dependencies of voxels both in spatial and spectral domains. Feature extraction yielded two data set of over forty-seven thousand annotated images in total.
Results: Myelin detection performances of 23 different supervised machine learning techniques including a customized-convolutional neural network (CNN), were assessed using various train/test split ratios of the data sets. The highest accuracy values of 98.84 ± 0.09% and 98.46 ± 0.11% were achieved by Boosted Trees and customized-CNN, respectively.
Comparison with existing methods: Our approach can detect myelin in a common experimental setup. Myelin extending in any orientation in 3 dimensions is segmented from 3 channel z-stack fluorescence images. Conclusions: Our results suggest that the proposed expedited myelin detection approach is a feasible and robust method for remyelination drug screening.
1. Introduction
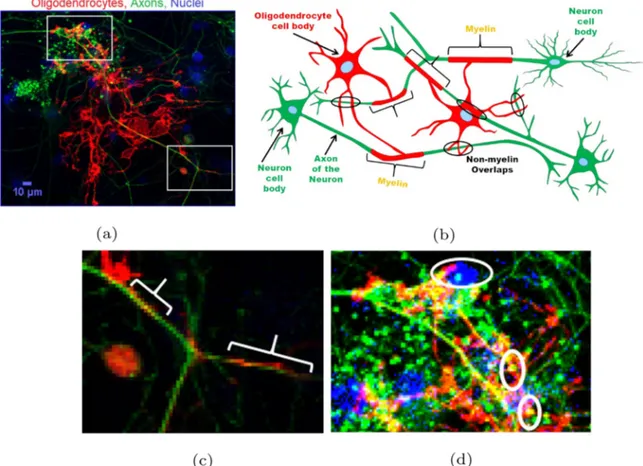
Myelin is a cholesterol-rich extension of the cell membranes of oli-godendrocytes, specialized glial cells of the central nervous system (CNS) wrapping axons of neurons as seen in Fig. 1. Insulation provided by multiple layers of oligodendrocyte membrane surrounding the axon increases the speed and efficiency of neuronal signal transmission and supports the survival of neurons (Aydınli et al., 2016; Simons and Nave, 2016). Myelin is an essential structure for the function of the neuron, thus, any damage to myelin disrupts the nervous system leading to diseases such as multiple sclerosis (MS). Approximately 2.5 million people suffer from MS worldwide, making it the most prevalent
neuroinflammatory disease (Reich et al., 2018; Thompson et al., 2018). A combination of genetic and environmental factors trigger the immune system to attack and destroy CNS myelin. Current therapies reduce demyelination by suppressing the immune system but do not cure the disease (Aydınli et al., 2016; Reich et al., 2018; Thompson et al., 2018). The search for chemical compounds that promote myelin regeneration (remyelination) is in progress; however, there are no drugs that are currently in the clinical use (Reich et al., 2018; Cole et al., 2017).
The drug discovery process frequently starts with screening thou-sands or tens of thouthou-sands of compounds in a disease relevant assay (Cole et al., 2017). In the compound screens for treatment of MS, maturation status of oligodendrocytes is frequently used as a proxy for
* Corresponding authors.
E-mail addresses: [email protected] (B.E. Kerman), [email protected] (B.U. T¨oreyin).
Contents lists available at ScienceDirect
Journal of Neuroscience Methods
journal homepage: www.elsevier.com/locate/jneumeth
https://doi.org/10.1016/j.jneumeth.2020.108946
myelination (Cole et al., 2017; Boucanova et al., 2018). Mature oligo-dendrocytes are identified by gene expression and/or cellular morphology. Image acquisition and simple image analysis can be auto-mated for myelin detection in order to expedite recognition of the pos-itive hits, which may reach over 1000 per screen (Cole et al., 2017;
Boucanova et al., 2018; Deshmukh et al., 2013). However, only a small
fraction of these compounds actually increase remyelination under closer scrutiny. Out of eight published screens encompassing hundreds of thousands of chemicals, only five molecules have been found to enhance remyelination in laboratory animals (Cole et al., 2017). This high attrition rate suggests MS and remyelination drug discovery can be more efficient if myelin is quantified directly instead of the proxy, oligodendrocyte maturation. However, in its current form, myelin quantification is a time consuming and labor intensive manual endeavor
(Cole et al., 2017; Naito et al., 2017; Kerman et al., 2015; Danelakis
et al., 2018) that hampers screening of large numbers of compounds.
Therefore, rapid and effective myelin detection will expedite drug dis-covery for MS by enabling high-content image-based drug screens (Cole et al., 2017).
Automated detection of myelin by image analysis is challenging because myelin is observed as an overlapping region of the oligoden-drocyte process and the axon of the neuron (Fig. 1a, 1b, 1c). The expert researchers are trained to distinguish random overlapping regions
(Fig. 1d) from the actual myelin using criteria such as size, shape,
pro-cess length, and continuity. Efforts for accelerating this propro-cess up to now focused on the extraction of co-localizing pixels from fluorescent images (Kerman et al., 2015; Zhang et al., 2011; Kreft et al., 2004). Despite such methods successfully quantified myelin from large data sets
and detected changes in myelination ratios in a disease model and after drug treatment (Kerman et al., 2015; Ettle et al., 2016), identifying overlapping pixels as myelin increases false positives due to random co-localization between cellular processes (Fig. 1d). A simple size filter is not effective, because myelin may extend in z-dimension and may be visible as only a small projection in single imaging planes. Thus, a filter based on size may remove myelin, as well as, random overlaps, resulting in underestimation of total myelin. In order to account for the shape and size of overlapping regions in myelin identification, we turned to ma-chine learning-based image classification. Mama-chine-learning based ap-proaches discover latent relationships within data (Zaimi et al., 2016,
2018; Kilinc et al., 2009). Recently, they have been used for segmenting
and highlighting cells within the brain in fluorescent microscopy images
(Kayasandik and Labate, 2016; Salvi et al., 2019). Specifically,
myelin-like structures were detected in optical images (Xu et al., 2019). Moreover, myelinated axons were segmented in optical and electron microscopy images (Naito et al., 2017; Janjic et al., 2019). Hence, they pose as a perfect match for the myelin detection problem.
Inspired by the advancement of machine learning in automation of bio-image analysis, previously, we developed a LeNet algorithm based myelin detection method, DeepMQ, achieving a 93.38% accuracy on a data set sized 10,768 images (Cimen et al., 2018). DeepMQ, significantly expedited myelin detection by classifying images in seconds compared to days of manual classification. In order to further investigate the ef-ficacy of machine learning techniques on myelin detection, in the cur-rent study, we developed a customized-CNN and compared it to other classification methods on expanded and new data sets. Specifically, number of images in the data set was almost tripled to 30,895 and a data
Fig. 1. Demonstration of myelin and non-myelin overlaps in co-cultures and a schematic drawing. (a) A sample RGB-composite, maximum intensity projection image of myelinating co-cultures. Myelin is observed as an overlapping region of the oligodendrocyte process membrane and axon of the neuron as well as non-myelin overlaps.The red, green and blue channels correspond to oligodendrocytes, axons, and nuclei respectively. The image is a projection of five optical z-sections. (b) Represents a schematic of the co-culture highlighting myelin regions (brackets) and non-myelin overlaps (ellipses). The higher magnification images of the boxed areas show (c) myelin (brackets), and (d) non-myelin overlaps. Upper ellipse: presence of a nucleus identifies this co-localization as overlapping cell body. Lower ellipses: short and discontinuous overlaps. (For interpretation of the references to color in this figure legend, the reader is referred to the web version of this article.)
set of 17,672 images was analyzed, compared to our earlier study. Moreover, myelin detection performances of five different supervised machine learning techniques (23 different variants; cf. Table 1) were assessed with varying sizes of train/test split ratios of the annotated data set. Additionally, a pre-processing step comprising of contrast enhancement is introduced and its effect on detection performance of different methods were determined. Among all test scenarios, the highest accuracy value of 98.84 ± 0.09% was achieved by Boosted Trees on 15,452 pre-processed images and the customized-CNN was a close second with 98.46%. This accuracy value was achieved for the parti-tioning of the total labeled data as 50% training and 50% test sets. In addition, Boosted Trees reached over 96% accuracy values for an additional data set that is half as large. Customized-CNN reached close to 90% accuracy on this additional data set despite being trained on the former data set. Thus, both techniques were robust in detecting myelin accurately from various images. Finally, classified results were visual-ized on the images for the evaluation of the expert and the user. In conclusion, machine learning, specifically Boosted Trees and our customized-CNN, techniques can assist researchers in MS drug discovery by expediting myelin detection. The organization of this paper is as follows. Section 2 describes the methodology implemented to detect myelin. Section 3 presents our results of the methods applied in Section
2. Finally, Section 4 presents our conclusions and a discussion on the implications of our research.
2. Methodology
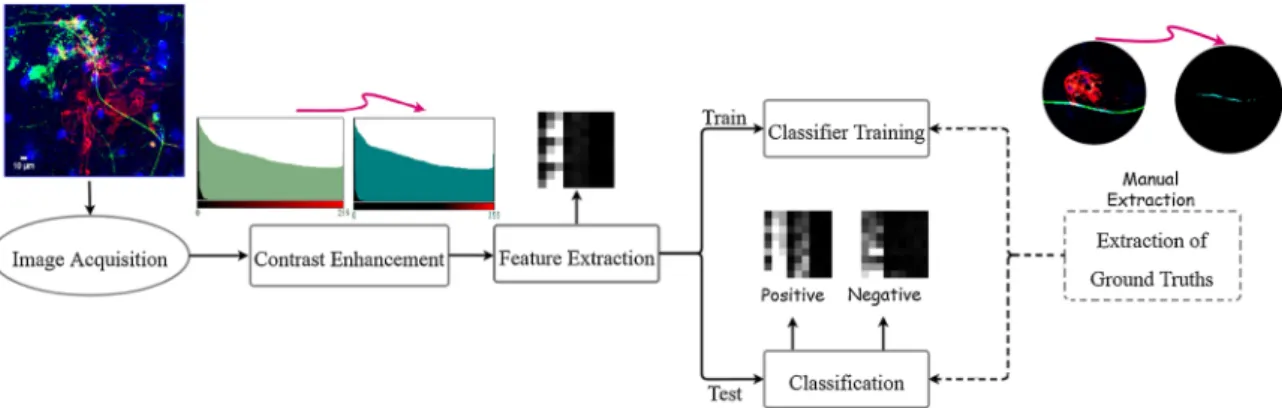
The proposed approach to expedite myelin detection is comprised of the following stages: 1. Image Acquisition, 2. Pre-processing, 3. Anno-tation: Myelin Ground Truths, 4. Feature Image Extraction, and 5. Classification (cf. Fig. 2). Details of each step are described below.
2.1. Image acquisition
Part of the images was previously used for myelin quantification in
Kerman et al. (2015). Briefly, myelinating co-cultures of
oligodendro-cytes and neurons were fixed in 4% para-formaldehyde-PBS for 15 min, blocked and permeabilized with horse serum (10%) and Triton X-100 (0.1%) in PBS. Cells were incubated overnight with 1:1000 mouse or rabbit anti-TUJ1 (Covance) and 1:50 rat anti-MBP (Serotec) primary antibodies to mark neurons and oligodendrocytes, respectively. DAPI (Sigma) was used to visualize nuclei.
Images were acquired on Zeiss LSM 710 or 780 confocal micro-scopes. Images were acquired as tiles encompassing approximately 2 mm × 7 mm area of five independent experiments. The z-axis, 30–50 μm is covered by 1 μm apart optical z-sections. The tiles, with
10% overlap, were stitched together on Zen software (Zeiss) to obtain approximately 2k px × 8k px images covering entire experimental area of five independent experiments. 14 images were acquired using 0.5 μm
z-stack resolution. The z-axis, 16–60 μm is covered by 0.5 μm apart
op-tical z-sections. 0.5 μm images were used to evaluate versatility of the
selected methods.
Images were composed of three 8-bit-quantized channels corre-sponding to MBP antibody (oligodendrocytes), TUJ1 antibody (neu-rons), and DAPI, pseudo-colored in red (R), green (G) and blue (B), respectively. The RGB-composite z-section image, A, is denoted as, A(x,
y,z,w), where x ∈ {1,…,X}, y ∈ {1,…,Y}, z ∈ {1,…,Z}, and w ∈ {1,2,3}.
The size of A is X × Y × Z × 3. A sample RGB-composite image corre-sponding to a particular z-section and spatial location, of size 447 × 373 px is presented in Fig. 1a, where, channels corresponding to oligodendrocyte, axon, and nuclei are represented with R, G, and B channels, respectively.
2.2. Pre-processing
In the pre-processing stage, contrast enhancement was carried out for each channel on ImageJ platform (Schneider and Rasband, 2012) by an expert. Expert visually inspected images and selected a reference layer where oligodendrocyte, axon, and cell nuclei are most prominent. Then, expert adjusted linear stretching parameters (minimum and maximum intensity values) for each channel image. Pre-processing stage yielded images with wider-range luminance values than those of input images. This, in turn, facilitated further analysis for myelin detection. Contrast enhancement stage was followed by feature image extraction (cf. Section 2.4).
2.3. Annotation: myelin ground truths
Myelin ground truth extraction is a tedious work and the sole moti-vation of this study is to expedite it. Still, in order to evaluate the per-formance of expedited myelin detection schemes, one needs to manually annotate myelin regions and obtain the myelin ground truths. Therefore, in this study, ground truths were determined manually by the expert with the help of a software and another expert. In total, labeled myelin images yielded 30,905 and 17,672 feature images from both data sets.
The overall strategy for myelin ground truth extraction was sum-marized in Supplemental Fig. 1. First, “Computer-assisted Evaluation of Myelin (CEM) software”, which was developed to identify myelin, was utilized (Kerman et al., 2015). Binary output images of CEM software represented the candidate myelin pixels for each z-section. The expert meticulously inspected the RGB-composite z-section image and compared it simultaneously with the output of CEM software, to decide on keeping or removing candidate pixels. By doing so, the expert made sure that the myelin pixels’ continuity along z-axis and conformity across channels were satisfied. Consequently, myelin ground truth im-ages were obtained.
2.4. Feature image extraction
Exploiting the domain expertise on myelin detection, a novel two- dimensional spectro-spatial feature image, F, of size 9 × 9 px, was introduced. Traversing through the RGB-composite z-section image, A, a specific F(x,y,z)feature image was composed of each and every voxel at
location (x, y, z) in A (Cimen et al., 2018). The spectro-spatial feature,
F(x,y,z), contained channel intensity values corresponding to the voxel at
location (x,y,z), and its immediate 26-neighboring voxels (cf. Fig. 3).
F(x,y,z)was composed of 9 smaller blocks, D(z,w), of size 3 × 3 px,
corre-sponding to a particular z-section and channel, w, pair, (z, w). This particular composition of the feature image made it possible to reveal myelin pixels’ continuity along z-axis and conformity across channels. The correspondence between the spectro-spatial feature image F(x,y,z)
and the z-section-channel block D(z,w)is given as follows: Table 1
Classification methods used in the study. 23 variants of 5 supervised machine learning techniques were assessed for their myelin detection performances.
Deep Learning Methods Decision Tree
LeNet Complex Tree
Customized-CNN Medium Tree
Discriminant &Regression Simple Tree
Linear Discriminant RUSBoosted Tree
Quadratic Discriminant Boosted Trees
Subspace Discriminant Bagged Tree
Logistic Regression SVM
k-NN Linear SVM
Fine k-NN Quadratic SVM
Medium k-NN Cubic SVM
Coarse k-NN Fine Gaussian SVM
Cosine k-NN Medium Gaussian SVM
F(x,y,z)(c, d) = D( z+(⌈c
3⌉− 2),⌈d3⌉
)([(c − 1)mod3] + 1, [(d − 1)mod3] + 1) (1) where c and d take values from the set {1, 2, …, 9}. Similarly, the cor-respondence between the z-section-channel block D and the RGB-
composite z-section image A is given as follows:
D(z,w)(a, b) = A(x + (a − 2), y + (b − 2), z, w) (2)
where a, b, and w take values from the set {1,2,3}, From (1) and (2) one gets:
Fig. 2. Procedure steps. Details of each step are given in the text.
Fig. 3. A spectro-spatial feature image, F(x,y,z), corresponding to each voxel, is composed of 9 smaller blocks, D(z,w), a central voxel and its immediate 26-neighboring voxels in the oligodendrocyte (red), axon (green), and nucleus (blue) channels. One of these nine blocks, namely, D(z,2), is pointed out. (For interpretation of the references to color in this figure legend, the reader is referred to the web version of this article.)
Fig. 4. Examples of positive and negative spectro-spatial feature images. (a) Positive sample: A positive image demonstrating the overlap between red and green channels. (b) Negative sample: The overlap is much smaller resulting in negative classification. (c) Negative sample: Signal in the blue (nuclei) channel identifies this image as an overlapping cell body. (For interpretation of the references to color in this figure legend, the reader is referred to the web version of this article.)
F(x,y,z)(a, b) = A(x + (([(c − 1)mod3] + 1) − 2), y + (([(d − 1)mod3] + 1) − 2), (z + (⌈c 3⌉ − 2)), ⌈ d 3⌉). (3) which represents the correspondence between A(x,y,z,w)and F(x,y,z).
Fig. 4 represents examples of spectro-spatial feature images classified as positive, myelin containing, and negative, myelin not present. The positive image (Fig. 4a) was taken from a region where oligodendrocyte process (red) enveloped the axon (green) for a substantial length (see also Fig. 1). This overlap is also apparent in the feature image. A small and/or discontinuous overlap between oligodendrocyte and axon was classified as negative (Fig. 4b). Additionally, the overlap between oligodendrocyte cell body, which is described by the presence of the nucleus (blue), and the axon was classified as negative. The cell body is identified by the presence of the nucleus (Fig. 4c).
2.5. Classification
The obtained two-dimensional spectro-spatial feature images, F(x,y,z),
were given as input to 23 variants of 5 supervised machine learning techniques including Deep Learning, Discriminant & Regression, k- Nearest Neighbors (k-NN), Decision Tree, Support Vector Machine (SVM) to make classification. In order to find the most efficient classifier of myelin classification, we developed our own customized-CNN to classify myelin pixels and compared it to the most commonly used machine learning methods. Table 1 shows all classification methods used in this study. Model optimization was performed in these classifiers for non pre-processed and pre-processed images. The results of the best performing classifiers for each technique are detailed in Section 3.
Our CNN architecture accepts 9 × 9 spectro-spatial feature images,
F(x,y,z), as input. The parameters and the architecture of the customized-
CNN architecture are shown in Table 2 and Fig. 5. The first convolu-tional layer contains 32 filters size of 5 × 5. The output of this con-volutional layer enters a max pooling layer of kernel size 3 × 3, strides are defined as 2. This layer is followed by two convolution layers 64 filters size of 3 × 3 and a 3 × 3 max pooling layer whose stride is 2. Before Batch Normalization, 2 × 2 convolution layer with 128 feature and after batch normalization, 256-node fully connected layer is applied. Batch normalization is used for faster convergence (Çiçek et al., 2016). Iteration per epoch was chosen as 150 and 15 epochs of training were proceed. Output layer of customized-CNN architecture has two nodes corresponding to myelin and non-myelin classes. Parameter space of our CNN architecture is 105.
3. Results
The data set used for training and test of all methods included 15,489 positive and 15,416 negative feature images extracted from 1 μm z-stack
images. The data sets used for evaluating the versatility of the selected
methods included 8710 positive and 8962 negative feature images extracted from 0.5 μm z-stack resolution images. Training and test
ex-periments were performed on a computer with Intel i7 7700HQ pro-cessor, 16 GB RAM, Asus GeForce GTX1080TI graphics card. Ground truths for biological samples, especially for myelin, are often difficult to extract (Kerman et al., 2015; Xu et al., 2019). In order to determine the minimal amount of myelin ground truths required for training, 10%, 25%, 50%, 75%, and 90% of the data set was used for training and the remaining portion of the data set was used for test. Test accuracy of each classifier was calculated by averaging ten runs while standard deviation was calculated to measure variation (Tables 3 and 4) for selected clas-sifiers. The effect of contrast enhancement process, as described in Section 2.2, can be observed by comparing Tables 3 and 4.
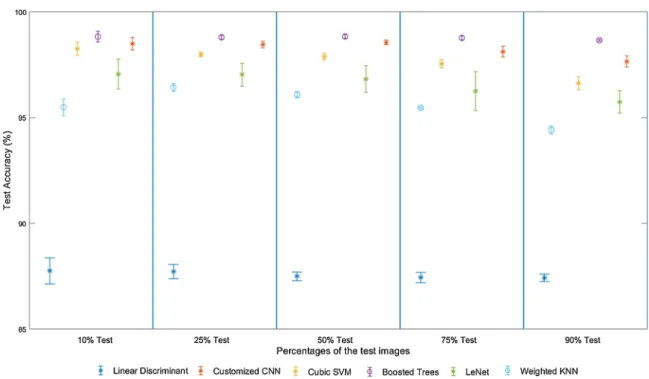
Test accuracies for selected classifiers with respect to test/training percentages (Table 4) and their standard deviations are graphed in
Fig. 6. Increasing training data had a positive effect on CNNs as expected
and increased performance rates. Accuracies of other classifiers also, tended to increase with the increasing training data. Boosted Trees achieved higher performance than other classifiers with lower standard deviations and fewer training data and the closest results were achieved by customized-CNN. Contrast enhancement increased the test accuracies for all methods (compare Tables 3 and 4). A reason for this observed phenomenon may be that while the starting images were under satu-rated, overlapping pixels became more prominent after the contrast enhancement.
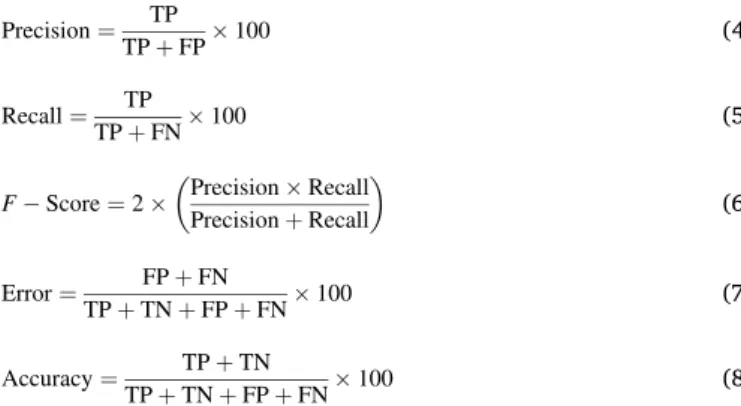
Confusion matrix values of Boosted Trees and customized-CNN classification results are presented in Table 5. According to the confu-sion matrix, performance metrics (Preciconfu-sion, Recall, F-score, Error, and Accuracy) were calculated and results are presented in Table 6. These parameters were calculated as follows:
Precision = TP TP + FP×100 (4) Recall = TP TP + FN×100 (5) F − Score = 2 × ( Precision × Recall Precision + Recall ) (6) Error = FP + FN TP + TN + FP + FN×100 (7) Accuracy = TP + TN TP + TN + FP + FN×100 (8) where, TP, TN, FP, FN correspond to the True Positive, True Negative, False Positive and False Negative respectively.
Performance metrics of Boosted Trees (Precision, Recall, F-score, Error, and Accuracy) were calculated with the 0.5 μm z-stack resolution
images and results are presented in Table 7. The data set of 8710 positive and 8962 negative feature images were split into 10%, 25%, 50%, 75%, and 90% training and test sets. The results were comparable to the 1 μm
z-stack resolution images (compare Tables 6 and 7). The observed dif-ferences may be due to fewer number of images i.e. the data set was approximately half as large. Effect of contrast enhancement was less pronounced.
Next, the performance of customized-CNN was evaluated on the 0.5 μm z-stack resolution images. Because the data set was not large
enough to split into training and test sets, networks trained with un-processed or contrast enhanced 1 μm z-stack resolution images were
tested. The number of training images were varied as in Tables 3 and 4. The results were presented in Table 8. The accuracy reached up to 86.19% for the unprocessed and 90.15% for the contrast enhanced im-ages, suggesting that customized-CNN is robust enough to detect myelin in various data sets without training.
Finally, myelin detected by the customized-CNN was visualized on
Table 2
Parameters of customized CNN.
Layers Custom CNN Output size
c1 [conv, 5 × 5, 32], stride 2, padding 2 5 × 5 × 32 m1 max pool, 3 × 3, stride 2,padding 1 3 × 3 × 32 c2 [[conv, 3 × 3, 64], stride 1] × 2 3 × 3 × 64 c3 [[conv, 3 × 3, 64], stride 1] × 2 3 × 3 × 64
m2 max pool, 3 × 3, stride 2 2 × 2 × 64
c4 [conv, 2 × 2, 128], stride 1 1 × 1 × 128
fc1 fc, 256 1 × 1 × 256
fc2 fc, 2 1 × 1 × 2
s1 Soft Max 1 × 1 × 2
the original composite images (Fig. 7). The algorithm correctly detected myelin as a continuous overlap (bracket) between oligodendrocytes and axons. However, a non-continuous pixel was also classified as myelin (circle). This post-visualization step enables evaluation of the results by the user.
4. Discussion and conclusion
Myelin, which is an indispensable part of the nervous system is damaged in neurodegenerative diseases such as MS (Aydınli et al., 2016;
Reich et al., 2018; Thompson et al., 2018; Cole et al., 2017). However,
currently available therapies against MS fail to regenerate myelin. A major obstacle in discovering remyelinating drugs is the difficulty of
quantifying myelin in chemical screens (Cole et al., 2017; Naito et al.,
2017; Kerman et al., 2015). Automated myelin detection can improve
the speed and efficiency of the process yet it is challenging to setup a platform that can perform with minimal user input and as accurately as an expert. Previously, we developed a CNN algorithm, DeepMQ, to expedite myelin detection (Cimen et al., 2018). Supporting the need for expedited myelin quantification, others (Xu et al., 2019), also developed a U-Net based algorithm to detect myelin-like structures, which formed on nanofibers. The nanofibers were used as artificial axon substitutes because they can be aligned parallel to each other and allow easier classification. However, this limits the generalizability of the method because the axons grow in many directions crisscrossing each other. In the current study, 23 different machine learning methods, including a
Fig. 5. Customized CNN architecture (see also Table 2). Table 3
Train and test accuracies for selected classifiers on unprocessed images.
Train and test accuracies (%)
Test images (%)a 10 25 50 75 90
Training images (%)a 90 75 50 25 10
Subspace Discriminant Training Acc. 74.99 ± 0.84 74.90 ± 0.34 74.91 ± 0.20 74.75 ± 0.17 74.49 ± 0.22 Test Acc. 75.07 ± 0.87 75.01 ± 0.33 74.98 ± 0.21 74.79 ± 0.19 74.53 ± 0.23
Weighted k-NN Training Acc. 100 100 100 100 100
Test Acc. 91.94 ± 0.60 91.68 ± 0.33 91.09 ± 0.20 89.88 ± 0.35 88.20 ± 0.12 Cubic SVM Training Acc. 97.62 ± 0.51 97.48 ± 0.65 97.93 ± 0.29 96.87 ± 0.39 94.08 ± 0.31 Test Acc. 94.51 ± 0.51 94.64 ± 0.64 94.02 ± 0.30 93.21 ± 0.41 91.58 ± 0.33 Boosted Trees Training Acc. 96.39 ± 0.30 96.39 ± 0.35 96.66 ± 0.12 95.76 ± 0.23 95.37 ± 0.13 Test Acc. 95.91 ± 0.31 95.94 ± 0.35 95.87 ± 0.13 95.76 ± 0.23 95.37 ± 0.13 LeNet Training Acc. 95.23 ± 0.63 95.19 ± 1.59 94.27 ± 0.93 93.86 ± 1.37 92.23 ± 2.21 Test Acc. 94.00 ± 0.62 93.45 ± 1.65 93.74 ± 0.88 92.75 ± 1.41 90.76 ± 2.19 Customized CNN Training Acc. 97.86 ± 0.48 97.92 ± 0.28 97.74 ± 0.22 98.13 ± 0.19 95.87 ± 0.42 Test Acc. 95.93 ± 0.50 95.77 ± 0.29 95.51 ± 0.22 95.01 ± 0.19 94.39 ± 0.40
aAn equal percentage of positive and negative images were randomly selected from the data set to form the train and test image sets.
Table 4
Test accuracies for selected classifiers on contrast enhanced images.
Training and test accuracies (%)
Test images (%)a 10 25 50 75 90
Training images (%)a 90 75 50 25 10
Linear Discriminant Training Acc. 87.65 ± 0.64 87.67 ± 0.37 87.51 ± 0.30 87.43 ± 0.23 87.45 ± 0.19 Test Acc. 87.76 ± 0.62 87.72 ± 0.33 87.50 ± 0.20 87.44 ± 0.24 87.43 ± 0.18
Weighted k-NN Training Acc. 100 100 100 100 100
Test Acc. 96.49 ± 0.40 96.42 ± 0.19 96.09 ± 0.15 95.47 ± 0.04 94.42 ± 0.19 Cubic SVM Training Acc. 99.32 ± 0.30 99.44 ± 0.09 99.42 ± 0.15 99.38 ± 0.18 96.97 ± 0.28 Test Acc. 98.26 ± 0.31 97.99 ± 0.11 97.88 ± 0.16 97.55 ± 0.20 96.63 ± 0.31 Boosted Trees Training Acc. 99.12 ± 0.24 98.80 ± 0.10 99.16 ± 0.07 98.95 ± 0.10 98.92 ± 0.03 Test Acc. 98.83 ± 0.25 98.80 ± 0.09 98.84 ± 0.09 98.77 ± 0.10 98.66 ± 0.05 LeNet Training Acc. 97.90 ± 0.67 97.86 ± 0.51 97.45 ± 0.60 97.02 ± 0.89 96.58 ± 0.79 Test Acc. 97.06 ± 0.71 97.04 ± 0.54 96.82 ± 0.63 96.25 ± 0.92 95.74 ± 0.53 Customized-CNN Training Acc. 99.31 ± 0.25 99.46 ± 0.15 99.40 ± 0.09 99.25 ± 0.23 98.99 ± 0.25 Test Acc. 98.50 ± 0.29 98.46 ± 0.16 98.46 ± 0.11 98.12 ± 0.25 97.66 ± 0.26
custom CNN specifically designed for detection, were evaluated for myelin detection on unprocessed and pre-processed images. Overall, Boosted Trees and customized-CNN achieved the highest accuracy values on both unprocessed and pre-processed images (Tables 3 and 4).
Discriminant & Regression methods performed worse staying below 90% accuracy even on pre-processed images. For all the methods, contrast enhancement increased accuracy by up to approximately 13 percentage points. The best performing methods reached over 98% ac-curacy after pre-processing. In current study, optimum contrast levels for the images were determined by the expert. The future myelin quantification work-flows will benefit from expediting of this pre-processing step. Apart from the improvement in detection perfor-mance, contrast enhancement in the pre-processing stage prevents our approach to be a fully-automated myelin detector. This is due to the fact that enhancement parameters should be determined for each individual image by expert inspection. Improper enhancement parameters esti-mated by automatic methods can cause image loss or noise amplification in medical images (Agarwal and Mahajan, 2018). In addition, we assessed how the amount of labeled training data affects the perfor-mance of the 23 machine learning methods for 5 different cases. As expected, increasing the number of training images increased the ac-curacy in general. Having said that, a smaller training set yields suffi-ciently accurate myelin classification results for Decision Tree based methods. Previous myelin quantification efforts have been focused on deep learning based approaches (Cimen et al., 2018; Xu et al., 2019). However, in our study, CNN based methods did not perform as well as Boosted Trees based myelin detection method for the data set under consideration (Table 4).
Confusion matrix (Table 5) shows that positive images were detected more accurately than the negative images for each split cases. In addi-tion, number of false negatives was more than number of false positives.
Fig. 6. Test accuracies for the selected classifiers with their standard deviations were plotted for comparison. Table 5
Confusion matrices of the top two classifiers on contrast enhanced images. Boosted Trees Customized-CNN
Predicted values
Actual values Number of test/ training images
+ − + − + 1544 5 1534 15 3095/27,840 − 31 1515 31 1515 + 3860 12 3843 29 7737/23,198 − 81 3784 90 3775 + 7734 10 7672 72 15,474/15,461 − 169 7561 167 7563 + 11,590 17 11,391 216 23,202/7733 − 269 11,326 219 11,376 + 13,929 11 13,839 101 27,854/3081 − 363 13,551 549 13,365 Table 6
Test accuracies of the best performing classifiers for different split cases on contrast enhanced images.
Boosted Trees Customized-CNN
Test images
(%) Training images (%) Precision (%) Recall (%) F-Score (%) Error (%) Accuracy (%) Precision (%) Recall (%) F-Score (%) Error (%) Accuracy (%)
10 90 99.67 98.03 98.85 1.16 98.83 99.03 98.02 98.50 1.49 98.50
25 75 99.69 97.94 98.81 1.20 98.80 99.25 97.71 98.48 1.54 98.46
50 50 99.87 97.86 98.86 1.16 98.84 99.07 97.87 98.47 1.54 98.46
75 25 99.85 97.70 98.78 1.23 98.77 98.14 98.11 98.13 1.87 98.12
This shows that both Boosted Trees and customized-CNN overlooked the myelin regions. Boosted Trees and customized-CNN showed similar performance while Boosted Trees were good at positives in case of 10–90% (cf. Table 5). Customized-CNN worked more accurate on negative images in cases of 50–50% and 75–25% (cf. Table 5). Comparing and contrasting the missed myelin regions for both algo-rithms may help designing better myelin detection tools in the future.
To further assess the generalization aspect of the proposed expedited myelin detection approach, we conducted detection tests for 0.5 μm z-
stack resolution images (cf. Tables 7 and 8). Boosted Trees algorithm yielded similar performance results for images with different z-stack resolutions. Detection performance of customized-CNN, on the other hand, was substantially decreased for unprocessed images and the effect of contrast enhancement was more pronounced for this case. Results suggest that Boosted Trees algorithm and the customized-CNN may be regarded as robust myelin detection methods, even for data sets without a dedicated training phase specific for that particular data set. From the generalization point of view, this is especially desired for myelin detection.
Similar to myelin, most biological structures expand in three di-mensions and carry information in multiple channels (Wigen et al., 2018; Segars et al., 2018). Biologists prefer to visually evaluate the quality of the myelin. It allows them not only to confirm the results but also to assess the effect of treatments applied. Thus, we visualized the myelin detected by the machine learning algorithms over the original images. Moreover, the visualization step is an early step in stereological reconstruction of the myelin. In the future, we plan to extract and quantify morphological parameters such as myelin length and number of myelin regions from the reconstruction of machine learning detected myelin.
Expediting myelin detection is essential for classifying thousands of images in a reasonable time frame allowing screening of chemicals for myelin repair. Here, we presented a machine learning based workflow for expedited myelin detection. Compared to manual myelin detection, this workflow is significantly faster. It takes six hours for a well-trained expert to manually detect myelin from five of the 2k × 8k images used in this study. In comparison, Boosted Trees method processed feature images extracted from these images in 8.27 s and the customized-CNN
Table 7
Test accuracies for Boosted Trees for different split cases on unprocessed and contrast enhanced 0.5 μm z-stack resolution images Boosted Trees on unprocessed images Boosted Trees on contrast enhanced images Test images
(%)a Training images (%)a Precision (%) Recall (%) F-Score (%) (%) Error Accuracy (%) Precision (%) Recall (%) F-Score (%) Error (%) Accuracy (%)
10 90 95.07 99.66 97.31 2.68 97.32 95.93 99.66 97.76 2.22 97.78
25 75 95.09 99.59 97.29 2.71 97.29 96.07 99.41 97.71 2.27 97.73
50 50 94.91 99.72 97.26 2.74 97.26 95.33 99.73 97.48 2.21 97.79
75 25 94.60 99.49 96.99 3.01 96.99 95.09 99.25 97.13 2.87 97.13
90 10 94.65 99.30 96.92 3.08 96.92 94.55 99.29 96.86 3.14 96.86
aAn equal percentage of positive and negative images were randomly selected from 0.5 μm z-stack resolution images data set to form the train and test image sets. Table 8
Test accuracies for Customized-CNN on unprocessed and contrast enhanced 0.5 μm z-stack resolution images. Note that the network was trained with 1 μm z-stack
resolution images as was described in Tables 3 and 4).
Customized-CNN on unprocessed 0.5 μm images Customized-CNN on contrast enhanced 0.5 μm images Test images Training
images (%) Precision (%) Recall (%) F-Score (%) Error (%) (%) Accuracy Precision (%) Recall (%) F-Score (%) Error (%) Accuracy (%) 0.5 μm z-stack resolution images 90 96.49 46.72 62.95 28.47 72.53 92.33 83.70 87.81 11.53 88.47 75 95.90 55.91 70.65 23.20 76.80 89.87 87.30 88.57 11.14 88.86 50 84.49 88.08 86.25 13.81 86.19 91.19 86.48 88.77 10.82 89.18 25 95.90 55.57 70.36 23.37 76.63 87.84 92.77 90.24 9.85 90.15 10 96.23 55.16 70.12 23.47 76.53 88.42 90.63 89.51 10.46 89.54
Fig. 7. Post-visualization of the myelin were detected by the customized-CNN on a sample image. (a) The original image. Bracket shows myelin and circle marks the area of the false positive pixel. 5 stacks were maximum intensity projected. Oligodendrocytes: red, axons: green. (b) Ground truth as marked by the expert on the original image was shown in white. (c) All the pixels were classified as myelin by the customized-CNN. The myelin was in white while the false positive pixel was in orange. (For interpretation of the references to color in this figure legend, the reader is referred to the web version of this article.)
took only 1.04 s. Taken together with their high accuracy and increased speed, both Boosted Trees and customized-CNN methods are effective in expediting myelin detection. Myelin detection may be expedited by three to four orders of magnitude using image processing and machine learning techniques. In the future, they can be incorporated into work-flows to automate myelin quantification. Our results also suggest that such an automation scheme will benefit from automated contrast enhancement.
Author contributions
B.U.T., B.E.K., A.Ç. and U.E.A. designed the research. S.Ç.Y. and D.A. E. performed the research. B.U.T., B.E.K. and A.Ç. obtained funding. All authors contributed to writing and editing the manuscript.
Conflict of interest
The authors declare that there is no conflict of interest.
Acknowledgement
We gratefully thank TUBITAK (project number: 316S026) for their financial support.
Appendix A. Supplementary data
Supplementary data associated with this article can be found, in the online version, at https://doi.org/10.1016/j.jneumeth.2020.108946.
References
Agarwal, M., Mahajan, R., 2018. Medical image contrast enhancement using range limited weighted histogram equalization. Procedia Comput. Sci. 125, 149–156.
Aydınli, F.˙I., Çelik, E., Vatandas¸lar, B.K., Kerman, B.E., 2016. Myelin disorders and stem cells: as therapies and models. Turk. J. Biol. 40 (5), 1068–1080.
Boucanova, F., Maia, A.F., Cruz, A., Millar, V., Pinto, I.M., Relvas, J.B., Domingues, H.S., 2018. Collar occupancy: a new quantitative imaging tool for morphometric analysis of oligodendrocytes. J. Neurosci. Methods 294, 122–135.
Çiçek, ¨O., Abdulkadir, A., Lienkamp, S.S., Brox, T., Ronneberger, O., 2016. 3D U-Net: learning dense volumetric segmentation from sparse annotation. In: Ourselin, S., Joskowicz, L., Sabuncu, M.R., Unal, G., Wells, W. (Eds.), Medical Image Computing and Computer-Assisted Intervention – MICCAI 2016. Springer International Publishing, Cham, pp. 424–432.
Cimen, S., Capar, A., Ekinci, D.A., Ayten, U.E., Kerman, B.E., Toreyin, B.U., 2018. DeepMQ: a deep learning approach based myelin quantification in microscopic fluorescence images. 2018 26th European Signal Processing Conference (EUSIPCO) 61–65. https://doi.org/10.23919/EUSIPCO.2018.8553438.
Cole, K.L., Early, J.J., Lyons, D.A., 2017. Drug discovery for remyelination and treatment of MS. Glia 65 (10), 1565–1589.
Danelakis, A., Theoharis, T., Verganelakis, D.A., 2018. Survey of automated multiple sclerosis lesion segmentation techniques on magnetic resonance imaging. Comput. Med. Imaging Graph. 70, 83–100.
Deshmukh, V.A., Tardif, V., Lyssiotis, C.A., Green, C.C., Kerman, B., Kim, H.J., Padmanabhan, K., Swoboda, J.G., Ahmad, I., Kondo, T., et al., 2013. A regenerative approach to the treatment of multiple sclerosis. Nature 502 (7471), 327.
Ettle, B., Kerman, B., Valera, E., Gillmann, C., Schlachetzki, J.C., Reiprich, S., Büttner, C., Ekici, A.B., Reis, A., Wegner, M., et al., 2016. α. Acta Neuropathol. 132 (1), 59–75.
Janjic, P., Petrovski, K., Dolgoski, B., Smiley, J., Zdravkovski, P., Pavlovski, G., Jakjovski, Z., Davceva, N., Poposka, V., Stankov, A., Rosoklija, G., Petrushevska, G., Kocarev, L., Dwork, A.J., 2019. Measurement-oriented deep-learning workflow for improved segmentation of myelin and axons in high-resolution images of human cerebral white matter. J. Neurosci. Methods 326, 108373. https://doi.org/10.1016/ j.jneumeth.2019.108373.
Kayasandik, C.B., Labate, D., 2016. Improved detection of soma location and morphology in fluorescence microscopy images of neurons. J. Neurosci. Methods 274, 61–70. https://doi.org/10.1016/j.jneumeth.2016.09.007.
Kerman, B.E., Kim, H.J., Padmanabhan, K., Mei, A., Georges, S., Joens, M.S., Fitzpatrick, J.A.J., Jappelli, R., Chandross, K.J., August, P., Gage, F.H., 2015. In vitro myelin formation using embryonic stem cells. Development 142 (12), 2213–2225.
https://doi.org/10.1242/dev.116517.
Kilinc, D., Gallo, G., Barbee, K.A., 2009. Interactive image analysis programs for quantifying injury-induced axonal beading and microtubule disruption. Comput. Methods Prog. Biomed. 95 (1), 62–71.
Kreft, M., Milisav, I., Potokar, M., Zorec, R., 2004. Automated high through-put colocalization analysis of multichannel confocal images. Comput. Methods Prog. Biomed. 74 (1), 63–67.
Naito, T., Nagashima, Y., Taira, K., Uchio, N., Tsuji, S., Shimizu, J., 2017. Identification and segmentation of myelinated nerve fibers in a cross-sectional optical microscopic image using a deep learning model. J. Neurosci. Methods 291, 141–149. Reich, D.S., Lucchinetti, C.F., Calabresi, P.A., 2018. Multiple sclerosis. N. Engl. J. Med.
378 (2), 169–180. https://doi.org/10.1056/NEJMra1401483.
Salvi, M., Cerrato, V., Buffo, A., Molinari, F., 2019. Automated segmentation of brain cells for clonal analyses in fluorescence microscopy images. J. Neurosci. Methods 325, 108348. https://doi.org/10.1016/j.jneumeth.2019.108348.
Schneider, E.K., Rasband, C.A.W.S., 2012. NIH Image to ImageJ: 25 years of image analysis. Nat. Methods 9 (7), 671–675.
Segars, W.P., Tsui, B.M.W., Cai, J., Yin, F., Fung, G.S.K., Samei, E., 2018. Application of the 4-D XCAT phantoms in biomedical imaging and beyond. IEEE Trans. Med. Imaging 37 (3), 680–692. https://doi.org/10.1109/TMI.2017.2738448.
Simons, M., Nave, K.-A., 2016. Oligodendrocytes: myelination and axonal support. Cold Spring Harbor Perspect. Biol. 8 (1), a020479.
Thompson, A.J., Baranzini, S.E., Geurts, J., Hemmer, B., Ciccarelli, O., 2018. Multiple sclerosis. Lancet 391 (10130), 1622–1636. https://doi.org/10.1016/S0140-6736 (18)30481-1.
Wigen, M.S., Fadnes, S., Rodriguez-Molares, A., Bjåstad, T., Eriksen, M., Stensæth, K.H., Støylen, A., Lovstakken, L., 2018. 4-D intracardiac ultrasound vector flow imaging- feasibility and comparison to phase-contrast MRI. IEEE Trans. Med. Imaging 37 (12), 2619–2629. https://doi.org/10.1109/TMI.2018.2844552.
Xu, Y.K.T., Chitsaz, D., Brown, R.A., Cui, Q.L., Dabarno, M.A., Antel, J.P., Kennedy, T.E., 2019. Deep learning for high-throughput quantification of oligodendrocyte ensheathment at single-cell resolution. Commun. Biol. 2, 116. https://doi.org/ 10.1038/s42003-019-0356-z.
Zaimi, A., Duval, T., Gasecka, A., Cˆot´e, D., Stikov, N., Cohen-Adad, J., 2016. AxonSeg: open source software for axon and myelin segmentation and morphometric analysis. Front. Neuroinform. 10, 37.
Zaimi, A., Wabartha, M., Herman, V., Antonsanti, P.-L., Perone, C.S., Cohen-Adad, J., 2018. AxonDeepSeg: automatic axon and myelin segmentation from microscopy data using convolutional neural networks. Sci. Rep. 8 (1), 3816.
Zhang, H., Jarjour, A.A., Boyd, A., Williams, A., 2011. Central nervous system remyelination in culture – a tool for multiple sclerosis research. Exp. Neurol. 230 (1), 138–148.