NUMERICAL INVESTIGATIONS OF THE
EFFECT OF OPERATION TEMPRETURE AND
RELATIVE HUMIDITY ON THE PEM FUEL CELL
PERFORMANCE
2020
MASTER THESIS
MECHANICAL ENGINEERING
OMAR QASIM SALEH AL-HADEETHI
NUMERICAL INVESTIGATION OF THE EFFECT OF OPERATING TEMPERATURE AND RELATIVE HUMIDITY ON THE PEM FUEL CELL
PERFORMANCE
Omar Qasim Saleh AL-HADEETHI
T.C.
Karabuk University Institute of Graduate Programs Department of Mechanical Engineering
Prepared as Master Thesis
Assoc. Prof. Dr. Selami SAĞIROĞLU
KARABUK July 2020
ii
I certify that in my opinion the thesis submitted by Omar Qasim Saleh AL-HADEETHI titled “NUMERICAL INVESTIGATION OF THE EFFECT OF OPERATING TEMPERATURE AND RELATIVE HUMIDITY ON THE PEM FUEL CELL PERFORMANCE” is fully adequate in scope and in quality as a thesis for the degree of thesis for the Master of Science.
Assoc. Prof. Dr. Selami SAĞIROĞLU ...
Thesis Advisor, Department of Mechanical Engineering
Approval
This thesis is accepted by the examining committee with a unanimous vote in the Department of Mechanical Engineering as a Master of Science thesis. July 10, 2020
Examining Committee Members (Institutions) Signature
Chairman : Prof. Dr. M. Bahattin ÇELİK (KBU) ...
Member : Assoc. Prof. Dr. Selami SAĞIROĞLU (KBU) ...
Member : Assist. Prof. Dr. Fatih UYSAL (SUBU) ...
The degree of Master of Science by the thesis submitted is approved by the
Administrative Board of the Institute of Graduate Programs, Karabuk University.
Prof. Dr. Hasan SOLMAZ ...
iii
“I declare that all the information within this thesis has been gathered and presented in accordance with academic regulations and ethical principles and I have
according to the requirements of these regulations and principles cited all those which do not originate in this work as well.”
iv
1. ABSTRACT
M. Sc. Thesis
NUMERICAL INVESTIGATION OF THE EFFECT OF OPERATING TEMPERATURE AND RELATIVE HUMIDITY ON THE PEM FUEL CELL
PERFORMANCE
Omar Qasim Saleh AL-HADEETHI
Karabük University Institute of Graduate Programs Department of Mechanical Engineering
Thesis Advisor:
Assoc. Prof. Dr. Selami SAĞIROĞLU July 2020, 85 pages
In this thesis, a three-dimensional single flow channel PEM fuel-cell for 4.8 cm2 active area has been numerically investigated by using computational fluid dynamics (CFD) commercial program ANSYS-FLUENT. Required variables and boundary conditions have been defined. The essential objectives of this study are to study the impact of the Hydrogen and Oxygen relative humidity and cell operation temperature cell performance. The obtained results from the simulation have been verified with previous literature, verification results showed a good conformed to previous literature experiments.
v
Simulation results indicated a higher cell performance was obtained at 55℃ operating temperature where the higher current density was obtained (0.3 A/cm2), cell voltage (0.6 V) and best power output equals to (0.1 W/cm2). Also, higher cell performance was obtained at 90% relative humidity values at the anode side and maximum current density (0.9 A/cm2), cell voltage (0.2 V) and maximum power output (0.3 W), similarly, when utilizing oxygen gas with 90% relative humidity, current density (0.9 A/cm2), cell voltage (0.2 V), and maximum power output (0.3 W).
The rational reasons for this results are an increase in the cell operating temperature between (45℃-55°C), the water evaporation rates becomes greater than water production rates, leads to membrane dehydration cases in decreases in cell protonic conductivity and increase ohmic loss leads to cell performance degradation moreover, an increase in the relative humidity of the Hydrogen and Oxygen gases leads to increases in membrane water content cases in increases in cell protonic conductivity and decrease ohmic loss leads to enhance the cell performance.
Key Words : PEM fuel-cell, operating temperature, relative humidity,
Three-dimensional model, (CFD)
vi
ÖZET
Yüksek Lisans Tezi
ÇALIŞMA SICAKLIĞI VE BAĞIL NEMLENDİRMENİN PEM YAKIT HÜCRE PERFORMANSINA ETKİSİNİN SAYISAL İNCELENMESİ
Omar Qassim Salih AL-HADEETHİ
Karabük Üniversitesi Lisansüstü Eğitim Enstitüsü Makina Mühendisliği Anabilim Dalı
Tez Danışmanı:
Doç. Dr. Selami SAĞIROĞLU Temmuz 2020, 85 sayfa
Bu tezde, 4.8 cm2 aktif alan için üç boyutlu tek akışlı kanal PEM yakıt hücresi, sayısal akışkan dinamiği (CFD) ticari programı ANSYS-FLUENT kullanılarak sayısal olarak araştırılmıştır. Gerekli değişkenler ve sınır koşulları tanımlanmıştır. Bu çalışmanın temel amaçları Hidrojen ve Oksijen bağıl nemi ve hücre çalışma sıcaklığı hücre performansının etkisini incelemektir. Simülasyondan elde edilen sonuçlar önceki literatür ile doğrulanmıştır, doğrulama sonuçları önceki literatür deneylerine uygun olduğunu göstermiştir.
vii
Simülasyon sonuçları, yüksek akım yoğunluğunun (0.3 A/cm2), hücre voltajının (0.6
V) ve en iyi güç çıkışının (0.1 W/cm2) olduğu 55℃ temperature çalışma sıcaklığında yüksek PEM yakıt hücresi performansının elde edildiğini gösterdi. Ayrıca, anot tarafındaki% 90 bağıl nem değerlerinde ve maksimum oksijen yoğunluğu (0.9A/cm2),
hücre voltajı (0.2 V) ve maksimum güç çıkışı (0.3 W) ile benzer şekilde oksijen gazı kullanılırken daha yüksek hücre performansı elde edildi. % 90 bağıl nem, akım yoğunluğu (0.9 A/cm2), hücre voltajı (0.2 V) ve maksimum güç çıkışı (0.3 W).
Bu sonuçların rasyonel nedenleri, hücre çalışma sıcaklığında (45℃-55℃-55°C) arasında bir artış, su buharlaşma oranları su üretim oranlarından daha büyük olur, hücre protonik iletkenliğinde azalmalar ve ohm kaybının artmasıyla membran dehidratasyon vakalarına yol açar. Ayrıca, hücre performansında bozulmaya yol açar. Hidrojen ve Oksijen gazlarının bağıl nemi, hücre protonik iletkenlik artışlarında membran su içeriği vakalarında artışa yol açar ve omik kaybını azaltır PEM yakıt hücresi performansını arttırır.
Anahtar Kelimeler : PEM yakıt hücresi, çalışma sıcaklığı, bağıl nem, üç boyutlu hhhhhhhhhhhhhhhhhhhmodel, (CFD)
viii
ACKNOWLEDGEMENT
Firstly, I would like to express my gratitude, thankful to my lord (ALLAH sobhanh we tale) for being with me all the way during this journey. I believe that nothing happens by chance and I am sure my lord puts special people along the way to help me in my journey.
I would like to extend my sincere thanks to the distinguished discussion committee Prof.Dr. M.Bahattin Çelik, Assoc.Prof.Dr. Selami SAĞIROĞLU, Assist.Prof.Dr. Fatih UYSAL. I would like to express my gratitude to my supervisor Assoc.Prof.Dr. Selami SAĞIROĞLU for his trust, guidance, and encouragement. I thank my teacher of thermodynamics, Assist.Prof.Dr. Abdulrazak AKROOT.
I am grateful to Assist.Prof.Dr. Elif Eker KAHVECİ from SAKARYA University, who provides me important materials related to my research topic. Also, I think Mr. Emad G. Barakat from Assiut University in Egypt and Mrs. Asifa Awan from the Punjab University in Pakistan, for their guidance in ANSYS Workbench and sharing their experience.
Finally, I would like to thank my father Qassim AL-HADEETHI, my mother Iman ALHILALI, my wife Sarah ALHUSAINI my sons Mohammed and Maryam for their love, support, and guidance at every step of my life, thanks to everyone who helped me throughout my thesis.
ix CONTENTS Page APPROVAL ... ii ABSTRACT ... iv ÖZET ... vi LIST OF FIGURES ... x
LIST OF TABLES ... xiii
SYMBOLS AND ABBREVIATIONS INDEX ... xiv
PART 1 ………...1
INTRODUCTION ... 1
1.1. PEM FUEL-CELLS APPLICATIONS ... 5
1.2. BASIC COMPONENTS OF PEM FUEL-CELL ... 7
1.1.1. Flow Filed Plates (FFPs) ... 8
1.1.2. Flow Channels (FCHs) ... 9
1.1.3. Gas Diffusion Layers (GDLs) ... 10
1.1.4. Catalyst Layers (CLs) ... 11
1.1.5. Proton Exchange Membrane (PEM) ... 12
1.3. THEORETICAL LOSSES IN PEM FUEL-CELL ... 14
1.3.1. Activation Losses ... 15
1.3.2. Concentration Losses ... 16
1.3.3. Ohmic Losses ... 17
1.4. PEM FUEL-CELL EFFICIENCY ... 18
1.5. RESEARCH OBJECTIVES ... 19
1.6. OUTLINE OF THE STUDY ... 20
PART 2 ………...22
LITRETURE VIEW ... 22
2.1. WATER MANAGEMENT ... 24
x Page 2.3. OPERATING TEMPERATURE ... 32 2.4. RESEARCH PROBLEMS ... 35 PART 3 ………...36 METHOODOLOGY ... 36 3.1. NUMERICAL MODEL ... 37 3.2. MODEL ASSUMPTIONS ... 37 3.3. GEOMETRY CREATION ... 39 3.4. MESH GENERATION ... 40 3.5. BOUNDARY CONDITIONS ... 44 PART 4 ... 47
SIMULATION RESULTS AND MODEL VALIDATION ... 47
4.1. MODEL VALIDATION ... 47
4.2. OPERATING TEMPERATURE ... 49
4.3. RELATIVE HUMIDITY ... 54
4.3.1. Anode side relative humidity ... 54
4.3.2. Cathode side relative humidity ... 57
PART 5 ……….…………..59
SUMMARY ... 59
5.1. RECOMMENDATIONS FOR FUTURE WORK ... 60
REFERENCES ... 61
RESUME ... 67
xi
LIST OF FIGURES
Page
Figure 1.1. Energy consumption worldwide. ... 1
Figure 1.2. History fuel cell. ... 2
Figure 1.3. Three main applications of fuel cells ……… ... 6
Figure 1.4. PEM fuel-cell components. ... 7
Figure 1.5. Flow filed plates (FFPs) …. ... 8
Figure 1.6. serpintyne types of flow channels (FCHs). ... 9
Figure 1.7. Gas diffusion layers (GDLs). ... 10
Figure 1.8. Catalyst layers in (CLs). ... 13
Figure 1.9. Proton exchange membrane (PEM). ... 13
Figure 1.10. Various voltage losses and (I-V) curve. ... 14
Figure 1.11. Impact of ohmic losses on the PEM fuel-cell performance. ... 18
Figure 2.1. PEM fuel-cell parts and operation. ... 22
Figure 2.2. Water transportation mechanisms in the PEM fuel-cell. ... 25
Figure 2.3. An external humidification method in PEM fuel-cell …………. ... 27
Figure 2.4. Bubble humidification. ... 28
Figure 2.5. Schematic diagram of bubble humidification system ……… ... 29
Figure 2.6. Symmetrical and asymmetrical humidification system …………. ... 30
Figure 2.7. Schematic diagram for PEM fuel-cell humidification system. ... 31
Figure 2.8. Self-humidification PEM fuel-cell system ……….. ... 33
Figure 2.9. Schematic diagram of fuel cell used in experimental ……… ... 34
Figure 3.1. Main equation that describes the electrochemical in the cell. ... 36
Figure 3.2. PEM fuel-cell simulation steps ... 38
Figure 3.3. Nine parts of the PEM fuel-cell used in geometry creation.……... 39
Figure 3.4. Mesh generation process. ... 40
Figure 4.1. Numerical validation with wilberforce 2019 experiment……….. . 48
xii
Page
Figure 4.3. (I-V) curve at various cell operating temperature. ... 51
Figure 4.4. (I-P) curve at various cell operating temperature……….. . 51
Figure 4.5. An exchange current density distribution on the PEM fuel-cell... 53
Figure 4.6. (I-V) curve at various cell anode relative humidity… ... ..55
Figure 4.7. (I-P) curve at various cell anode relative humidity. ... 55
Figure 4.8. Graphical counters explain the anode relative humidity ... 56
Figure 4.9. (I-V) curve at various cell cathode relative humidity (CRH).. ... 58
Figure 4.10. (I-P) curve at various cell cathode relative humidity (CHR). ... 58
xiii
3. LIST OF TABLES
Page
Table 1.1. Different fuel cell types... 3
Table 1.2. High heating values of different fuels used in automotive ... 4
Table 3.1. Explained the PEM fuel-cell model geometries. ... 41
Table 3.2. Number of cell generated elements ... 41
Table 3.3. Necessary parameters and boundaries for requirement studies model. ... 45
Table 4.1. Cell dimensions used in the experiment ... 47
Table 4.2. Cell current,voltage and power output at a) 55°C- b) 65°C- c) 75°C ... 52
xiv
SYMBOLS AND ABBREVIATIONS INDEX
SYMBOLS
: efficiency of the PEM fuel-cell
T : working temperature of the PEM fuel-cell (℃) V : voltage of the PEM fuel-cell (V) n : number of electrons transferred through the anode to cathode
P : working pressure of the PEM fuel-cell (kPa) Ψ : relative humidity
Pν : water vapor pressure (kPa)
Pνs : saturation vapor pressure (kPa)
R : universal gas constant (J/mol.K) E : potential (Volt)
F : faraday's constant (C/mol) I : electric current (Amper) M : mass flow rate (g/min) L : liquid phase
∆𝐻000 : change in the enthalpy (J/mol) Q H2 : fuel input to PEM fuel cell
xv
PH2O : partial pressure of water vapor (kPa)
V Theory : theoretical cell voltage (V)
V losses : cell potential losses (V)
V Activ : activation losses (V)
V Conc : concentration losses (V)
V Ohmic : ohmic losses (V)
𝑖𝐿𝑀88 : limitation current (A/cm2)
R elec : electronic resistance (Ω)
R ionc : ionic resistance (Ω)
xvi
4. ABBREVITIONS
ICE : Internal combustion engine
NASA : National Aeronautics and Space Administration USA : United states of America
CO2 : Carbon dioxide
CO : Carbon monoxide NOx : Nitrogen oxides
PM : Particle matter HC : Hydrocarbons
PEMFC : Polymer electrolyte membrane fuel cells SOFC : Solid oxide fuel cells
MCFC : Molten carbonate fuel cells AFC : Alkaline fuel cell
HOR : Hydrogen oxidation reaction ORR : Oxygen reduction reaction MEA : Membrane electrode assembly
PEM : Proton exchange membrane CLs : Catalyst layers
GDL : Gas diffusion layer FCHs : Flow channels
FFPs : Flow filed plates
RHC : Cathode Relative humidity RHA : Anode Relative humidity HFCV : Hydrogen fuel cell vehicle
xvii BD : Back diffusion
EOD : Electro osmotic drag OCV : Open circuit voltage PTFE : Polytetrafluoroethylene
I-V : Current -voltage curve PFSA : Perfluoro-sulfonic acid
EHM : External humidification methods IHM : Humidification methods
1
PART 1
INTRODUCTION
Fossil fuels consider the main energy sources worldwide, all energy sectors like power plants, automotive, and industries are used fossil fuel for energy production. The energy demand increases around 15 billion metric tons per year, therefore, increase the concern for governments about fossil fuel depletion around the world. Electric production, industrialization, and transportation sectors considered the main energy consumption in the world. Figure 1.1. Shows energy consumption worldwide. The combustion of fossil fuels has an adverse impact on the environment as global warming and climate-changing, it emits risky gases the same soot, carbon monoxide CO, hydrocarbons HC, nitrogen oxides NOx [2].
Figure 1.1. Energy consumption worldwide [3]. 0 20 40 60 80 100 120 140 160 2008 2010 2012 2014 2016 2018 2020 2022 Qu ad rlion
Energy consumption
2
3
Fuel cell history started in 1842. Sir William groove invited the gas voltaic battery which considered a prototype of the fuel cell. In 1960. National Aeronautics and Space Administration (NASA) used the fuel cell in the space missions. In 1966. General Motors Company developed first electric van powered by fuel cells, in 2014. Toyota Company produced hydrogen fuel cell vehicle called (MIRAI) as shown in Figure 1.2.
Unique functions of the fuel cells made them a strong candidate to replace the conventional energy sources particularly in automotive sector [5]. Fuel-cells are energy convertor that converts the heat energy in the fuel (Hydrogen) to useful electricity. Various fuel cells technology are can be classified depending on the membrane types and cell working temperature [6]. Different fuel cell types listed in Table 1.1.
Table 1.1. Different fuel cell types [7].
Good properties of PEM fuel-cells as low-temperature operation, high energy density, and zero-emission device made the PEM fuel-cells type are more desirable than other types of fuel cells, and made it strongest candidate to replace internal combustion engine ICE in automotive. It has many uses in portable, stationary power applications, and transportation sectors, particularly, in the automotive [8].
Fuel cell types Used electrolyte Working temperature Cell efficacy Used Fuel Alkaline fuel cell AFCs Potassium hydroxide solution 25-85 ℃ 70% H2-O2
PEM fuel cell PEMFCs
Proton exchange membrane
50-95 ℃ 50-60% H2-O2
Solid oxide fuel cell SOFCs Oxide ion conducting ceramic 800-1000 ℃ 65% Ch3, H2-O2 Molten carbonate fuel cell MCFCs Molten mixture of alkane metal carbonate 650 ℃ 65% Ch3, H2-O2
4
Generally, PEM fuel-cells like an automotive battery, it is consist of the positive side, negative side (Anode), and solid electrolyte. Anode side covered with platinum layers that catalyze the hydrogen molecules to one electron and one proton, concentrations of the platinum particles in the anode side (0.05 Mg/cm2) as well as Cathode side covered with platinum layers that reduced the oxygen molecules and hydrogen proton to produce water, the platinum particles concentrations in the cathode side (0.2-0.4 Mg/cm2). PEM fuel-cells operate at special conditions, as the following below:
Operating temperature: 50℃-90°C. Operating pressure: 100-300 kPa.
Inlet gas relative humidity: 50 % - 100%. Fuel tank pressurized to 700 kPa [9].
PEM fuel-cells are consumed hydrogen gases as an oxidize gases and oxygen gases as a reductant. In reality, hydrogen gases are not available in the earth but it combined with oxygen as water or combined with carbon as natural gas or in living thing as in biomass, hydrogen have high energy value than other fuels [10]. Hydrogen gases can be produced from the renewable energy sources like geothermal energy, hydroelectric wind, solar photovoltaics and direct photo electrochemical, it has a high heating energy. Table 1.2. Summarize the deferent fuel heating values used in automotive [11].
Table 1.2. High heating values of different fuels used in automotive [12].
Fuel Chemical symbol Heating energy Density MJ/kg kg/m3 Hydrogen H2 141.8 0.0899 Gasoline C6H6 47.3 719.79 Diesel C14H30 44.4 832 Natural gas - 50 0.8000
5
1.1. PEM FUEL-CELLS APPLICATIONS
Unique functions of the PEM fuel-cells as low-temperature operation, great energy density, and zero-emission device made this cells type are more desirable than other types of fuel cells. In reality, PEM fuel-cells have three main application as can be shown in Figure 1.3. As following:
Transportation applications Portable applications Stationary applications
PEM fuel-cells have gained a huge interest from the automotive company because it has many benefits as no emission, no moving parts, high-efficiency device and environment friendly. Hydrogen fuel cell vehicle (HFCV) working is following:
Air (oxygen) inters to automotive from the windows in font of automotive from the atmospheric air and enters to cell at a cathode side.
Hydrogen gases are fed to cell from the high-pressure hydrogen tank. The hydrogen gases inter to fuel cell at an anode side where it oxidized into one negative electron and one positive proton.
On the anode side: An electrochemical reaction occurs on the anode surface between the hydrogen and platinum particles on the catalyst layer interface result in splitting the hydrogen into one electron and one proton, protons are moved from the anode to the cathode across the proton exchange membrane PEM, electrons will moving through external load circuit from the anode to the cathode [13].
On cathode side: An electrochemical reaction occurs on the cathode surface between the negative electrons and positive protons and oxygen atoms leads to generate water and release some heat [14].
The generated electricity from the PEM fuel-cell are supplied to an electric motor to moves the wheels of automotive [16].
6
a) Transportation applications
b) Portable applications
c) Stationary applications
7
1.2. BASIC COMPONENTS OF PEM FUEL-CELL
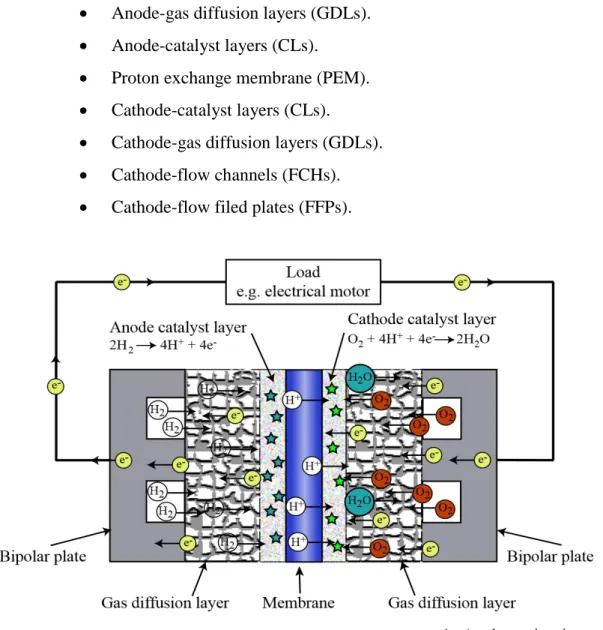
Figure 1.4. Explained the essential cell parts, PEM fuel-cell are consist of a membrane electrode assembly (MEA) laying between two flow field plates. (MEA) involve of the proton exchange membrane (PEM), catalyst layers (CLs), and gas diffusion layers (GDLs), each layer has a various function in the cell operation [17].
Anode-flow filed plates (FFPs). Anode-flow channels (FCHs). Anode-gas diffusion layers (GDLs). Anode-catalyst layers (CLs).
Proton exchange membrane (PEM). Cathode-catalyst layers (CLs).
Cathode-gas diffusion layers (GDLs). Cathode-flow channels (FCHs). Cathode-flow filed plates (FFPs).
8
1.1.1. Flow Filed Plates (FFPs)
Flow filed plates (FFPs) are the biggest component in the cell, almost accounts 70% from the cell mass and 30% from the overall cell price. Flow channels shapes in the flow filed plates as shown in Figure 1.5. The most common material to fabricate flow filed plates (FPPs) is a graphite-carbon. Several functions for flow filed plates (FFPs) like it conduct cell to adjacent cell electrically, electrons transportation from the anode to cathode, uniformly distributed the reactant gases and contribute in water management, and heat contribute in management by removing the overheat from the reaction sites by coolant [20]. Good Flow Filed Plates (FFPs) must be characterized by:
An impermeable for reactant gases, high electronic conductivity, chemically stability.
Good thermal conductivity.
Easy to manufactured and low cost.
9
1.1.2. Flow Channels (FCHs)
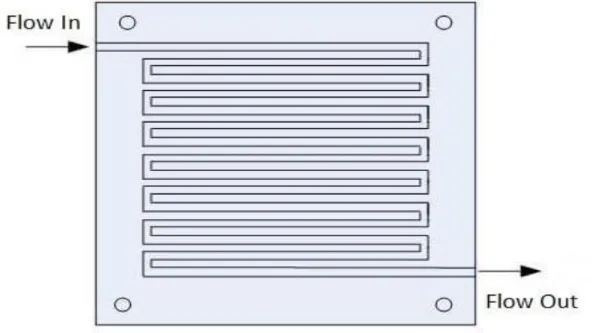
Flow channels have a vital importance in the PEM fuel-cell operation system, it has significant influence on the cell performance. The main function of the flow channels are distributed reactant gases to the reaction sites evenly and plays important roles in the water management where it removed the water molecules out of the cell. Flow channels have several designed as parallel, serpentine, zigzag straight channel, and integrated design, each design have a different influence on the cell performance [21]. Flow channels must have characterized by three aspects:
Distribute the reactant gases on the reaction sites evenly. Small pressure difference between the inlet cell and outlet cell. Do not allow of the electrode flooding.
Parallel design, are most common used type, it has many advantages as the low-pressure difference of the reactant gases, simple design, can be treated any blockage in flow channel. Another common type is the serpentine channel, this type characterized by being a one-flow channel extending from cell inlet to outlet.
10
1.1.3. Gas Diffusion Layers (GDLs)
Gas Diffusion Layers (GDLs) consider a functional component in PEM fuel-cell; it consists of mixture with three layers (carbon, water, and polytetrafluoroethylene). Essential function of a polytetrafluoroethylene is facilitating the transport of water and gases during flooding phenomena conditions. Carbon clothes are most common materials for the (GDLs) [22]. It has a 300 µm thick, it must have designed as a hydrophobic that is means (GDLs) are able to repel water molecules out of reaction sites to prevent the electrode flooding as can be seen in Figure 1.7 [18]. Main functions of the (GDLs) are:
Diffuse and distribute the reactant gases to the reaction sites on the (CLs). Heat transportation from the reaction sites on the (CLs) to the (FFPs). Electrons transportation from the reaction sites on the (CLs) to the (FFPs). Contribute in the water and heat management.
Electronic resistivity [23].
11
1.1.4. Catalyst Layers (CLs)
Catalyst layers (CLs) plays a major roles inside the PEM fuel-cell. Two electrochemical reaction takes place on the catalyst layers (CLs) interface for anode and cathode side as in the following equations below. Hydrogen oxidization reaction (HOR): where Hydrogen oxidize on the anode catalyst surface into on proton and one electron as shown in equation (1.1).
On the cathode side, Oxygen will reduce the proton and electron to form water and release some heat by Oxygen reduction reaction (ORR) as shown in equation (1.2) [24].
H2 → 2H++ 2e− (1.1)
1 2
⁄ O2 + 2H++ 2𝑒− → 2H2O (1.2)
Catalyst layers consist of small carbon powder particles it has a 50 nm thickness and small platinum particles around 5 nm as shown in Figure 1.8. [25]. Platinum particles had used as a catalyst because it has high activity. Good catalyst layers must be having a special specification as following [39]:
High ionic and electronic conductivity. Preamble gases.
High activity. Low cost.
The main challenges in the catalyst layers operation are the hydrogen fuels are, containing impurities of CO that that has a containing impurities, several researchers were suggested addition the ruthenium with the platinum to solve problem of carbon impurities and enhance the PEM fuel-cell performance.
12
1.1.5. Proton Exchange Membrane (PEM)
Proton exchange membrane (PEM) represents the functional component in the PEM fuel-cells, it has the same functions of the electrolyte inside the conventional automotive battery, and it must have a special specification as following:
Thermally and chemically stable. Highly protonic conductivity. Good insulator for electrons. Thin as possible [26].
Better material used in the membrane are sulfonated polymer, this material has unique feature which high proton conductivity as can be shown in Figure 1.9. Protonic conductivity is the major function of the proton exchange membrane (PEM). It must be maintain fully hydrated to achieve better performance from the cell, therefore, water molecules needed. On one hand, an excessive in the waters molecules lead to electrode flooding result in blockages the porous media in (GDLs) and retarded the reactants gas from reaching the active sites on the (CLs). Thereby reducing the protonic conductivity which can result in decreases the cell performance [13].
Proton exchange membrane (PEM) works with a normal level of water with the desirable cathode and anode relative humidity and desirable operating temperature it would lead to increase in cell performance.
The essential aims of this thesis are examine the cell performance at different working temperature and deferent relative humidity values, then select better operation values.
13
Figure 1.8. Catalyst layers in (CLs) [25].
14
1.3. THEORETICAL LOSSES IN PEM FUEL-CELL
The relationship between the cell voltage and exchange current density defined as polarization curve or (I-V) curve. (I-V) curve used in the comparison between the quantities of the power output produced from two deferent cells, where the following relation as can calculate the voltage of the cell shown in Figure 1.10. Equations 1.3. Explained the cell voltage include the cell voltage losses.
V cell = V Theory – V Losses (1.3)
Where:
V Cell : Cell voltage in V
V Theory : Theoretical cell voltage in V
V Losses : Losses in the cell voltage in V
15
Theoretical cell voltage V Theory can determine from the Nernst equation as
following as in equation (1.4), and cell voltage losses can calculated by using 1.5. Equation: V Theory = V Theoryₒ + 𝑅 𝑇 𝑛𝐹 𝑙𝑛 (𝑃𝐻2 𝑃𝑂2)1/2 𝑃𝐻2𝑂 (1.4)
V Losses = V Activation + V Consternation + V Ohmic (1.5)
Where:
V Theoryₒ: Standard theoretical cell voltage.
T : Working temperature.
R : Universal gases constant 8.314 kJ/mol.K. N : Number of electrons.
F : Faraday is constant 96.485 c/mol.
P : Hydrogen, oxygen, and water partial pressure in atm. V Activ : Activation losses.
V Cons : Consternation losses.
V Ohc : Ohmic losses.
The electric power produced from the PEM fuel-cells governed by Faradays low takes in account the theoretical losses from the cell as mentioned in the second law of thermodynamics which state that impossible to transform all heat energy to useful work, some heat must be lost as a sink heat.
1.3.1. Activation Losses
Activation Losses define as voltage lost in driving the chemical reaction, which transfers electrons, from the anode side to the cathode side, this loss depend on the electrode type, ionic activity, ionic activity solvent, and electrode-electrolyte interface. These losses takes place on both side of electrode anode and cathode,
16
Oxygen reduction reaction (ORR) faster than the hydrogen oxidation reaction (HOR), so the activation losses on the anode side neglected. Activation losses dominated at the low exchange current density, increasing the exchange current density can be reduces these losses by increase many factories as following [29]:
Working temperature. Flow rates of the reactant. Working pressure.
Activity of the catalyst layers (CLs). Roughness of the electrode.
Activation losses can be calculated by using the following equation (1.6):
V Act = 𝑅 𝑇
𝛼 𝑛𝐹 𝑙𝑛 ( 𝑖 + 𝑖𝐿𝑀
𝑖 ) (1.6)
Where:
V Act : PEM fuel cell actual voltage losses.
𝑖𝐿𝑀 : Exchange current density limitation. T : PEM fuel cell operating temperature. F : Faraday is constant 96.485 c/mol. N : Number of electrons.
α ∶ Transfer current cofficient . 𝑖 ∶ Exchange current density.
1.3.2. Concentration Losses
The concentration voltage losses occur because of reactant consumption on the electrode surface which leads in concentration gradient between bulk and electrode surface [30]. The concentration voltage losses dominated at high current density. Concentration loss can minimize by:
17
Increase the hydrogen and oxygen flow rates. Increase the hydrogen and oxygen pressure.
Optimize the porosity of gas diffusion layers (GDLs).
This relation following below can calculate the cell concentration losses in equation (1.7): V Cons = 𝑅 𝑇 𝑛𝐹 ( 𝑖𝐿𝑀 𝑖𝐿𝑀−𝐼) (1.7) Where:
V Cons : Concentration Losses.
T : Working temperature.
R : Global gases constant 8.314 kJ/Mol.k. N : Number of electrons.
F : Faraday is constant 96.485 c/mol.
𝑖𝐿𝑀 : Exchange current density limitation, the approximate value of the
ggggggggexchange current density limitation for PEM fuel-cell 1.2 A/cm2.
1.3.3. Ohmic Losses
The ohmic losses result in retired the electrons moving from the anode to the cathode. Major reasons for ohmic losses are resistance of the ionic current in the electrolyte and electronic current in the electrode, it dominant at the intermediate current density [31]. Using electrolyte with high ionic conductivity and an electrode with high protonic conductivity, contributed to lower these losses, ohmic losses have a significant impact on the cell performance, these losses shown in Figure 1.11. This relation following below can calculate the cell ohmic losses in Equation (1.8).
18
Figure 1.11.Impact of ohmic losses on the cell performance [32].
1.4. PEM FUEL-CELL EFFICIENCY
The efficiency of any conversion device can evaluate by dividing the output to input energy. The output energy in the PEM fuel-cells can be represent by electrical work, on the other hand the input energy can be represent by the hydrogen heating value. Efficiency of cell equals to electric power output to fuel input. The expression (
𝑚 ∆𝐻
𝑛 𝐹 ) represent a reversible potential includes thermal and electric energies from
the electrochemical reaction has a value 1.482 V. In simple way, the cell efficiency is a ratio between actual operating voltage and reversible potential 1.482 V [33]. Electric power output from the cell are represent a product of the (current (I) multiply the cell voltage (V)).Fuel input to the cell are a product of hydrogen higher heating value (142000 J/g), and hydrogen consumption rate (g/s), the rates of the hydrogen consumption is governed by faraday’s low as below. The set of equations below (1.9, 1.10, 1.11,01.12) Explained the algebraically relation between the cell concepts.
19 Q H2 = 𝑚𝐼 𝑛 𝐹 (1.10) Q H2* ∆ H = 𝑚𝐼 𝑛 𝐹 * ∆ H (1.11) = P 𝑂𝑢𝑡𝑝𝑢𝑡 Q 𝐻2 (1.12) 1.5. RESEARCH OBJECTIVES
There are many advantages for PEM fuel-cell technology made them interesting for many researchers like:
High-efficiency devices compared to (ICE) for vehicles.
The main produce from the electrochemical reaction is pure water and heat so it is clean energy conservation devices.
Alternative energy sources to fossil fuel.
Fuel flexibility that is mean can operate on the hydrogen fuel and operate on other fuel like methanol.
In this thesis, three-dimensional model created for PEM fuel-cell with 4.8 cm2
active area. From the previous studies, the author saw the investigations related to water management and operating conditions are very few. Obviously, cell operating with a proper level of water with the desirable cathode and anode relative humidity and desirable operating temperature it would lead to increase in cell performance. In present thesis, three-dimensional, PEM fuel-cell with single flow channel and membrane area 4.8 cm2 have been developed to investigate the influence of the operating temperature and reactant relative humidity. Numerical investigating have been done by using CFD solver ANSYS–FLUENT, where the operating temperature have varied between (55°C-75°C-85°C) values, and Hydrogen and Oxygen gases relative humidity have varied between (50%, 70%, 90%) values.
20
1.6. OUTLINE OF THE STUDY
In this study, a three-dimensional mathematical PEM fuel-cell model have been created to study the effect of operating temperature and the effect of anode and cathode relative humidity on the cell performance. The biggest challenges towards cell operation are water formation due to electrochemical reaction.
Part 1, this part presented a brief introduction about the energy production in the worldwide, then explained the dependence on fossil fuel in the energy production, and clear up the common renewable energy sources as hydrogen energy, then deeply explained (fuel cell) device, that converts the energy Stord in fuel to electricity. Compressive information of cell parts then shed light on PEM fuel-cell working, cell applications, and cell efficacy, this part ends by presents the research objectives and outline for the study.
Part 2, this part presented previous studies about working conditions influencing the water management issue in the PEM fuel-cell include an influencing of (operating temperature, operating pressure, the relative humidity of the inlet gases on the cell performance). Part 2 ends by defining the research problems.
In the Part 3, this part presented three-dimensional single flow channel PEM fuel-cell model build by using ANSYS –FLUINT 2020 R1, the model includes all the transport phenomena processes. The model geometry was designed in ANSYS– SPACE CLAIM included nine layers then insert into ANSYS–DESIGN MODELER-MESH to discretization processes by finite volume method (FVM) then insert into ANSYS–FLUENT to set boundary conditions, finally , the discretize cell were insert to ANSYS-FLUENT to set up the proper operation conditions and solve initialization
Part 4, this part presented the numerical simulation results of the three-dimensional computational fluid dynamic (CFD) of PEM fuel-cell model as a graphical contour and current density and cell voltage and power density values, the polarization (I-V) curve was drawn to validate with literature experiment.
21
The chapter ends with illustration the effect of (working temperature, anode relative humidity (ARH), and cathode relative humidity (CRH) on the cell power output.
Part 5, this part presented conclusions of recent work and recommendations for next work. Three-dimensional single flow channel PEM fuel-cell model created for 4.8 cm2 active area. From the previous studies. PEM fuel-cell operating with a proper level of water with the desirable cathode and anode relative humidity and desirable operating temperature it would lead to increase in cell performance.
The essential target of this thesis is to examine the cell performance at different working temperature and deferent relative humidity values, then select better operation values.
22
2. PART 2
LITERATURE REVIEW
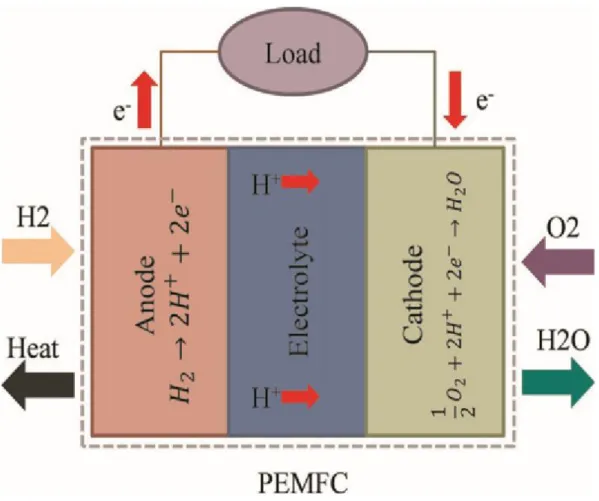
PEM fuel-cell considered an energy conversion devices which transform the heat energy in the (Hydrogen) to electric energy and emit pure water and some heat. Figure 2.1. Explained the cell parts. Generally, PEM fuel-cell like an automotive battery which consist of two sides, positive side (cathode) negative side (anode). Two main electrochemical reaction takes place on its surface (Hydrogen oxidization reaction (HOR) - Oxygen reduction reaction (ORR)) [24].
23
Hydrogen gases are delivering into anode side, while the oxygen gas are deliver into cathode side, hydrogen gas enters to the flow channels and diffuse through pours media In the (GDLs) then reach activities sits in catalyst layers (CLs). In (CLs) there are two electrochemical reaction occur as following:
On the anode side an electrochemical reaction takes place on the anode side (CLs) surface between the hydrogen and platinum particles result in oxidizing the hydrogen to one electron and one proton. Protons are transfers from the anode to the cathode across the membrane, electrons moving via an outer load circuit from the anode to the cathode. (2.1) Equation express the electrochemical reaction on the anode side [13].
On the cathode side an electrochemical reaction takes place (CLs) surface between the electrons and protons and oxygen on the cathode, result in water formation and release some heat equation (2.2) describes this reaction [14]. Equation Express the electrochemical reaction on the cathode side.
2H2 → 4H++ 4e− (2.1)
O2 + 4H++ 4e− → 4H2O (2.2)
PEM fuel-cells consist of nine components as following as can be seen in Figure 2.2.
Anode-flow filed plates (FFPs). Anode-flow channels (FCHs). Anode-gas diffusion layers (GDLs). Anode-catalyst layers (CLs).
Proton exchange membrane (PEM). Cathode-catalyst layers (CLs).
Cathode-gas diffusion layers (GDLs). Cathode-flow channels (FCHs). Cathode-flow filed plates (FFPs).
24
2.1. WATER MANAGEMENT
The water formation issue considered a major challenge in the PEM fuel-cell operational. To achieve high performance from the cells membrane must maintain fully humidified. Excessive water causes in blockages gas porous media lead to denying the reactant gases from reaching the active sites on the (CLs), cause in the decrease the cell performance. On other hands, insufficient water molecules maybe lead to membrane dehydration, increase in the ohmic resistance losses, which result in decrease in the cells performance.
(J. P. Owejan, et al, 2009), published a comprehensive review about the water management issues studied the impact of the water formation on the cell performance and durability [34]. He focused on the equilibrium between the membrane hydration and liquid water formation. The results showed, water formation depends on the reactants gases relative humidity, flow field layout and the structure of the (GDLs). Proper equilibrium in the membrane water contain, can be achieve a better cell performance [13]. The equilibrium in the water level means allows to reactant gases humidification without electrode flooding occurrence [11]. The main sources of water molecules in the cells are:
Oxygen reduction reaction (ORR) on cathode catalyst interface.
Water supplement via reactant gases during the humidification process. Water molecules transported in the cell by three mechanism (Electro-mostic drag (EOD), back diffusion (BD) and hydraulic permeation) [37].
2.1.1. Electro-Mostic drag (EOD)
Darning cell operation, the electric current runs through the cell, and protons with water molecules will transfer from the anode Side to the cathode through the membrane, water molecules transportations depending on the humidification state of the membrane.
25
2.1.2. Back diffusion (BD)
Water molecules will accumulate on the cathode leads to high concentration water on the cathode after the oxygen reduction reaction (ORR), high concentration water molecules will migrate from the cathode side to anode side. The gradient in concentration water influence by many factors as reactant gases humidification, membrane water content, membrane thickness, cell temperature, and current density. Figure 2.2. Shows the water transport process inside the cell [35].
2.1.3. Hydraulic permeation
Water will transport in both side (anode and cathode) depended on the pressure differential, almost Hydraulic permeation effect is small compared with (EOD) and (BD) effect so in many cases it is neglible.
26
2.2. INLET GASES RELATIVE HUMIDITY
Humidity is a parameter express about water content inside the gases or the water mixture, several ways to express for humidity as "absolute humidity, relative humidity, dew point temperature, and mixing ratio, relative humidity" almost, relative humidity is most common commercial idiom using in cell [45].
Ψ = Pv
pνs (2.1)
The temperature of the inlet gases is a " ratio between the partial pressure for the water vapor divided to saturated pressure for the water vapor [46]. The saturated pressure of the vapor is the same as the partial pressure of vapor for "mixture of air and water in equilibrium" that means; the rates of the water evaporation equals to rates of water condensation as shown in equation 2.3. [47].
PEM fuel-cells are used (Perfluoro-Sulfonic acid) ionomer membranes Nafion® PFSA as a proton exchange membrane (PEM), this type of membrane has a protonic conductivity characterized by the need to high water content level, consequently, in this type of membrane must be continues supplied sufficient water molecules and humidified a reactant gases to achieve better performance. In fact, there are two methods for reactant gases humidification internal humidification and external humidification. External humidification methods (EHM) are much better than internal humidification methods (IHM), for many reasons as: Reducing in total PEM fuel-cells cost and reducing in total weight and reducing in parasitic power consumption [38].
Water formation rate must be equal to water removal rate in order to maintain on the membrane fully hydrated and gained smoothly operated. In last century, (Staschewski & Technics, 1996) first work on the internal humidification (IHM), they developed a porous flow filed plats (FPPs), where linked with hot water loop and supplied hot water to humidify the membrane electrode assembly (MEA).
27
The study concluded that the internal humidification methods was better than internal humidification method where leads to optimization the cell performance. Figure 2.3. Explained the external humidification in the PEM fuel-cells cells type [48].
Figure 2.3. An external humidification method in PEM fuel-cells [48].
The conventional method and used widely is bubble humidification. Figure 2.4. Explain the schematic of the bubble humidification. Bubble humidification was considered the better method for controlling reactant gases humidity can be controlling both the water contained in the bubble's reservoir and water temperature inside the bubble's reservoir. Bubble humidification has several advantages like:
Inexpensive method.
Not requirement more power. Simplicity method.
28
Figure 2.4. Bubble humidification [48].
(Ahmaditaba et al, 2018) designed and fabricated a bubble humidifier the and experimentally tested it, and examine the influence of water temperature and the water contain in the reservoir and the inlet airflow on the humidifier performance as shown in Figure 2.5.
The result showed that the relative humidity of the outlet air was decreased about (6% -11%) with an increasing inlet airflow rate from the 1 m3 h−1 to 3 m3 h−1. Any increase in the water temperature in the reservoir and water contain in the reservoir resulting in improvements in the cell performance.
In addition, he concluded, humidifier operation at the 20°C and increasing the water contain in reservoir from 5 cm to 7.5 cm has a strong effect on the humidifier performance [48].
29
Figure 2.5. Schematic diagram of bubble humidification system [48].
Many researchers had investigated in the effect of reactant gases relative humidity on the cell performance. (Y. Liu, S. Bai et al 2020) studied experimentally and theoretically, the effect of symmetrical humidification and asymmetrical humidification as seen in Figure 2.6. The study performed at three operating temperature, where the three-dimensional model built using ANSYS-FLUENT. Temperature and heat transfer (T and HT) model. The result showed that the cathode and anode relative humidity have a different effect on the cell performance, the cathode relative humidity has an effect on the cell performance greater than anode relative humidity, any increase in the cell operating temperature leads to decrease in the cell performance under low humidity.
The rational reasons for these results are increase in the relative humidity leads to increase in the membrane water contains thereby enhance the protonic conductivity and decreases the ohmic losses lead to optimizing the cell performance [32].
30
(Elif Eker Kahveci and Imdat Taymaz 2015) investigated the effect of reactant gases humidification on the (PEM) fuel cell performance, so for this purpose, they developed a three-dimensional computational fluid dynamic single phase of the PEM fuel-cells model, the results were shown, the anode side inlet gas humidification has a strong effect on the cell performance.
Figure 2.6. Symmetrical and asymmetrical humidification system [32].
(Burcu özsan, 2012) experimentally investigated the impact of the relative gas humidity and operating temperature on the cell performance by changing the operating temperature and relative gases humidity values as seen in Figure 2.7. The results were shown, the highest cell performance when the cell operated on 50% relative humidity for air and 100 % relative humidity for hydrogen at 60℃ operating temperature, the experiment results gave an indication the humidification process has vital importance of the on the cell operation [47].
31
Figure 2.7. Schematic diagram for PEM fuel-cells humidification system [47].
(Iranzo et al, 2015) developed three-dimensional PEM fuel-cells model to study the impact of the reactant relative humidity on the cell performance. By using an external humidifier, the results indicated that a high hydrogen relative humidity leads to increase in the current density, in addition, high oxygen relative humidity leads to increase in the current density, the biggest value of the PEM fuel-cells performance at (0.6 V) with 90 % cathode relative humidity [49].
That is clear from the deep study in the literature working on the relative humidity close to 100% is difficult to obtained high performance from the PEM fuel-cells because the high cost of steam production. Moreover, increasing the probability to occur the electrodes flooding which can be blocks the porous of gas diffusion layers (GDLs) thereby it prevents the gases from reaching the active sites on the catalyst layers (CLs) causes in a decrease in the cell performance. Strong relationship between hydrogen and oxygen relative humidity and cell performance. Strong relationship between water management inside the cell and hydrogen and oxygen relative humidity.
Cathode Humidifier Anode Humidifier FUEL CELL m H2O, in H2,in
m H2O,in Air,in
m H2O, in H2, out
m H2O,in Air,out
m Air,in m Air,in m H2,in m H2,out m Air,out T ca,in T an,in m H2,in
32
2.3. OPERATING TEMPERATURE
Operation temperature considers the most important conditions, it has a significant impact on the cell lifetime and performance, increasing in the operation temperature result in better cell performance. But must be adjusted desired operating temperature (50℃-80℃) [40]. Some of heat quantities inside PEM fuel-cells which had been generated via electrochemical reaction this heat had a negative impact on the cell performance so an excess heat must be taken away from the cell through coolant liquid, reactant gases or the dissipation through an outer surface of the cell via heat transfer phenomena. Make a better heat management on of the vital importance issue inside the cell, this issue made by add the heat generated with electrochemical reaction and quantities of heat enters with reactant gases must be equals the heat dissipated from the cell.
(Subin & Jithesh, 2018) studied experimentally the impact of the operation temperature, self-humidification on the cell performance by using a mixed flow distributer without any modification of the cell design. The result shown that an improvement in the cell performance when he used a mixed flow distributor which he found a mixed flow distributor is a suitable for dry air operation. They were concluded; an optimum operation temperature at high cell performance under dry feeding conditions, a high-temperature result in performance losses due to water evaporation rate where contribute in the membrane dehydration [50].
(Ozen et al, 2016) investigated the influence of the inlet gases humidity experimentally, cell temperature and the oxidized type on the cell performance, the experiment performed on the (25 cm2) active area as shown in Figure 2.8 [40]. The result showed that the reactant humidification process has a positive impact on the cell performance where the ohmic resistance decreased and the membrane water content increases result in an enhancement in the protonic conductivity leads to increase in cell performance.
33
Figure 2.8. Schematic diagram of Self-humidification PEM fuel-cells system [40]. On the other hand, the impact of the cell temperature has a major importance; they also noted cell performance improvement when using pure oxygen. They concluded the strong relationship between the inlet gases humidification process and the cell performance [40]. Other study (Taymaz, 2020) developed a three-dimensional steady-state single flow channel and counter flow numerical PEM fuel-cells model to investigate the operating conditions on the cell performance. The result showed the cell operating temperature play an import role in the cell performance they founded the adverse impact on the cell temperature when operating on the 343k [52].
(H. A. Dhahad, W. H. Alawee, 2018) studied experimentally the impact of operating temperature on the cell performance, when the cell operates at a variable hydrogen flow rate and under variable electrical load as can be shown in Figure 2.9. The results were showed, when the cell operates at high operating temperature the proton exchange membrane can be dried because at high operating temperature the water evaporate rapidly due to electrochemical reaction leads to proton exchange membrane dehydration causes in decreases in the membrane protonic conductivity result in a decrease in the cell performance.
34
Figure 2.9. Schematic diagram of fuel cell used in experimental [41].
(E. G. Barakat, A. K. et al, 2010) experimentally studied the influence of the operating conditions such as cell operating temperature, cell-operating pressure, and relative humidity of the cell inlet gases on the cell performance as shown in Figure 2.10. The results showed: Better cell performance have been achieved at fully hydrated proton exchange membrane (PEM), an increasing in the relative humidity of the cell inlet gases leads to increase in the cell power output, an increasing in the cell operating pressure causes in increase in the cell power output, and an increasing in the cell operating temperature leads to decrease in the cell power output [53].
35
2.4. RESEARCH PROBLEMS
Water molecules are main product from the electrochemical reactions in the PEM fuel-cell. The essential challenge toward the cell operation is membrane must maintain fully hydrated. Excessive water molecules lead blockage the flow channels, and prevent the reactant gases from reach the active sites thereby decrease the cells performance on the other hand, insufficient water maybe leads to membrane dehydration leads to increase in the ohmic resistance so decrease in the Proton exchange membrane PEM fuel-cell performance. From the deep investigate in the previous literature, it can be clear the strong relationship between the cell operation temperature and cell performance. Operation temperature considers the most important operation working.
Deep investigation in the previous literature, good cell working is achieved by good water management strategies, that is done by adjusting the proper operating temperature and inlet gases humidity so the research problems assigned in the water management issue as and the research aims to following:
Working with proper proton exchange membrane water levels by select proper cell operating temperature and proper inlet gases relative humidity.
Study the effect of various values of inlet gases relative humidity on the cell performance to select the proper value.
Study the impact of various values of cell operating temperature on the cell performance to select the proper value.
36
3. PART 3
METHOODOLOGY
This Part presents a numerical simulation of the PEM fuel-cell. The process had performed on the ANSYS-FLUENT included solving all governing equation as show in Figure 3.1. Part 3 aims to develop a three-dimensional PEM fuel-cell model to examined cell performance under three operating temperatures (55-65-75℃) and three values of hydrogen and oxygen relative humidity (50%-70%-90%) by select optimum operating temperature and select inlet humidification values.
37
3.1. NUMERICAL MODEL
Three-dimensional PEM fuel-cell model has been created using (CFD) commercial software ANSYS–FLUENT. The main objective of the cell modelling is to describe chemical and physical phenomenon that occurs inside the cells as can be seen in Figure 3.1. PEM fuel-cell simulation process includes three steps namely, preprocessing, processing, and post-processing as can be shown in Figure 3.2.
Preprocessing: include the Three-dimensional model designing process in the SolidWorks 2020 software. [58].
Processing: includes solving the conversation governing equation and electrochemical equation numerically to capture the flow properties of the PEM fuel-cell.
Post-processing: provide a clear understanding for simulation results and includes the display of the obtained results from the three-dimensional model simulation as contours or curves or video animation [59].
3.2. MODEL ASSUMPTIONS
In order to simplify the complex phenomena that is takes place inside the cell including a mass, momentum, electrochemical reactions take place and heat transport, the fallowing assumption are used for modeling process:
Fluid flow is study state and obey to Ideal gas law. Fluid flow inside the cell channel are laminar. The operating voltage was fixed 0.7 V.
Thermodynamics properties of the gases and the cell sold materials were assumed a constant.
38
Iso- inotropic and (GDLs), (CLs) and (PEM) were assumed to be homogenous electrodes.
Non iso -thermal operating temperature was varying from 70℃- 80℃-90℃, to investigate the effect of operating temperature on the (PEM) fuel cells. Catalyst layers (CLs) and gas diffusion layers (GDLs) and proton exchange
membrane were considered a porous zones.
The effect of the gravity assumed as a niglable value.
Figure 3.2. PEM fuel-cell simulation steps. Pre-prosses (geometry creation) Mesh genration Prosses (solving) Post-prosse (result)
39
3.3. GEOMETRY CREATION
PEM fuel-cell geometry creation is the first step in the cell simulation proses. Many of the computer-aided design software is available to do this task like SOLDWORK, GAMBIT, AUTOCAD, NT, ANSYS-DESIGN MODELER, and ANSYS–Space Claim. In this study. PEM fuel-cell geometry has been created by using ANSYS– Space Claim. Major aim of the geometry creation is to capture the physical dimensions of the real cell [60]. By using ANSYS–Space Claim cell geometry had been designed, including a nine layers: anode flow filed plates (FFPs-A), anode flow channels (FCHs-A), anode gas diffusion layers (GDLs-(FCHs-A), anode catalyst layers (CLs-(FCHs-A), proton exchange membrane (PEM), cathode catalyst layers (CLs-C), cathode gas diffusion layers (GDLs-C), cathode flow channels (FCHs-C), cathode flow filed plates (FFPs-C) as shown in Figure 3.3.
40
3.4. MESH GENERATION
PEM fuel-cell mesh generation process has been implemented by using ANSYS-DESIGN MODDELER-MESHING. By using hexahedral meshing method. The mesh generation process has a strong effect on the model results accuracy, so the good mesh generation is one of the difficult steps during the cell simulation. In order to obtain a high result accuracy, must be a balance between the cell geometry and the number of mesh elements and available memory of the computer. Where the specifications of the used hardware in the simulation process in a quad-core HP Elite Book 8560 p workstation with 4.0 GB as a RAM, 2.50 GHz with windows 10 as an operating system, the solver used 3.5 GB RAM". (PEM) fuel cell divided into 270000 finite elements to prepare the model for enters to the solver "FLUENT ", the time of computation in this thesis 12 hour. Three-dimensional model has been discrete to 270000 elements with 15 components. Figure 3.4. Shows the cell with mesh generated. The total number and the number of the elements generated for each component of cells listed in Table 3.2.
41
Table 3.1.Explained the PEM fuel-cell model geometries.
Table 3.2. Number of cell generated elements
Name selection step performed in ANSYS-DESIGN MESHER where the PEM fuel-cells have been divided into eight as (Cathode flow field plats (CFFPs), Anode flow field plats (AFFPs), Hydrogen flow fields, Oxygen flow fields, Cathode-terminal, Anode-terminal, Membrane electrode assembly, PEM fuel-cell -side wall) components as shown in Figure 3.5. And named each component to prepare their to insert to the ANSYS-FLUNET solver.
Layers Units Dimensions
Flow filed plates thickness Mm 1.2
Flow filed plates width Mm 2.4
Flow channels length Mm 20
Flow channels high Mm 0.6
Flow channels width Mm 0.8
Layers Number of generated elements
Flow filed plates 62500
Flow channels (FCHs) 12500
Gas diffusion layers (GDLs) 37500
Catalyst layers (CLs) 15000
Proton exchange membrane (PEM) 30000
Overall cell ELEMENTS 270000
Minimum Orthogonal Quality 2.3
42
a) Cathode-terminal b) Anode-terminal
c) Membrane electrode assembly d) PEM fuel-cell -side wall
43
e) Cathode-terminal f) Anode-terminal
g) Membrane electrode assembly h) PEM fuel-cell -side wall
44
3.5. BOUNDARY CONDITIONS
Hydrogen gases are enters to fuel cell through the flow channels (FCHs) in anode side then diffused through the gas diffusion layers (GDLs) to reach the active sits on the catalyst layers (CLs), an electrochemical reaction occurs on the catalyst layer surface result in oxidizing hydrogen atoms into electron and proton. Proton migrate from anode side to the cathode side through the proton exchange membrane while the electrons travel from the anode side to cathode side via an external load.
On the anode side an electrochemical reaction takes place on the anode side (CLs) surface between the hydrogen and platinum particles result in oxidizing the hydrogen to one electron and one proton. Protons are transfers from the anode to the cathode across the membrane, electrons moving via an outer load circuit from the anode to the cathode. On the cathode side an electrochemical reaction takes place (CLs) surface between the electrons and protons and oxygen on the cathode, result in water formation and release some heat equation.
The boundary condition and solver setup process has been implemented by using ANSYS-FLUENT. Refer to Figure 3.4. The boundary location 3-5. Anode and cathode inlet zones are set to be mass flow rates, where the gases flow (hydrogen on the anode side–oxygen on the cathode side) will enters through the cell. The boundary location at other side from flow channels are set to be pressure outlet condition specified where the flow leave from the cell.At the boundary location 2-6. Anode and cathode flow filed plats were sets, there are no proton leaves the cell so we enforce the membrane sloid potential equal to zero. Boundary location 1-7. Were set to be anode and cathode terminals.
The cell potential will difference. At the cathode terminal the VCELL = membrane solid
potential, where membrane solid potential equals to zero at anode side. Anode flow channels, (GDLs), (CLs), (PEM), and cathode flow channels, (GDLs), (CLs) were set to be fluid zones where the anode and cathode flow filed plates were set to solid zones, table 3.3. Summarize the main parameter condition used in the simulation.
45
Figure 3.6. Boundaries assignment in the PEM fuel-cell modeling
Table 3.3. Necessary parameters and boundaries for requirement studies model.
Parameters values Units
Operating temperature Uninform K
Operating pressure 200000 Pa
H2 mass flow rates 4.1996e-8 Kg/s
O2 mass flow rates 5.2e-7 Kg/s
Anode outlet gas pressure 0 Pa (gage)
cathode outlet gas pressure 0 Pa (gage)
Anode inlet mass friction H2 0.85 -
O2 cathode inlet mass friction 0.2 -
H2O inlet mass friction 0.1 -
46
start
Set the input cell voltage from 0.1 to 0.9 v
Set the cell pressure = 200kpa Change the cell temperature 55 65
-75
Iterate
Solve the equation
Solve the equation
Compute the current density and cell voltage
Test the solver converge
Stop Redefine the source terms
Redefine the H2,O2 mass
flow rates
Set the other required operation conditions
If the solver not converge
If the solver converge
47
4. PART 4
SIMULATION RESULTS AND MODEL VALIDATION 4.1. MODEL VALIDATION
Simulation results have been processed using ANSYS-CFD-POST, simulation results have validated with the experimental data which was taken from Wilberforce 2019 [1]. Good agreement was obtained between the currently comutataional model and Wilberforce 2019 experiment, expect the small difference in the current density value (0.0072A/cm2), the current density difference due to poor cell performance because of the negative effect of the electrode flooding which was neglected in mathematical model. Table 4.1. Listed the cell dimension used in the experiment experiment. Polarization curve and power output curve obtained from the mathematical model were compared with the polarization curve and power output curves obtained from mentioned experiment. Figure 4.1. Figure4.2. shows the variation of the cell performance and power output respectively.
Table 4.1.Cell dimensions used in the experiment [1].
Parameters Dimensions (mm)
Membrane thickness 0.05
Catalyst layers thickness 0.15
Gas diffusion layers thickness 0.5
48
Figure 4.1. Numerical validation with Wilberforce 2019 experiment.
Figure 4.2. Numerical validation of the (I-P) with Wilberforce 2019 experiment. 0 0.2 0.4 0.6 0.8 1 1.2 0 0.05 0.1 0.15 0.2 0.25 0.3 0.35 0.4 0.45 0.5 vo lta ge V
current density (A/cm2)
experimental computational model
0 0.05 0.1 0.15 0.2 0.25 0.3 0 0.1 0.2 0.3 0.4 0.5 p o w er d en sity W /cm 2
current density mA/cm2
![Figure 1.1. Energy consumption worldwide [3].](https://thumb-eu.123doks.com/thumbv2/9libnet/5399155.101964/19.892.170.767.659.1036/figure-energy-consumption-worldwide.webp)
![Table 1.2. High heating values of different fuels used in automotive [12].](https://thumb-eu.123doks.com/thumbv2/9libnet/5399155.101964/22.892.176.759.898.1075/table-high-heating-values-different-fuels-used-automotive.webp)

![Figure 1.7. Gas diffusion layers (GDLs) [18].](https://thumb-eu.123doks.com/thumbv2/9libnet/5399155.101964/28.892.170.762.645.1052/figure-gas-diffusion-layers-gdls.webp)
![Figure 1.8. Catalyst layers in (CLs) [25].](https://thumb-eu.123doks.com/thumbv2/9libnet/5399155.101964/31.892.174.757.127.554/figure-catalyst-layers-in-cls.webp)
![Figure 2.2. Water transportation mechanisms in the PEM fuel-cells [36-37].](https://thumb-eu.123doks.com/thumbv2/9libnet/5399155.101964/43.892.186.767.632.1012/figure-water-transportation-mechanisms-pem-fuel-cells.webp)
![Figure 2.5. Schematic diagram of bubble humidification system [48].](https://thumb-eu.123doks.com/thumbv2/9libnet/5399155.101964/47.892.184.773.128.559/figure-schematic-diagram-of-bubble-humidification-system.webp)
