ISSN 13921207. MECHANIKA. 2017 Volume 23(5): 696702
An Efficient Simulation-Based Search Method for Reliability-Based
Robust Design Optimization of Mechanical Components
M. MAYDA
Karamanoglu Mehmetbey University, 70100, Karaman, Turkey, E-mail: [email protected]
http://dx.doi.org/10.5755/j01.mech.23.5.15745
1. Introduction
Nowadays optimization under uncertainty (OUO) in engineering design, which is also known to be stochastic design optimization, has gained an ever increasing im-portance. OUO can be grouped into three classes: reliabil-ity-based design optimization (RBDO), robust design opti-mization (RDO) and reliability-based robust design optimi-zation (RBRDO). RBDO focuses on deducing a failure probability of a system consisting of random design varia-bles or parameters with known probability distributions. Numerous research on RBDO has been conducted. For ex-ample, Yang et al. [1] proposes a methodology for RBDO to handle uncertainties in the offshore wind turbines design process. For that purpose, they constructed a finite element (FE) model and generated some design points from the model. Using a surrogate or an approximate model built based on the design points, they implemented the reliability analysis in a reasonable computational cost. Similarly, there are a lot of research in the literature [2-4]. Nevertheless, the variation in the objective function is often not minimized in RBDO; instead, it investigates the probabilities at the tails of the distribution function [5]. RDO concentrates to mini-mize the variability in a system without eliminating the source of the variability; thus to make the system insensitive to effects of the fluctuations [6, 7]. The earliest approach on RDO is known to be Six Sigma Quality [8] and Taguchi method [9, 10]. These methods aims to reduce the output variation in the input-output system and accordingly to im-prove the product quality. Most of recent researches on RDO have been concentrating on multi-objective optimiza-tion using surrogate models and various algorithms such ge-netic algorithm and Particle Swarm Optimization (PSO) al-gorithm [11-14]. However, Forouzandeh Shahraki and Noorossana [15] express that the merits of RDO and RBDO should be combined to ensure both reliability and robustness of the designs, which is the main aim of RBRDO method. Although the concept of RBRDO is not new, the RDRDO method is gaining an ever increasing importance when seen in the recent literature [15-17]. In this work, the RBRDO method is taken as a base optimization procedure.
Applying all of these optimization methods in de-sign problems, by its nature, requires more computational-intensive efforts compared to the deterministic case [18]. To mitigate this issue, surrogate models built based on design inputs and outputs have been widely used in recent years [19]. The use of surrogate models instead of real models drastically reduces the computational cost of the design op-timization methods [20]. Accordingly, the frequently used surrogate models are Kriging model, Artificial Neural Net-work (ANN) model and Polynomial models. However, there
are still several challenges to be overcome. First, the exist-ing formulations and implementations of RBRDO are com-plex to apply them to design problems [21]. Second, despite the significant improvements in the computational cost of building an approximate model, a computationally efficient method of optimum search is needed to enhance the RBRDO process. To address these issues, in this work, an efficient simulation-based search method for RBRDO prob-lems is proposed. The proposal to the first issue is a simple RBRDO definition by implementing it through Monte-Carlo Simulation (MCS), which is one of the simplest and the most powerful methods [19]. MCS grounds on randomly generating samples based on stochastic characteristics of random variables and evaluating the sample set generated against given criteria. Also, as a surrogate model, ANN is used to build an approximate model representing relation-ships between design variables and responses. Therefore, the combination of MCS and ANN is considered to make the optimization process more efficient and effective. The proposal to the second issue is that a search vector based on correlation coefficients between design variables and re-sponses is considered with the aim of accurately selecting searching direction and step lengths towards the robust de-sign point in a short time.
The reminder of this paper is organized as follows: In Section 2, the definition of design optimization under un-certainty is described. In Section 3, the proposed simulation-based search method is explained in detail. In Section 4, a numerical example is illustrated on the design of a car win-dow handle to show the effectiveness and efficacy of this method. In Section 5, a conclusion and future work are stated.
2. Definition of design optimization under uncertainty
Design optimization can be classified as two cate-gories: deterministic design optimization and stochastic sign optimization. The definitions of two categories vary de-pending on where to use them. A deterministic design prob-lem can be generally formulated in the literature as [18]:
( ) : ( ) 0, 1, ..., , (1) ( ) 0, 1, ..., , , j ineq k eq L U Min f x subject to h x j n g x k n x x x
where f is stands for the objective function.
1 2
{ , ,..., Nd}
x x x x denotes the vector of deterministic de-sign variables. Nd is the number of deterministic design variables. h and g represent constraint functions. nineqis the
equality constraints. U
x and L
x are the upper and lower lim-its of the design variables respectively.
The stochastic design optimization deals with opti-mizing designs under uncertainty; therefore, this kind of timization can be considered as reliability-based design op-timization (RBDO), robust design opop-timization (RDO) and reliability-based robust design optimization (RBRDO). The definition of a generic RBDO process is given by
( , ) : ( ( , )) , 1,..., (2) ( ( , )) 1 , , m m ls m m L U Min f x subject to P L x R m n or P L x R x x x
where f stands for the objective function. { , 1 2, ...,Nr}
is the vector of random design variables or parameters. Nr is the number of random design variables. represents the mean value of a random design variable. Lm() stands for
limit-state functions indicating margins of failures of prob-ability of a design. nlsis the number of limit-state functions.
m
R is the level of target reliability, which is a percentile value.
RDO focuses on the variation of the objective function. A generic definition of RDO is as follow [22]:
( ( ( , )), ( ( , ))) : (3) ( , ), 1,..., , , m ls L U Min f x f x subject to L x m n x x x
where ( ) and ( ) are the mean and standard deviation values of the objective function, f, respectively.
Nevertheless, to account for both the reduction in variability of a system and mitigating failure probability stemming from uncertainties, the RBRDO process, based on RBDO and RDO, is typically followed by using the defini-tion [23]: ( ( ( , )), ( ( , ))) : ( ( , )) , 1,..., , (4) ( ( , )) 1 , . m m ls m m L U Min f x f x subject to P L x R m n or P L x R x x x
In this work, the RBRDO definition is considered as a base model.
3. The proposed simulation-based search method
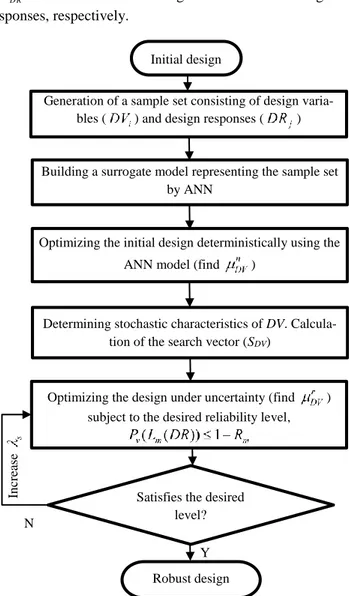
In this section, the proposed simulation-based method is explained in five steps, given by a flowchart in Fig. 1.
1. Prior to starting the process, a design problem is chosen and analyzed. Herein, the main challenge is to deal with the experimental or simulated data instead of analytical data because there is no any analytical equation or relation-ship between the design inputs and outputs. Thus, in the scope of this work, the attention is given to the design data obtained from FEM (Finite Element Method) simulations. In this step, a sample set consisting of design variables
DVi,i1,...,nDV
and design responses (DRj,
1, ..., DR
j n ) are obtained from FEM simulations. nDVand
D R
n are the number of design variables and design re-sponses, respectively.
Fig. 1 The flowchart of the proposed simulation-based method
2. A surrogate model is needed to represent the linear or non-linear relationship between the DV and DR in most of RBRDO problems. The ANN model is considered as a surrogate model so as to model the non-linear relation-ship between the DV and DR obtained from FEM simula-tions. To validate this model, the sample set is divided into two groups; one group is used for training the ANN model and the other for testing the model in terms of R2 value.
3. To reduce the process time of uncertainty-based modelling and optimization, a deterministic optimization of the initial design within ranges with predetermined lower and upper bounds is realized by using the well-known sam-pling method, MCS. The optimization process yields a nom-inal or mean value of ith design variable of the first optimal design to be found deterministically prior to robust design optimization, which is denoted as
i n D V
and considered as a starting design point for the next steps.
4. In this step, the stochastic characteristics of the
DV, such as distribution type, standard deviations of the DV,
are specified depending on the existing knowledge or expe-rience. The standard deviation values of DV,D V are
as-sumed to be subjected to a known coefficient of variation ( Initial design
Generation of a sample set consisting of design varia-bles ( ) and design responses ( )
Building a surrogate model representing the sample set by ANN
Optimizing the initial design deterministically using the ANN model (find )
Determining stochastic characteristics of DV. Calcula-tion of the search vector (SDV)
Optimizing the design under uncertainty (find ) subject to the desired reliability level,
Satisfies the desired level? Robust design Y N In cre ase
DV
), also so-called as COV. Therefore, D V are calculated
by the formula:
i i i
n
DV DV DV
,
which is the standard de-viation of ith design variable. Other task is to calculate a search vector (SD V ) that has descent or ascent directionsleading to optimal design points. The SD V can be found by
1 1 , (5) , 1, i i i DVi DR DR DVi n DV DV DV w n n w ij j j j j S Wp Wp
where i DVS is the coefficient of variation for ith design var-iable.
DVi
w
is a relatively weighted correlation coefficient corresponding to each design variable. ij is the correlation coefficient between ith design variable and jth design re-sponse. Wpj is a weight value of relative importance (as
percentage) for jth design response, which can be deter-mined by the decision maker. Also the summation of theWp is assumed to be 1.
5. If the RBRDO definition given in Eq. (4) is re-formulated in line with the aim of this research, the new form of the definition is as follows:
( , , ) 1, ..., , , (6) : ( ( )) 1 , r DV DV s s r n T T DV DV DV s v m m Min m S Subject to P L DR R
here DVr is the vector of mean values of DV of the robust design.s denotes a scaling factor that determines the min-imum step length for the SD V for each evaluation of the
limit-state or constraint function. m is a maximum integer or decimal value that is needed to be found in the optimization loop because the m might help to search for a minimum
r DV
.Pv represents the probability of violation of the
con-straint or limit-state functions.
4. Numerical example
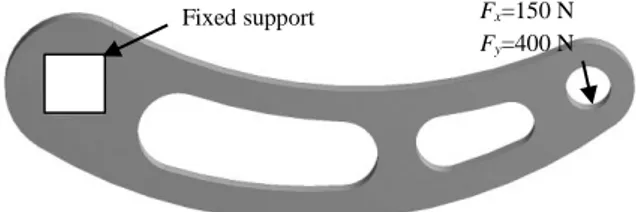
In this section, the design optimization of a car window handle under uncertainty is considered to show how to use the proposed method in practice, and accordingly to clearly demonstrate its effectiveness and efficacy. The ini-tial geometrical dimensions of the handle are indicated in Fig. 2. Herein, the letters V and F in dimensions refer a de-sign variable and fixed dimension, respectively. Totally, five design variables (two distances (two equal lengths, 6mm), two radiuses (R97 and R100) and thickness (4.4 mm)) are selected for the design optimization. With re-gard to boundary conditions, there is an applied load on the right side of the handle, its x and y components are Fx of 150
N and Fy of 400 N, and a fixed support on the other side of
the handle (Fig. 3). The safety factor and mass of the handle under the boundary conditions are accepted as design re-sponses (DR).
V: Variable. F: Fixed dimension in mm
Fig. 2 The initial geometrical dimensions of the handle
Fig. 3 The boundary conditions of the handle The lower and upper bounds of the design varia-bles and the initial values of the design are presented in Ta-ble 1. Depending on the bounds of the design variaTa-bles, a set of 101 samples consisting of the five DV is established using the factorial design technique, and the corresponding two DR (safety factor and mass) are computationally gener-ated using FEM simulations.
Table 1 The lower and upper bounds of the design variables
and the initial values of the design Design variables
Symbol Initial Limit values
Distance DV1 6 5 ≤ DV1 ≤ 7
Distance DV2 6 5 ≤ DV2 ≤ 7
Radius DV3 97 85 ≤ DV3 ≤ 120
Radius DV4 100 90 ≤ DV4 ≤ 130
Thickness DV5 4.4 4 ≤ DV5 ≤ 6
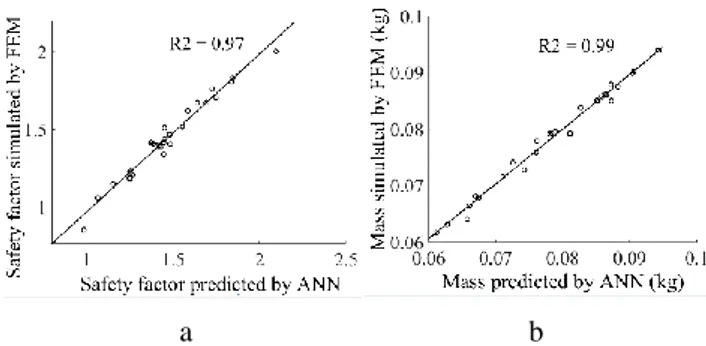
75 of the 101 samples generated is used to train the ANN model, the rest is used to test the accuracy of the ANN model. At the result of the network training, a promising ANN model, which is built based on the algorithm of feed forward back propagation, has three hidden layers, consist-ing of 12, 16 and 4 neurons, respectively. A strong correla-tion with high R2 values of 0.97 and 0.99 is achieved for the testing set of safety factor and mass, respectively (Fig. 4). In other words, the best ANN model confirm that one can gen-erate accurate values of safety factor and mass without FEM simulations by utilizing the ANN model because the testing results of the ANN model is found to be a good agreement with the FEM simulations. Moreover, by means of this model, it is possible to generate a large number of samples of design variables-responses, and to faster search for the best optimum design point among these many samples when compared to that of FEM simulations.
Fx=150 N
Fy=400 N Fixed support
a b
Fig. 4 R2 values achieved for the testing set: a) for safety factor, b) for mass
After obtaining the surrogate model based on ANN, the next step is to realize the deterministic design op-timization to find nominal or mean values of design varia-bles. To that end, uniform distribution is assigned to each design variable according to their ranges with predeter-mined lower and upper bounds given in Table 1, and then Monte-Carlo simulations with 10,000 realizations are im-plemented. The initial and optimal/nominal mean values of design variables found ( DVini and DVn ) are presented in Table 2. Compared to the initial design variables, higher safety factor and lower mass values are obtained by the de-terministic optimization method. Herein, the starting point of the stochastic design optimization is a critical point. For that end, the deterministically obtained design point
D Vn
can be a reasonable and rational choice as a starting point. Accordingly, the limit-state function can be defined as
1 2
( 1.4982 0.0662) 0
v
P DR DR , which refers to
nearly zero probabilities that the safety factor is lower than 1.4982 and the mass is higher than 0.0662 kg under uncer-tainty conditions. By doing so, it may be possible to find design solutions that are more robust and reliable at worst-case compared to those of the deterministic worst-case.
Table 2 Optimal design variables and responses found
by deterministic optimization
Design variables and responses
Symbol Initial n DV , DR Distance DV1 6 5.4915 Distance DV2 6 6.9934 Radius DV3 97 119.7627 Radius DV4 100 129.9424 Thickness DV5 4.4 4.1992 Safety factor DR1 1.2689 1.4982 Mass DR2 0.0692 0.0662
n Step 4, the stochastic characteristics of DV of the handle are assumed to be Gaussian distribution and a varia-tion subjected to a DVof 0.0001 for each DV. The weights of the correlation coefficient for safety factor and mass re-sponses are assumed to be equal importance (0.5 and 0.5). In consideration of these given and assumed values,
DVi w , DV i and i DV
S are easily calculated via Eq. (5). All of the re-sults of these calculations are presented in Table 3.
Table 3 The results of search vector and other parameters
DVi 0.5 DR1 11 0.5 DR2 12 wDVi n DV DV DV i i DV S DV1 0.280 0.261 0.279 5.491 0.0001 0.000549 0.000148 DV2 0.565 0.136 0.544 6.993 0.0001 0.000699 0.000245 DV3 0.125 -0.133 0.112 119.762 0.0001 0.011976 -5.1E-05 DV4 -0.079 0.059 -0.071 129.942 0.0001 0.012994 -0.000126 DV5 0.543 0.943 0.562 4.199 0.0001 0.00042 0.000311
In the last step, first, the RBRDO formulation in Eq. (6) is rewritten in consideration with the given or found variables, responses and constraints of the design problem, which is given below:
1 2 ( , , ) 1, 2, 3, 4 1,..., . : (7) ( 1.4982 0.0662) 0. i i s r DV DV s s v Min i min Subject to P DR DR
In the optimization definition, the constraint of
1 2
( 1.4982 0.0662) 0
v
P DR DR is specified
accord-ing to the deterministically found optimal results: the safety factor of 1.4982 and the mass of 0.0662 kg. Here, the pri-mary focus is to investigate the impact of uncertainties in the design variables on the deterministically optimized de-sign responses, and also how to improve reliability and ro-bustness of the deterministically optimum design under un-certainty. For this purpose, to reflect the uncertainty to the five design variables, it is assumed that the mean of each design variable is of a coefficient of variation of 0.0001 stemming from manufacturing or other reasons. Under these conditions, when the described procedure in Step 5 is em-ployed, the optimization results of probability of violation
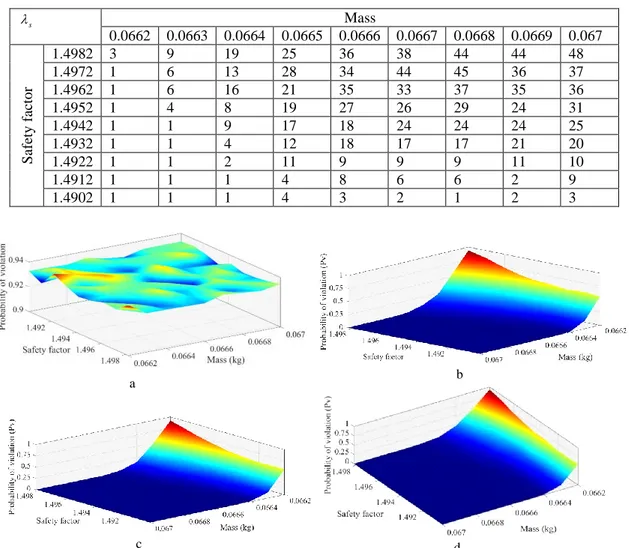
Pv and scaling factor (s) are obtained (Table 4 and 5).According to Table 4 and 5, an optimum robust design point can be selected among the points where the Pv =0.
Moreo-ver, to decide that, a cost function that is the ratio of mass to safety factor is considered, and the point(s) where the cost function has the lowest value is chosen as the most reliable and robust design point. Accordingly, the optimum point is found to be the intersection between the safety factor of 1.4972 and the mass of 0.0667 kg. The scaling factor (s) at that point is found to be 44. When the formula of DVr in Eq. (6) is employed, the robust mean values of design variables and the corresponding responses are easily calcu-lated.
In addition, to explicitly show the found design so-lution to be more robust and reliable compared with the ini-tial and deterministic design values, the Pv values for
ini DV
and DVn at the same constraint as that of the robust solution (P DRv( 11.4982 DR20.0662)are separately com-puted using Monte-Carlo simulations with 1000 realiza-tions. All of these calculation results are presented in Ta-ble 6.
Table 4 The results of the probability of violation (Pv) calculation
v P Mass 0.0662 0.0663 0.0664 0.0665 0.0666 0.0667 0.0668 0.0669 0.067 Saf ety f ac to r 1.4982 0.921 0.547 0.204 0.0580 0.0090 0.0010 0 0 0 1.4972 0.839 0.417 0.153 0.0420 0.0040 0 0 0 0 1.4962 0.746 0.341 0.109 0.0170 0.0020 0 0 0 0 1.4952 0.687 0.251 0.0580 0.0110 0.0020 0 0 0 0 1.4942 0.627 0.203 0.0490 0.0050 0 0 0 0 0 1.4932 0.596 0.154 0.0300 0.0040 0 0 0 0 0 1.4922 0.585 0.134 0.0160 0 0 0 0 0 0 1.4912 0.575 0.145 0.0140 0.0010 0 0 0 0 0 1.4902 0.539 0.126 0.0090 0 0 0 0 0 0 Table 5 The optimization results of the scaling factor (s) calculation
s Mass 0.0662 0.0663 0.0664 0.0665 0.0666 0.0667 0.0668 0.0669 0.067 Saf ety f ac to r 1.4982 3 9 19 25 36 38 44 44 48 1.4972 1 6 13 28 34 44 45 36 37 1.4962 1 6 16 21 35 33 37 35 36 1.4952 1 4 8 19 27 26 29 24 31 1.4942 1 1 9 17 18 24 24 24 25 1.4932 1 1 4 12 18 17 17 21 20 1.4922 1 1 2 11 9 9 9 11 10 1.4912 1 1 1 4 8 6 6 2 9 1.4902 1 1 1 4 3 2 1 2 3
Fig. 5 The 3D graph representation of different optimization cases with different relative importances: a) The case without implementing optimization, b) 5% SF-95% M, c) 95% SF-5% M, d) 50% SF-50% M
a b
Fig. 6 The solid geometries of initial and robust design solutions: a) initial design, b) robust design
d b a
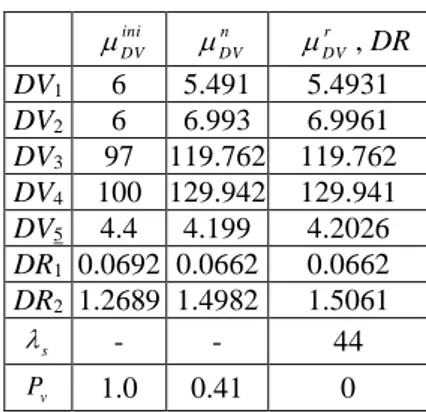
As seen in the Table, the robust solution ensures a
v
P of zero, whereas the initial and deterministic optimal so-lution can only ensure a Pvof 1.0 and 0.41, respectively at
the same constraint conditions. Also, this robust design searching process takes only about 20 seconds. Therefore, all of the results demonstrates that the proposed method en-ables designers to efficiently and effectively find reliable and robust designs under uncertainty.
Table 6 The comparison of the initial, nominal and robust design solutions
ini DV n DV r DV , DR DV1 6 5.491 5.4931 DV2 6 6.993 6.9961 DV3 97 119.762 119.762 DV4 100 129.942 129.941 DV5 4.4 4.199 4.2026 DR1 0.0692 0.0662 0.0662 DR2 1.2689 1.4982 1.5061 s - - 44 v P 1.0 0.41 0
The proposed method also provides designers with a flexibility to decide against the relative importance of the design response criteria. In other words, in the design exam-ple, it is possible to give more importance to safety factor or mass before implementing the robust optimization. In Fig. 5, the case without implementing optimization, the case of 5% SF- 95% M, the case of 95% SF- 5% M, and the case of 50% SF- 50% M (SF: safety factor, M: mass) is illustrated by the 3D graph. The found robust optimization solution above is considered in the case of 50% SF- 50% M, and the solid geometries of initial and robust design solutions are shown in Fig. 6.
5. Conclusion
In this work, an efficient simulation-based search method for reliability-based robust design optimization is proposed, which consisting of five steps: 1. Generating a sample set for design variables and responses from FEM; 2. Building a surrogate model representing the sample set by using ANN; 3. Optimizing the design deterministically via MCS; 4. Determining stochastic characteristics and cal-culating the search vector; 5. Optimizing the design under uncertainty via MCS. This proposed method is applied to the design optimization of a car handle to show its effective-ness and efficacy. The searching or optimization process took only 20 seconds. Results demonstrated that the pro-posed method enable designers to efficiently and effectively find reliable and robust designs under uncertainty, and also provides designers with a flexibility to decide about the rel-ative importance of the design response criteria. To enhance this method, some new directions on this area can be sug-gested: 1. Integrating this method with heuristic optimiza-tion methods such as genetic algorithm and particle swarm optimization algorithm; 2. Applying this method in the com-plex system designs.
References
1. Yang, H.; Zhu, Y.; Lu, Q.; Zhang, J. 2015. Dynamic reliability based design optimization of the tripod sub-structure of offshore wind turbines, Renewable Energy 78: 16-25.
http://dx.doi.org/10.1016/j.renene.2014.12.061. 2. Allen, M.; Maute, K. 2004. Reliability-based design
optimization of aeroelastic structures, Structural and Multidisciplinary Optimization 27(4): 228-242. http://dx.doi.org/10.1007/s00158-004-0384-1.
3. Xia, B.; Lü, H.; Yu, D., and Jiang, C. 2015. Reliability-based design optimization of structural systems under hybrid probabilistic and interval model, Computers & Structures 160: 126-134.
http://dx.doi.org/10.1016/j.compstruc.2015.08.009. 4. Dubourg, V.; Sudret, B., and Bourinet, J.-M. 2011.
Reliability-based design optimization using kriging surrogates and subset simulation, Structural and Multidisciplinary Optimization 44(5): 673-690. http://dx.doi.org/10.1007/s00158-011-0653-8.
5. Zang, C.; Friswell, M.I.; Mottershead, J.E. 2005. A review of robust optimal design and its application in dynamics, Computers & Structures 83(4–5): 315-326. http://dx.doi.org/10.1016/j.compstruc.2004.10.007. 6. Shah, H.; Hosder, S.; Koziel, S.; Tesfahunegn, Y.A.,
and Leifsson, L. 2015. Multi-fidelity robust aerodynamic design optimization under mixed uncertainty, Aerospace Science and Technology 45: 17-29.
http://dx.doi.org/10.1016/j.ast.2015.04.011.
7. Wu, J.; Gao, J.; Luo, Z.; Brown, T. 2016. Robust topology optimization for structures under interval uncertainty, Advances in Engineering Software 99: 36-48.
http://dx.doi.org/10.1016/j.advengsoft.2016.05.002. 8. Harry, M.J.1997.The nature of Six Sigma Quality.
Shaumburg: IL: Motorola University Press.
9. Taguchi, G.; Chowdhury, S.; Taguchi, S.2000.Robust Engineering. New York: McGraw Hill.
10. Taguchi, G. 1993.Taguchi on robust technology development: Bringing qualityengineering upstream. New York: New York: ASME Press.
https://doi.org/10.1115/1.800288.
11. Lima, R.; Soize, C.; Sampaio, R. 2015. Robust design optimization with an uncertain model of a nonlinear vibro-impact electro-mechanical system,
Communications in Nonlinear Science and Numerical Simulation 23 (1–3): 263-273.
http://dx.doi.org/10.1016/j.cnsns.2014.11.014.
12. Zaman, K.; McDonald, M.; Mahadevan, S.; Green,
L. 2011. Robustness-based design optimization under
data uncertainty, Structural and Multidisciplinary Optimization 44(2): 183-197.
http://dx.doi.org/10.1007/s00158-011-0622-2.
13. Tammareddi, S.; Sun, G.; Li, Q. 2016. Multiobjective robust optimization of coronary stents, Materials & Design 90: 682-692.
http://dx.doi.org/10.1016/j.matdes.2015.10.153. 14. Stocki, R.; Szolc, T.; Tauzowski, P.; Knabel, J. 2012.
Robust design optimization of the vibrating rotor-shaft system subjected to selected dynamic constraints, Mechanical Systems and Signal Processing 29: 34-44. http://dx.doi.org/10.1016/j.ymssp.2011.07.023.
15. Forouzandeh Shahraki, A.; Noorossana, R. 2014. Reliability-based robust design optimization: A general methodology using genetic algorithm, Computers & Industrial Engineering 74: 199-207.
http://dx.doi.org/10.1016/j.cie.2014.05.013.
16. Wang, P.; Wang, Z.; Youn, B.D.; Lee, S. 2015. Reliability-based robust design of smart sensing systems for failure diagnostics using piezoelectric materials, Computers & Structures 156: 110-121.
http://dx.doi.org/10.1016/j.compstruc.2015.04.012. 17. Gang, W.; Wang, S.; Augenbroe, G.; Xiao, F. 2016.
Robust optimal design of district cooling systems and the impacts of uncertainty and reliability, Energy and Buildings 122: 11-22.
http://dx.doi.org/10.1016/j.enbuild.2016.04.012. 18. Choi, S.-K.; Grandhi, R.V.; Canfield,
R.A.2007.Reliability-based Structural Design. Springer-Verlag London.
19. Li, F.; Sun, G.; Huang, X.; Rong, J.; Li, Q. 2015. Multiobjective robust optimization for crashworthiness design of foam filled thin-walled structures with random and interval uncertainties, Engineering Structures 88: 111-124.
http://dx.doi.org/10.1016/j.engstruct.2015.01.023. 20. Díaz, J.; Cid Montoya, M., and Hernández, S. 2016.
Efficient methodologies for reliability-based design optimization of composite panels, Advances in Engineering Software 93: 9-21.
http://dx.doi.org/10.1016/j.advengsoft.2015.12.001. 21. Seshadri, P.; Constantine, P.; Iaccarino, G.; Parks,
G. 2016. A density-matching approach for optimization
under uncertainty, Computer Methods in Applied Mechanics and Engineering 305: 562-578.
http://dx.doi.org/10.1016/j.cma.2016.03.006.
22. Fang, J.; Gao, Y.; Sun, G.; Xu, C.; Li, Q. 2015. Multiobjective robust design optimization of fatigue life for a truck cab, Reliability Engineering & System Safety 135: 1-8.
http://dx.doi.org/10.1016/j.ress.2014.10.007.
23. Paiva, R.M.; Crawford, C.; Suleman, A. 2014. Robust and Reliability-Based Design Optimization Framework for Wing Design, AIAA Journal 52: 711-724.
http://dx.doi.org/10.2514/1.J052161.
M. Mayda
AN EFFICIENT SIMULATION-BASED SEARCH METHOD FOR RELIABILITY-BASED ROBUST DESIGN OPTIMIZATION OF MECHANICAL COMPONENTS
S u m m a r y
Reliability-based robust design optimization (RBRDO) aims to minimize the variation in the system, and ensure the levels of failure probability of the system. Despite significant improvements on RBRDO, several challenges have been emerging. First, the existing implementations of RBRDO are complex to apply them to design problems. Sec-ond, an efficient method of optimum search is needed to en-hance the RBRDO process. To address these issues, in this work, a simulation-based search method for RBRDO is pro-posed by utilizing Monte-Carlo Simulation and Artificial Neu-ral Network. Specifically, to accurately select an optimum searching direction and step lengths, a search vector based on correlation coefficients between design variables and re-sponses is put forward. This proposed method is applied to the design of a car handle to show its effectiveness and efficacy. Results demonstrates that this method enables to efficiently and effectively find reliable and robust designs under uncer-tainty compared to the deterministic case.
Keywords: Monte Carlo method, reliability, robust design
op-timization, search method.
Received July 07, 2016 Accepted October 13, 2017