Full Terms & Conditions of access and use can be found at
http://www.tandfonline.com/action/journalInformation?journalCode=rael20
Download by: [Bilkent University] Date: 27 October 2017, At: 06:09
Applied Economics Letters
ISSN: 1350-4851 (Print) 1466-4291 (Online) Journal homepage: http://www.tandfonline.com/loi/rael20
Measuring the degree of block interdependence
between agricultural and non-agricultural sectors
in Turkey
Serdar Sayan & Nazmi Demir
To cite this article: Serdar Sayan & Nazmi Demir (1998) Measuring the degree of block
interdependence between agricultural and non-agricultural sectors in Turkey, Applied Economics Letters, 5:5, 329-332, DOI: 10.1080/758524412
To link to this article: http://dx.doi.org/10.1080/758524412
Published online: 02 Nov 2006.
Submit your article to this journal
Article views: 29
View related articles
Applied Economics Letters, 1998, 5 , 329-332
Measuring the degree of block interdependence
between agricultural and non-agricultural
sectors in Turkey
SERDAR SAYAN and NAZMI DEMIR
Department of Economics, Bilkent University, 06533 Bilkent, Ankara, Turkey Received 22 May 1997
Based on the similarity of productive activities carried out by sectors, national input- output (10) matrices may be divided into sub-matrices each representing a broader group of sectors called blocks. The strength of linkages among sectors that belong to different blocks would then show the degree of block interdependence. The measurement of this degree is useful in many areas including structural change analysis, evaluation of various support policy alternatives or for deciding whether a general or a partial equilibrium framework should be used to investigate the effects of an exogenous shock to a particular sector or a block. This paper introduces a technique that can be used to gauge the degree of block interdependence based on simulation results from demand and supply-side I 0 models. The application of the technique is illustrated for the case of interdependence between agricultural and non-agricultural blocks in Turkey which recently signed a Customs Union Agreement with the EU. The results indicate that, although Turkey's Agreement covers trade relations in non-agricultural sectors alone, the agricultural sectors must face indirect effects the magnitude of which depend, to a great extent, on the degree of interdependence between blocks considered here.
1
I. INTRODUCTIONEach production sector in an economy is linked to others through the inputs purchased from and outputs delivered to them. The measurement of the strength of these linkages has always been of great interest to economists because of their role in transmitting the effects of various shocks across the economy. This interest explains why almost all countries compile data on intersectoral flows to construct their I 0 coefficient matrices periodically (Jensen, 1994). A related problem is the measurement of the degree of interdependence between blocks, i.e., broader groups of activities each containing sectors that are interlinked.
This paper introduces an 10-based technique that can be used to gauge the degree of block interdependence. The technique is potentially useful in many areas and links up well with the existing literature on analysis of I 0 multipliers (Jensen, 1994), identification of key sectors (Chen, 1996), and sources of structural change (Korres, 1996). The use of the
technique is illustrated here in reference to the linkages between the agricultural complex (primary agriculture and agricultural processing sectors) and the non-agricultural economy in Turkey. Turkey recently signed a Customs Union Agreement with the EU covering non-agricultural trade alone. The results reported below have been obtained primarily to see whether an investigation of the effects of the Customs Union on Turkish economy may justifiably overlook Turkish agriculture on account of its exclusion from the Agreement. But they are also useful to evaluate the potential effects of agricultural support policy changes on non-agricultural economy. In the light of the post-Uruguay Round tendency in the world to switch from price-distorting subsidies towards decoupled income support to agriculture (Sayan, 1996; Tangermann, 1996), the latter has, in fact, become a question of interest to other countries as well. The degree of interdependence between agricultural and non-agricultural blocks has thus a greater policy relevance for many countries now than before.' The next section of the paper describes the
'The conventional I 0 model briefly described in the next section is a special general equilibrium model characterized by certain restrictions on production, technologies, final demands, and supply schedules for primary production factors (e.g., Hertel, 1990; McGregor er al., 1995). As such, it ignores the changes in relative prices and their resource allocation effects resulting from policy changes. But since a switch to decoupled payments would suppress (or at least minimize) the relative price effects, it is expected to increase the relevance and the predictive power of I 0 models.
S. Sayan and N.
Demir
mechanics of the technique. Section I11 reports results and presents conclusions.
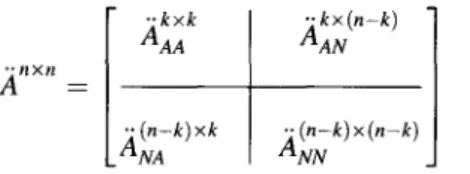
Here, Ah is the k
x
k matrix of I 0 coefficients representing11. BLOCK INTERDEPENDENCE IN THE I 0 flows within the agricultural complex (block). Likewise, the FRAMEWORK (n
-
k)x
(n - k) matrix ANN shows the I 0 coefficients for flows within the non-agricultural block. ANA and AAN are The earliest systematic attempt to measure sectoral inter- rectangular matrices of size (n - k) x k and k x ( n - k), dependence was the demand-side 1 0 model developed by respectively, and represent the delivery of inputs from non- Leontief (1936). For the case of n sectors indexed over agro to agro sectors, and agro inputs received by non-agro i, je(1,2,..
.,
k, . ..
,
n), the material balance equations of the sectors. Then, (I - A) is given as:model are
A X + F = X ( I )
where A is an n
x
n matrix of I 0 coefficients, X, and F (4)are n-vectors of sectoral outputs and final demands, respec- tively. Given F the
X
vector solving the system would bewhere the diagonal elements of matrices DM and DNN are of
x
= (I - A)-IF (2) the form (1 - ai,,), with -ai,,'s elsewhere. The Leontief inverse of this partitioned matrix iswhere I is n
x
n identity matrix and (I - A)-') is the so-called Leontief inverse.Since U , , ~ ' S are fixed, Equation 2 shows how sectoral gross
domestic outputs (GDOs) would change in response to an exogenous shock affecting F,, the final demand for the output of sector j. While a,,,'s themselves are indicators of sectoral interdependence within this f r a m e ~ o r k , ~ it is often the case that exogenous policy changes target or affect a block as a whole rather than an individual sector, or some structural transformation takes place affecting a certain block differently than others.
For such cases, a measure of block interdependence is obtained by partitioning A into blocks and counterfactually setting the a,,, coefficients capturing the linkages among sectors in different blocks equal to zero. A comparison of the actual (i.e., observed) GDOs and TBLs to those resulting from the counterfactual assumption of a lack of I 0 linkages across different blocks would show the strength of block inter- dependence. That is, when the deviations between actual and counterfactual values of GDOs and TBLs turn out to be sufficiently small (large), one can conclude that the block interdependence is weak (strong).4 When agricultural and non- agricultural blocks are to be considered, partitioning of A
would be through:
- BDNA DA;
( 5 ) where B = (DNN - D ~ A D ~ D ~ N ) - ' .
The counterfactual assumption that changes in the final demands for non-agro (agro) sectors have no impact on agro (non-agro) sectors can be simulated by setting all ai,j's in DAN (DNA) equal to zero so that DAN = 0 (DNA = 0, i.e., the null matrix (Carter, 1965). For DAN = 0, (5) becomes:
The resulting changes in sectoral GDOs can be found by multiplying the difference between matrices in Equations 5 , and 6 by the given F vector. For agro sectors, for example, the impact on the sectoral GDOs can be found through:
*
Letting X,,, represent the value of purchases of input i by sector j, and X, the value of the latter's sectoral output, a,, = Xi,,/X,.Stronger linkages between j and other sectors (higher values of aiJ) imply that an exogenous shock affecting F,. will generate larger effects on outputs of sectors indexed over i. A more comprehensive measure of the sectoral interdependence of sector j is given by its total backward linkages (TBLs) that are obtained by finding the sum of the elements in the jth column of (I - A ) - ' . The resulting value shows the change in total intermediate input requirements resulting from a unitary expansion of F, and can be interpreted as the output multiplier for this sector.
4The idea was first introduced by Carter (1965) who took the US I 0 matrix for 1947 and recalculated sectoral outputs assuming a complete lack of I0 linkages between agricultural and non-agricultural sectors. Having observed that the deviations between resulting values of sectoral outputs and their actual levels were negligible, Carter concluded that the results supported the independence of agricultural complex from the rest of the economy. Carter's analysis, however, was partial in the sense that he only considered a lack of input demands by non-agricultural sectors for the outputs of agricultural sectors.
Block interdependence in Turkey
33 1
eA = {(DAA - D ~ ~ D ~ ~ D ~ ~ ) - ~ - D - I A A ) ' F ~ There, however, is no assurance that the GDOs projected by
r r
-
-1 (7) the demand-side model in response to a change in F would beand eA = eA
.
X Amatched by those projected by the supply-side model in where eA is the vector of absolute errors in agro GDOs,
-
E; is response to a change in VA. Counter-factual experiment- 1 .
the vector of relative errors, and X , Is a diagonalized square results for both cases must therefore be considered before
matrix of agro G D O ~ . ~ F~~ D~~ = 0, the Leontief inverse to deciding how strongly the agricultural block is linked to the be used for measurement of errors in the GDOs would be rest of the economy. Given
his analysis measuring the degree of demand-side and S the partitioned version of (I
-;I),
two-way sensitivity interdependence between is partial and must be measures may be obtained as before, under the assumptionsrepeated using the supply-side variant of the traditional I 0 that
sAN
= 0 andsNA
= 0, i.e., changes in primary factor by GhOsh*
and employment by agro sectors (non-agro sectors) have no effectrepresent the n
x
n matrix of coefficients ai,j = Xi,,/Xi, and on non-agro (agro) sectors. the row vector of sectoral value-addeds respectively, thesupply-side equivalent of Equation 1 would be
where prime (I) is the transpose operator. Then, for any given
VA, the solution of the system would be
where ( I -A)-' is the supply-side version of the Leontief inverse. Within this framework, ai,,'s show the supply generation capacity of sector i following an increase in the availability of labour or any other productive factor for its production. By increasing the output of sector i, this will relax the input constraint facing other sectors that use i as an intermediate input.6
The supply-side I 0 models will generate the same solution as in Equation 2 for the base year (Bon and Bing, 1993).
(9) 111. THE RESULTS AND CONCLUSIONS
The results below were obtained from a 32-sector (Appendix), aggregated version of the 64-sector I 0 transaction matrix of Turkey for 1990 published by Turkish State Institute of ~ t a t i s t i c s . ~ The Table 1 shows mean percentages of relative errors in the GDOs and backward/fonvard linkages resulting from counterfactual assumptions considered.
The GDO results indicate that when agro input purchases of non-agricultural sectors are assumed zero, agro (non-agro) sectors face sizable losses in GDOs under the demand-side (supply-side) model. When non-agro input purchases of agricultural sectors are assumed zero, on the other hand, the sectors facing sizable GDO losses under the demand-side (supply-side) model would be non-agro (agro) sectors. The downward bias in agro GDOs under DAN = 0, is very high
Table 1 . Mean percentages of relative errors in total linkages and GDOs
Relative errors in total linkages (mean %) Relative errors in gross domestic outputs (mean %)
Assumption Whole economy Agro sectors Nonagro sectors Whole economy Agro sectors Nonagro sectors
Backward linkages Demand-side model
DAN = 0 3.49 0.73 7.53 14.68 23.57 1.69
DNA = 0 12.33 19.58 1.90 7.38 1.08 16.60
Forward linkages Supply-side model
SNA = 0 5.24 1.04 11.36 16.32 25.82 2.45
SAN = 0 10.66 17.11 1.23 3.53 0.75 7.59
51f a,,'s are assumed to be random and their variances can be estimated, then, the expected value of the Leontief inverse can be obtained and variances of multipliers can be found as in Jansen (1994). This would allow for probabilistic tests on the assumptions of block independence and would be an area for improved results.
6The sum of all coefficients along row i of (I -A)-' represents total forward linkages (TFL) of the sector showing the rise (fall) in total supply in response to a unit increase (decrease) in primary factor use by sector i.
'The I 0 coefficients used here are based on total flows covering both domestically produced and imported products. While there are alternative views concerning this treatment (Miller and Blair, 1985), a test comparing multipliers under total versus domestic flows for 1990 did not yield significant differences.
332
S.
Sayan
and N. Demir
approaching 24%. Under SNA = 0, the bias is 25.82% on the average for agro sectors, clearly illustrating the high level of interdependence of agro sectors as users of inputs supplied by non-agro sectors (e.g., chemicals, petroleum products, ma- chinery). Likewise, the average loss in non-agro GDOs standing at 7.59% under SAN = 0 indicate that agro sectors
are important suppliers of inputs for others as well.
As for the impacts on multipliers, TBLs are found to be pretty sensitive to both assumptions (particularly to DAN = 0
for non-agro, and to DNA = 0 for agro sectors). Relative errors
in multipliers averaging 3.49% (12.33%) for the whole economy under DAN = 0 (DNA = 0) signal a strong inter-
dependence between agro and non-agro blocks. Following a change in FA, total input requirements of agro sectors from others are significantly distorted when relevant linkages are ignored. The supply-side model shows even stronger and more diffused linkages requiring that more attention be given to the supply multiplying ability of the sectors when additional resources are to be allocated. Concerning the overall pattern of errors, DAN = 0 and SNA = 0 yield the same ups and downs
while the magnitudes hint stronger forward linkages than backward linkages for all but especially agro sectors.
In summary, both total linkages and sectoral GDOs are found to be grossly underestimated when agro and non-agro sectors are assumed not linked, implying a considerable reduction in the predictive power of the Leontief inverse. Despite variation in sectoral results not reported here, the sensitivity analyses conducted provide evidence generally supportive of the argument that the agro complex in Turkey can not be taken in isolation from other sectors. This, in turn, implies that the Customs Union with the EU will have considerable impacts not only on non-agricultural sectors but also on Turkish agriculture although agricultural trade is not covered by the Agreement.
REFERENCES
Bon, R. and Bing, X. (1993) Comparative stability analysis of demand-side and supply-side input-output models in the UK,
Applied Economics, 25, 75-79.
Carter, H.O. (1965) Measurement of the Degree of Interdependence between Agricultural Complex and Non-agriculture, Unpub- lished Report, Harvard University, Cambridge.
Chen B. (1996) Picking winners and industrialization in Taiwan, The
Journal of International Trade and Economic Development, 5,
137-59.
Ghosh, A. (1958) Input-output approach to an allocative system,
Economics, 25, 58-64.
Hertel, T.W. (1990) General equilibrium analysis of US agriculture: what does it contribute? Journal of Agricultural Economics
Research, 42, 3-8.
Jansen, P.S.M., Kop (1994) Analysis of multipliers in stochastic input-output models, Regional Science and Urban Economics,
24, 55-74.
Korres, G.M. (1996) Sources of structural change: an input-output , decomposition analysis for Greece, Applied Economics Letters, 3, 707-10.
Leontief, W. (1936) Quantitative input-output relations in the economic system of the United States, Review of Economics
and Statistics, 18, 105-25.
McGregor, P.G., Swales, J.K. and Yin, Y.P. (1995) Input-output analysis, labour scarcity and relative price endogeneity: aggregate demand disturbances in a 'flex-price' Leontief system,
Economic Systems Research, 7 , 189-208.
Miller, R.E and Blair, P.D. (1985) Input-Output Analysis: Founda-
tions and Extensions, Prentice Hall, Englewood Cliffs.
Sayan, S. (1996) Budget deficits and agricultural support spending: general equilibrium effects under alternative support schemes,
Yapi Kredi Economic Review, 7, 2 7 4 6 .
Tangermann, S. (1996) Implementation of the Uruguay Round Agreement on agriculture: issues and prospects, Journal of
Agricultural Economics, 47, 315-37.
APPENDIX: SECTOR COVERAGE OF THE INPUT-OUTPUT MODEL Present study Agro sectors 1 Crops 2 Livestock 3 Forestry 4 Fishery 5 Slaughtering
6 Fruit and vegetable processing 7 Vegetable and livestock oil 8 Cereal processing 9 Sugar
10 Other food processing 11 Alcoholic drinks 12 Non-alcoholic drinks 13 Tobacco processing 14 Ginning
15 Textiles 16 Leather and furs 17 Wood products 18 Furniture 19 Paper products
Non-agro sectors
20 Mining
21 Shoes and apparel 22 Printing etc. 23 Fertilizers 24 Chemicals 25 Petroleum products 26 Rubber and plastics 27 Glass and cement 28 Steel and metal products 29 Machinery and vehicles 30 Construction and other
manufacturing 3 1 Utilities 32 Services
Original SIS table l Crops 2 Livestock 3 Forestry 4 Fishery 11 Slaughtering
12 Fruit and vegetable processing 13 Vegetable and livestock oil 14 Cereal processing
15 Sugar
i
I16 Other food processing 17 Alcoholic drinks 18 Non-alcoholic drinks 19 Tobacco processing 20 Ginning
21 Textiles 23 Leather and furs 25 Wood products 26 Furniture 27 Paper products
5-10 Various mining sectors 22-24 Shoes and apparel 28 Printing etc. 29 Fertilizers
30-31 Medicines and chemicals 32-33 All petroleum products 34-35 Rubber and plastic products 3 6 3 8 Glass and cement 3 9 4 1 Steel and metal products 42-48 All machinery and vehicles 49, 52, 53 Construction and other
manufacturing 5 G 5 1 Electricity, gas and water 54-64 All services