A MULTIPLICATION-FREE FRAMEWORK FOR SIGNAL PROCESSING AND
APPLICATIONS IN BIOMEDICAL IMAGE ANALYSIS
Alexander Suhre
1, Furkan Keskin
1, Tulin Ersahin
2, Rengul Cetin-Atalay
2, Rashid Ansari
3, A. Enis Cetin
1,
1Department of Electrical and Electronics Engineering
2
Department of Molecular Biology and Genetics
Bilkent University, 06800 Bilkent, Ankara, Turkey
3
Department of Electrical and Computer Engineering, University of Illinois
Chicago, IL 60607
ABSTRACT
A new framework for signal processing is introduced based on a novel vector product definition that permits a multiplier-free implementation. First a new product of two real numbers is defined as the sum of their absolute values, with the sign determined by product of the hard-limited numbers. This new product of real numbers is used to define a similar product of vectors in RN. The new vector product of two identical
vectors reduces to a scaled version of the l1norm of the vec-tor. The main advantage of this framework is that it yields multiplication-free computationally efficient algorithms for performing some important tasks in signal processing. An application to the problem of cancer cell line image classi-fication is presented that uses the notion of a co-difference matrix that is analogous to a covariance matrix except that the vector products are based on our new proposed framework. Results show the effectiveness of this approach when the proposed co-difference matrix is compared with a covariance matrix.
Index Terms— Inner-product space, image classification, region covariance, co-difference
1. INTRODUCTION
Implementation of signal processing algorithms usually re-quires a large number of multiplications. It is desirable to avoid heavy multiplication burden in applications where high energy consumption is a concern. Toward this end a new framework for signal processing is proposed by introducing a novel vector product definition that permits a multiplier-free implementation. The new vector product uses an operator that defines the product of two real numbers as the sum of their absolute values, with the same sign as the ordinary multipli-cation of two numbers. multiplimultipli-cation is an energy consuming
This study was carried out as part of the MIRACLE project, which is funded by the European Community as an IRSES Project 247091. The au-thors would like to thank B Carr (University of Pittsburgh, PA, USA) for providing Hep40 and Hep3B-TR cell lines.
operation, especially in ARM-type processors used in tablet computers and mobile devices. therefore, the new operator al-lows users to perform image and signal processing in low-cost processors.
An application of the new vector product is feature extrac-tion from images. Recently, region covariance approaches [1] have become quite popular in the fields of image process-ing and computer vision. Their application includes object recognition, tracking and classification. Despite their superior performance, the computational burden of computing a co-variance matrix for multiple image regions is relatively high. Recently, a computationally more efficient alternative to the covaraince matrix, the so-called co-difference matrix was in-troduced [2] and successfully applied to several apllication areas [3]. In this paper, firstly, we look more deeply into the properties of the co-difference operator. Secondly, we apply the co-difference matrix to a new application area, i.e., the classification of cancer cell line images and compare its per-formance with the established covariance matrix method.
In section 2, the proposed multiplier-less operator is de-fined. In section 3 the application of the proposed multiplier to an image classification problem is explained and compar-isons of the proposed region co-difference matrix with the es-tablished region covariance matrix are shown.
2. VECTOR PRODUCT AND IMAGE FEATURE EXTRACTION ALGORITHM
In this section, we first review the covariance matrix based feature extraction. We then introduce the multiplication-free co-difference matrix approach.
Given an intensity image I of size m× n, we define a mapping ϕ from image domain to feature domain as
F (x, y) = ϕ(I, x, y) (1) where each pixel (x,y) is mapped to a set of features and F is a feature function computed as a m× n × d array. For a given subwindow W consisting of N pixels, let (fk)k=1...nbe the
d-dimensional feature vectors extracted from W . Then, the covariance matrix of region W can be computed as follows
Cv= 1 N− 1 N ∑ k=1 (fk− µ)(fk− µ)T (2)
where µ is the mean of the feature vectors inside the region W . The covariance matrix is symmetric positive-definite and of size d-by-d.The computational complexity of the covariance matrix is relatively large, i.e., O(N). Computa-tional cost becomes especially important when a large image needs to be scanned at different scales. In [2], an efficient multiplier-less implementation of covariance descriptors, called co-difference matrices, was introduced. In the co-difference method, an operator based on additions instead of the multiplications as in the covariance method is used. This methodology gives comparable results in regular texture classification [3]. Let a and b be two real numbers. The new operator is defined as follows:
a⊕ b = sgn(c) · (|a| + |b|), (3) where sgn(c) is the sign of c and
c = {
a· b if a· b ̸= 0
a + b if a· b = 0 (4) The operator is basically a summation operation but the sign of the results behaves like the multiplication operation. As a result, the computational complexity of signal analysis can be decreased significantly. In our experiments, for a given image from our dataset, the computation of the region co-difference matrices for the full feature vector was about 100 times faster when compared to the region covariance matrix.
We define a new ”vector product” of two N-dimensional vectors x1and x2in RNas follows:
< x1, x2>=
N
∑
i=1
x1(i)⊕ x2(i), (5)
where x1(i) and x2(i) are the i-th entries of the vectors x1and x2, respectively. The co-difference matrix can be constructed from the vector product of two vectors. One can also define a ”vector product space” analogous to an inner product space though where our vector product satisfies the requirements of an inner product except the condition of linearity in the first argument. We define the multiplication of a vector by a number a based on (3) and (5) as follows:
a⊕ x = a⊕ x(1) a⊕ x(2) .. . a⊕ x(N) , (6)
where a is an arbitrary real number. Note that the vector prod-uct of a vector x with itself reduces to a scaled scaled l1norm of x as follows: < x, x >= N ∑ i=1 x(i)⊕ x(i) = 2 N ∑ i=1 |x(i)| = 2||x||1, (7) We define the co-difference matrix for the image region R as
Cd= 1 N− 1 N ∑ k=1 (fk− µ) ⊕ (fk− µ)T (8)
which can replace the covariance matrix defined in Eq. (2) in image classification problems.
In practice, fk values can be color pixel values, wavelet
transform coefficients, directional derivatives etc. In the next section, the codifference matrix is used in cancer cell-line im-age classification. A new directional correlation parameter constructed using the new vector product is also used as a feature parameter in covariance (2) and codifference matrices (7).
3. EXPERIMENTAL RESULTS Background:
The use of the proposed framework in a medical imag-ing application is now considered. The new multiplication-free vector product is used in place of the conventional in-ner product and the efficiency of the proposed approach is demonstrated by a microscopic image classification example. Automatic classification of biomedical images is an emerg-ing field, despite the fact that there is a long history of image recognition techniques [4].
In molecular biology studies, experimenters deal with a large number of specimens whose identity have to be checked recurringly during different stages of the experiment. There-fore, predicting labels of cancer cell lines in a fast and accu-rate manner via a pattern classification approach will greatly enhance biologists’ ability to identify different types of cell lines without the need to scrutinize each and every micro-scopic image one by one. Although cell lines are being used widely as in vitro models in cancer research and drug de-velopment, mislabeling cell lines or failure to recognize any contamination may lead to misleading results. Short tandem repeat (STR) analysis is being used as a standard for the au-thentication of human cell lines. However, this process takes a long time and has to be carried out by an expert. Automated analysis, on the other hand, will provide the scientists a fast and easy-to-use tool that they can use in their own laboratories to verify their cell lines.
Modelling of cell morphology has been studied by sev-eral groups, for example for fission yeast in [5] and for e. coli bacteria in [6]. To the best of our knowledge there have been no studies that have used morphology of different human can-cer cell lines for classification. Eventually, discrimination of
14 classes of biomedical images is achieved, which are all images of cancer cell lines. The dataset at hand consists of two major types of cancer cell lines, namely breast cancer and liver cancer (hepatocellular carcinoma) with 7 sub-classes, re-spectively. The dataset consists of 280 images, i.e., 20 per sub-class.
Our approach aims to carry out the automated analysis by extracting a feature vector from the images. These fea-ture parameters reflect the large morphological diversity of the images. The six hepatocellular carcinoma, one hepato-blastoma and seven breast cancer cell lines were obtained from the following sources: FOCUS ( [7]), Hep40 ( [8]), Huh7 (JCRB JCRB0403), Mahlavu ( [9]), PLC (ATCC CRL-8024), SkHep1 (ATCC HTB-52), HepG2 (ATCC HB-8065), BT-20 (ATCC HTB-19), CAMA-1 (ATCC HTB-21), MDA-MB-157 (ATCC HTB-24), MDA-MB-361 (ATCC HTB-27), MDA-MB-453 (ATCC HTB-131), MDA-MB-468 (ATCC HTB-132), T47D (ATCC HTB-133).
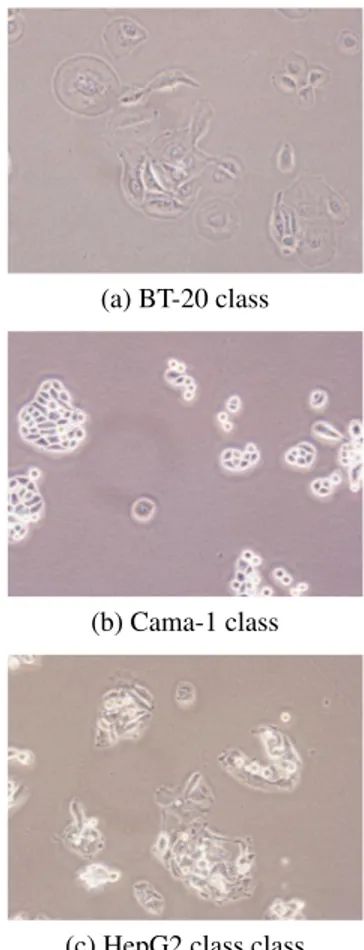
The cell lines were seeded into dishes with 20% con-fluency and grown at 37oC under 5% CO2in standard Dul-becco’s modified Eagle’s medium (DMEM) supplemented with 10% FBS, 1% Non-Essential Aminoacid and 1% peni-cillin/streptomycin (GIBCO Invitrogen) up to 70% conflu-ency. The authentication of the cell lines was regularly checked by STR profiling. Cell line images were obtained us-ing an Olympus CKX41 inverted microscope with an Olym-pus DP72 camera with a 20x objective and recorded using 20x magnification. Some example images of different cancer cell line images can be seen in Figure 1.
3.1. Feature Extraction
Microscopic cancer cell line images contain significant amount of oriented singularities. as a result we used di-rectional feature parameters constructed using the new vector product and the directional dula tree complex wavelet trans-form (DT-CWT) for image representation.
3.1.1. Directional Differences
In order to account for the large morphological variation of the images in our dataset, we evaluated differences between pixels in various directions. Consider two pixels p1and p2on a two-dimensional image I(x, y). Assume that the Euclidean distance between p1 and p2be d and p2lies on a line that has an orientation of angle α with respect to the horizontal coordinate: I(x + d· cos α, y + d · sin α)Let us construct a vector of size i = 1, 2, ..., A as follows:
Iα= [Iα(1), Iα(2), ..., Iα(A)], (9)
where Iα(i) = I(x+i·RAcos(α), y +i· R
Asin(α)), α is a
spec-ified angle and R is a chosen radius. Then we can perform the introduced vector product according to (6) as follows:
sα= I(x, y)⊕ (Iα− µα), (10)
where µ is the mean of the vector.
(a) BT-20 class
(b) Cama-1 class
(c) HepG2 class class
Fig. 1. Examples of the image classes used in our experi-ments.
sαvalues can be used as a directional feature set for
classifi-cation purposes.
3.1.2. Dual-Tree Complex Wavelet Transform
The dual-tree complex wavelet transform (DT-CWT) has been recently used in various signal and image processing applications [10], [11], [12] and [13]. It has desirable prop-erties such as shift invariance, directional selectivity and lack of aliasing. In the dual-treeCWT, two maximally decimated discrete wavelet transforms are executed in parallel, where the wavelet functions of two different trees form an approxi-mate Hilbert transform pair [14]. Two-dimensional DT-CWT is also directionally selective in six different orientations. We use DT-CWT complex coefficient magnitudes in detail sub-bands as pixel features and compute codifference descriptors.
Let WR
θ (x, y) and WθIm(x, y) denote, respectively, the
real and imaginary part of the 2ndlevel complex wavelet coef-ficient at the position (x,y) corresponding to directional detail
subbands at orientation θ, where θ∈ {±15o,±45o,±75o}.
The magnitude of the complex wavelet coefficent is then Mθ,
computed for θ ∈ {±15o,±45o,±75o}. Hence, for each pixel in the average image Ia(x, y), six complex wavelet
coef-ficient magnitudes Mθ(x, y) representing six different
orien-tations of DT-CWT are extracted. These magnitudes will be utilized as features in the co-difference and covariance ma-trix computation for randomly sampled regions of the image Ia(x, y).
3.1.3. Feature vector choice With
Mθ(x, y) = [Mθ1(x, y)...Mθ6(x, y)] (11)
and
sα(x, y) = [sα1(x, y) ... sα8(x, y)] (12)
where θ1...θ6correspond to the six orientations of DT-CWT detail subbands{±15o,±45o,±75o}.α1...α8correspond to the mean of the eight angles of directional difference score estimation. The feature mapping function employed in this study is then
ϕ(I, x, y) = [Ia(x, y)|Ix| |Iy| |Ixx| |Iyy| Mθ(x, y) sα(x, y)]T,
(13) where|Ix| and |Ixx| denote the first- and second-order
deriva-tives at (x, y) of the image Ia.
In this study, the performance of covariance and co-difference matrices is compared to their normalised counter-parts given by ˆ C(i, j) = { √ C(i, j), if i = j C(i,j) √ C(i,i)C(j,j), otherwise (14) as in [15]. 3.1.4. Foreground-Background Segmentation
The images in our dataset show a large amount of background pixels. Clearly, the background is not discriminative. There-fore, we address the issue of segmenting the images into fore-ground and backfore-ground before classification. For our dataset, a simple thresholding scheme is not sufficient for segmenta-tion, since foreground pixels have a large variance and may therefore have values higher and lower than the background pixels. We modeled the image as a mixture of two Gaussians, representing the foreground and background pixels, respec-tively. Using this model, an Expectation-Maximization (EM) algorithm was applied for segmentation. The result is noisy, so a morphological closing operation was applied, followed by median filtering.
Since it is necessary to focus on foreground-like regions in carcinoma cell line images, s analysis square windows are randomly selected, as in [18], from each image with the two constraints: the percentage of the foreground pixels in the
selected region of an image must be above 50 and the vari-ance of the selected region must exceed an image-dependent threshold, which is the variance of the whole image.
3.1.5. Classification
For each subwindow, a codifference matrix was computed using (2) and the feature vector from (13). The image signature is composed of s co-difference matrices of the same size. Each class is represented by s×#(images in each class) covariance matrices. A multiclass support vector ma-chine (SVM) classifier is trained with an RBF kernel in the d(d+1)/2-dimensional vector space using the training points. SVM algorithm is implemented using LIBSVM library [19]. For each test subwindow, the corresonding co-difference de-scriptor is vectorized and fed into the trained SVM model for prediction. Therefore, there exist s labels for each mi-croscopic image corresponding to s subwindows, and the image in question is assigned the label that gets the majority of votes among s labels. The above process is carried out for unnormalised and normalised co-difference matrices.
3.1.6. Results
In our experiments, we compared the co-difference matrix with the covariance matrix. When both are fed into an SVM, we get the results listed in Table 1. Clearly, the results are comparable, with the co-difference matrix outperfroming the covariance matrix in the normalised case.
Unnormalised Normalised Unnormalised Normalised Covariance Covariance Codifference Codifference classification classification classification classification
97.1 97.5 96.4 97.9
Table 1. Classification accuracies (in %) for different classi-fier inputs.
4. CONCLUSIONS
In this paper, a new framework for signal processing based on a novel vector product definition that permits a multiplier-free implementation was introduced. The main advantage of this framework is that it yields multiplication-free computa-tionally efficient algorithms for performing some important tasks in signal processing. This operator can be used to con-struct a so-called region co-difference matrix that has very similar properties to the established region covariance ma-trix. The co-difference matrix was successfully applied to the problem of classifiying cancer cell line images. The co-difference matrix-based approach produces slightly better re-sults than the covariance matrix without performing any mul-tiplications.
5. REFERENCES
[1] Oncel Tuzel, Fatih Porikli, and Peter Meer, “Region co-variance: A fast descriptor for detection and classifica-tion,” in Computer Vision ECCV 2006, Alex Leonardis, Horst Bischof, and Axel Pinz, Eds., vol. 3952 of Lec-ture Notes in Computer Science, pp. 589–600. Springer Berlin / Heidelberg, 2006.
[2] H. Tuna, I. Onaran, and A.E. Cetin, “Image descrip-tion using a multiplier-less operator,” Signal Processing Letters, IEEE, vol. 16, no. 9, pp. 751 –753, sept. 2009. [3] A. E. Cetin and K. Duman, “Target detection in sar
images using codifference and directional filters,” Apr. 2010, vol. 7699.
[4] M.M. Dundar, S. Badve, V.C. Raykar, R.K. Jain, O. Ser-tel, and M.N. Gurcan, “A multiple instance learn-ing approach toward optimal classification of pathology slides,” in Pattern Recognition (ICPR), 2010 20th Inter-national Conference on, August 2010, pp. 2732 –2735. [5] Marco Vilela, Jeffrey J. Morgan, and Paul A. Lindahl,
“Mathematical model of a cell size checkpoint,” PLoS Comput Biol, vol. 6, no. 12, pp. e1001036, 12 2010. [6] Ralf Steuer, Steffen Waldherr, Victor Sourjik, and
Markus Kollmann, “Robust signal processing in living cells,” PLoS Comput Biol, vol. 7, no. 11, pp. e1002218, 11 2011.
[7] L. He, K. J. Isselbacker, J. R. Wands, H.M. Goodman, C. Shih, and A. Quaroni, “Establishment and charac-terization of a new human hepatocellular carcinoma cell line.,” J. Cell Physiol., vol. 165, no. 3, pp. 459–467, 1985.
[8] B Bouzahzah, Y. Nishikawa, D. Simon, and B.I. Carr, “Growth control and gene expression in a new hepato-cellular carcinoma cell line, hep40: inhibitory actions of vitamin k.,” In Vitro, vol. 20, no. 6, pp. 493–504, 1984. [9] P.E. Oefinger, D.L. Bronson, and G.R. Dreesman,
“Induction of hepatitis b surface antigen in human hepatoma-derived cell lines.,” J Gen Virol, vol. 53, no. 1, 1981.
[10] Ivan W. Selesnick and Ke Yong Li, “Video denoising using 2d and 3d dual-tree complex wavelet transforms,” in Wavelet Appl Signal Image Proc. X (Proc. SPIE 5207, 2003, pp. 607–618.
[11] P. Loo and N. Kingsbury, “Digital watermarking us-ing complex wavelets,” in Image Processing, 2000. Proceedings. 2000 International Conference on, 2000, vol. 3, pp. 29 –32 vol.3.
[12] G.Y. Chen, T.D. Bui, and A. Krzyzak, “Palmprint clas-sification using dual-tree complex wavelets,” in Image Processing, 2006 IEEE International Conference on, Oct 2006, pp. 2645 –2648.
[13] M. Thamarai and R. Shanmugalakshmi, “Video cod-ing technique uscod-ing swarm intelligence in 3-d dual tree complex wavelet transform,” in Machine Learning and Computing (ICMLC), 2010 Second International Con-ference on, Feb 2010, pp. 174 –178.
[14] I.W. Selesnick, R.G. Baraniuk, and N.C. Kingsbury, “The dual-tree complex wavelet transform,” Signal Pro-cessing Magazine, IEEE, vol. 22, no. 6, pp. 123 – 151, Nov. 2005.
[15] Y. H. Habiboglu, O. Gunay, and A. E. Cetin, “Real-time wildfire detection using correlation descriptors,” in 19th European Signal Processing Conference (EU-SIPCO 2011), Special Session on Signal Processing for Disaster Management and Prevention, 2011, pp. 894– 898.
[16] Ahmed M. Nazif and Martin D. Levine, “Low level im-age segmentation: An expert system,” Pattern Analysis and Machine Intelligence, IEEE Transactions on, vol. PAMI-6, no. 5, pp. 555 –577, sept. 1984.
[17] S. Chabrier, B. Emile, C. Rosenberger, and H. Lau-rent, “Unsupervised performance evaluation of image segmentation,” EURASIP J. Appl. Signal Process., vol. 2006, pp. 217–217, January 2006.
[18] R. Maree, P. Geurts, J. Piater, and L. Wehenkel, “Ran-dom subwindows for robust image classification,” in Computer Vision and Pattern Recognition, 2005. CVPR 2005. IEEE Computer Society Conference on, June 2005, vol. 1, pp. 34 – 40 vol. 1.
[19] Chih-Chung Chang and Chih-Jen Lin, LIBSVM: a li-brary for support vector machines, 2001, Software available at http://www.csie.ntu.edu.tw/ cjlin/libsvm.