register. A d.c. biased input signal (VIN) is applied to the input
gates (IG1+ and IG2") while the other input gates (IG2+ and IG1~) are held at higher and lower voltages (VH and VL),
re-spectively. As a result, complementary potential wells of (VH — V,N) and (VIN — VL) are formed at each floating diffusion.
The sizes of the diffusions are chosen so that their difference is proportional to the filter coefficient.
Signal charges sampled and retained in the potential wells using the potential equilibration method can be written as follows:
c?(v
H-v
IN)
cj(vIN-vL)
(2) (3)
These charges are put in the register and are summed as shown by arrows. The sum is proportional to the product of the input signal and net weighting coefficient (Cj = C / — CJ).
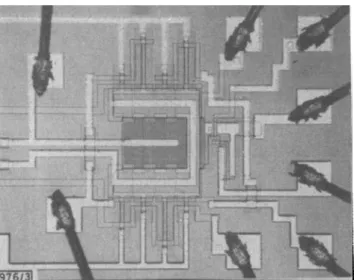
Fig. 3 Photomicrograph of the m.c.cd. bandpass filter
Fig. 3 shows a photomicrograph of the fabricated 2nd-order m.c.cd. recursive filter, which realises a complex conjugate pair of poles and one zero and functions as a narrow bandpass filter. The net weighted signal charges from each input stage are delayed and progressively summed in the register, and are detected by a precharged diode and a one-stage source fol-lower at the output. The output signal is then sampled and changed into signal charges again at the feedback input stages to complete the feedback loop.
Device performance: The frequency response of the device operated at 4 kHz is shown in Fig. 4, where the centre frequency of 699 Hz and Q of 39 are obtained. The maximum input voltage is 0 1 Vrms and the overall input/output gain at the
resonant frequency is 28 dB. These are in good agreement with the theoretical values.
In this experiment, the output signal was fed back through a noninverting amplifier and coupling capacitor, because the on-chip source follower had not sufficient gain to achieve unit open-loop gain.
Conclusion: A new c.c.d. recursive filter has been demonstrated using the input-weighted m.c.cd. technique. This 2nd-order
30 20 m •o 10 2 0 -10
structure can be easily expanded to a filter of higher order by adding some input stages. This approach promises the realisa-tion of the fully integrated recursive filter on a very small sili-con area.
Y. MIYAMOTO 27th March 1979 K. TANIKAWA
H. SEI S. KATO*
Fujitsu Laboratories Ltd. & Fujitsu Ltd.* Hyogo-ku, Kobe, Japan 652
References
1 TAO, T. F., IAMSAAD, V., HOLMES, S., FREUND, B., SEATRE, L., a n d
ZIMMERMAN, T. A.: 'Sampled analog c.c.d. recursive comb filters'. Proceedings of the 1975 international conference on the applica-tion of charge-coupled devices, 1975, San Diego, pp. 257-266
2 YEOW, Y. T., and MAVOR, J.: influence of charge-transfer inefficiency
on cc.d. recursive-filter performance', Electron. Lett., 1976, 12, pp. 125-127
3 STEENAART, w., and FERGUSON, T.: 'Design of c.cd. recursive filters'.
Proceedings of the 1978 European conference on circuit theory and design, 1978, Switzerland, pp. 175-180
4 OHTSUKI, O., SEI, H., TANIKAWA, K., a n d MIYAMOTO, Y.: 'C.C.D. with
meander channel'. Proceedings of the 1976 international confer-ence on technology and application of charge-coupled device, 1976, Edinburgh, pp. 38-42
5 MIYAMOTO, Y., TANIKAWA, K., and SEI, H . : 'Meander channel c.c.d.
transversal filter', Electron. Lett., 1978, 14, pp. 538-539
6 KNAUER, K., PFLEIDERER, H. J., and KELLER, H.: ' C C D transversal
filters with parallel-in/serial-out configuration', Siemens
Forsch-Entwicklungsber. 7, 1978, 3, pp. 138-142
0013-5194/79/110320-02$! .50/0
MODULATION TRANSFER FUNCTION FOR THE ACOUSTIC MICROSCOPE
Indexing terms: Acoustic microscopes, Optical transfer function
A simple method to measure the modulation transfer function of an acoustic microscope is described. Theoretical results are compared with experimental measurements. An explanation of 'shadowing' found in acoustic images is given.
The scanning acoustic microscope used mainly in reflection mode finds applications in material science1 and biology with its improving resolution.2 Characterisation of the imaging per-formance is important in understanding the behaviour of the system.3 In this letter, a simple approximate method is described to measure the 'modulation transfer function' (m.t.f.) of the acoustic microscope. Experimental results are compared with calculated curves.
As depicted in Fig. 1, the imaging system consists of a piezoelectric transducer at plane 0, an acoustic lens with focal
0 3
frequency, kHz
Fig. 4 Frequency response of the m.c.cd. recursive filter
'.reflector
Fig. 1 Geometry and co-ordinate system used in analysis
planes 1 and 2 and the reflector object at plane 3. The acoustic lens serves to focus the waves incident on plane 1 to plane 2. Using the similarity with an optical system, a modulation transfer function can be defined. For this purpose one has to borrow from optics the assumption that the object acts like a 'multiplicative' factor.4 That is to say u~(x, y) = u + (x, y)t(x, y)
where u+ is the incident field, t is the multiplicative object function and u" is the reflected field. The validity of this assumption is questionable, because the angular spectrum of the field incident on the object is very broad ( + 50°) as opposed td the narrow spectrum that is encountered in an optical system. This assumption neglects the fact that each plane-wave component of the angular spectrum is treated dif-ferently by the reflection process. Nevertheless, it simplifies the theory to a level at which the transfer function can be written as the convolution of the 'generalised pupil function' with itself.5 Therefore we write
ao
Jf ( / „ / , ) = K JJ G(x, y)G(fxX0F - x,fyX0F - y) dx dy (1)
where fx and fy are spatial frequencies, K is a normalisation constant, F is the focal length of the lens, Ao is the wavelength
in the liquid and G is the generalised pupil function. The trans-fer function is directly related to the resolution of the system and it takes the form of a 'Chinese hat function' if G is a simple circular pupil.4 G should include factors such as the
illumina-tion of the lens at plane 1 (u^), transmission funcillumina-tion at the lens surface and the pupil function. Hence we write
G{x,y) = ut{x,y)P(x,y).
Note that the transfer function above is similar but not iden-tical to that of an incoherent opiden-tical system. It does not neces-sarily have its maximum at fx=fy = 0, since G may not be circularly symmetric.
Now assume that there is a perfect reflector at plane 3. In this situation the reflected field at plane 1 can be written as6
«f(x, y) « ut(-x, -y)P(-x, -y)P(x, y) x exp [-jZko(x2 + y2)/F2]
where the superscripts + and — refer to the fields propagating in + z and — z directions, respectively. Now let us tilt the reflector an angle 9 with respect to plane 3. Using the paraxial approximation one finds that the reflected field at plane 1 is shifted laterally from its original position by F sin 20 « 29F:
uf(x, y) « ut(26F - x, -y)P{29F - x, -y)P(x, y) x exp {-jZko[{0F - x)2 + y2]/F2} Since the output of the transducer can be expressed as6
V= j | ut(x,y)uT(x,y)dxdy
we find
V(Z, 9) « ^ ut(x, y)ut(20F - x, -y)P(20F - x, -y)
x P(x, y) exp {-jZko[(0F - x2) + y2]/F2} dx dy
(2) Comparing eqns. I and 2, one concludes that
Therefore the m.t.f. can be found by measuring the output amplitude as a function of the tilt angle. A tilt angle of 9 corresponds to a spatial frequency of 29/X0. It is obvious that by tilting the reflector in the ^-direction as well one can gener-ate the whole two-dimensional function. This tedious exper-imental procedure can be simplified if one uses a spherical
322
reflector,7 since a sphere has a reflecting surface at all angles. The radius of the sphere must, of course, be much greater than the size of the focused beam.
A y.i.g. sphere of diameter 380 fim is used as a reflector to measure the m.t.f. of a lens with parameters Rt = 34, R = 29,
R, = 102, d = 200 and F = 39, all in micrometres. First the
y.i.g. ball is moved in the x- and ^-directions (no z-movement) until the time delay of the return pulse is minimised. This aligns the centre of the ball with the lens axis. Then the ball is stopped in the x- and y-directions while the z position is ad-justed each time for maximum return pulse amplitude. This amplitude is then recorded to generate the function
\jf(fx,fy)\- In Fig- 2 the measured points are shown for a cross-section of the function. We observe that m.t.f. is not sym-metrical about the origin, which suggests that the illumination of the lens (uf) is not centred correctly. This may arise from the misalignment of the transducer and lens axes (labelled Xo in Fig. 1) during fabrication.
1046/31
Fig. 2 Measured (dots) and calculated (solid line) m.t.f. for an acoustic
microscope system
Eqn. 2 can be generalised by including a reflectance function
0t as follows:
00
V(Z, 9, <j>) « [f uf(x, y)P(x, y)ut(29F - x, 20F - y) - 00
x P(20F - x, 2(f>F - y)0t(xjF - 9, y/F - <\>) x exp {-jZko[(x - 9F)2 + (y- <t>F)2]/F2} dx dy
(3) where (f> is the tilt of the reflector in the y-direction.
In Fig. 2 we also show m.t.f. calculated by eqn. 3, where an offset Xo of 25 j«n is assumed. The reflectance function & has a negligible effect for Z « 0, therefore 3V(fx,fy) « V(0,fxX0/2, /yA0/2) is a good approximation.
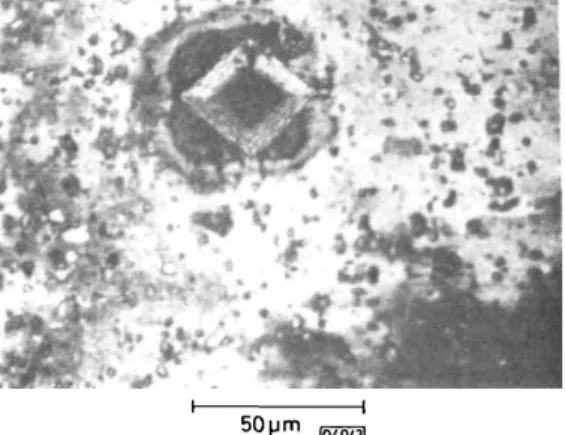
An acoustic image of an aluminium surface recorded at 1500 MHz with the same lens is presented in Fig. 3. The diamond mark is an 'inverted pyramid indent' on the surface and the upper two faces are brighter than the two lower ones, display-ing the unsymmetrical nature of the m.t.f. The same argument can be used to explain the 'shadowing'8 found in many acoustic images.
50pm
Fig. 3 Acoustic image of an aluminium surface with a resolution about
0-8 urn (XQ = 1 fim)
In conclusion, we have described a simple method to charac-terise an acoustic lens. By measuring m.t.f. one can deduce the resolution of the imaging system. This measurement also gives a direct feedback for the fabrication about the illumination of the lens and the alignment of the transducer.
The author wishes to thank V. Jipson for suggesting the spherical reflector and Professor C. F. Quate for valuable sugg-estions. This research was supported by the Air Force Office of Scientific Research.
ABDULLAH ATALAR 23rd April 1979
Edward L. Ginzton Laboratory Stanford University
Stanford, California 94305, USA
References
1 ATALAR, A., JIPSON, v., KOCH, R., and QUATE, c. F.: 'Acoustic
micro-scopy with microwave frequencies', Ann. Rev. Mater. Sci., 1979, 9, pp. 255-281
2 JIPSON, v., and QUATE, C. F. : 'Acoustic microscopy at optical wave-lengths', Appl. Phys. Lett., 1978, 32, pp. 789-791
3 WICKRAMASINGHE, H. K.: 'Contrast and imaging performance in the scanning acoustic microscope', J. Appl. Phys., 1979,50, pp. 664-672 4 GOODMAN, j . w.: 'Introduction to Fourier optics' (McGraw-Hill,
New York, 1968), chaps. 4-6, pp. 57-140
5 LEMONS, R. A.: 'Acoustic microscopy by mechanical scanning'. Ph.D. Thesis, Stanford University, 1975
6 ATALAR, A.: 'An angular spectrum approach to contrast in reflection acoustic microscopy', J. Appl. Phys., 1978, 49, pp. 5130-5139
7 JIPSON, v.: Private communication
8 LEMONS, R. A., and QUATE, c. F. : 'Integrated circuits as viewed with an acoustic microscope', Appl. Phys. Lett., 1974, 25, pp. 251-253
0013-5194/79/110321 -03$ 1.50/0
CHARGE STORAGE IN S.A.W. MEMORY CORRELATORS
Indexing terms: Acoustic-surface-wave devices, Correlators, Dynamics of semiconductor diodes
A general formula, that takes into account the recombination of the minority carriers in the neutral region, is given for the stored charge in a p+-n s.a.w. memory correlator operated in
• the parametric mode.
A surface-wave diode storage correlator is a three-port device capable of correlating a broad-band modulated carrier signal
S(t) which is written or stored into the device with another
signal R(t) having the same carrier frequency. Because of its potential importance in signal-processing systems, some attempts have been made to obtain an understanding of the basic operation of this device.1"4
The purpose of this letter is to summarise the analytical results we have obtained for the so-called 'parametric mode' of correlation with such a device with the full details of the analysis to be reported elsewhere. A qualitative description of the device operation is presented first, followed by a summary of the key steps of the analysis and a general formula for the stored charge in the diodes is given. Finally, our results are compared with the theoretical results published by Borden.3
Mr
S(t). -/W\r W(t) 4 top J electrode R(t) t-s.a.w. transducer-f LiNbO3delay linediode array" top T electrode I " corr(S.R) t-s.a.w. transducer-*
LiNbO3delay line
[8357T|
Fig. 1 Parametric mode for acoustic-surface-wave correlator
a Write-in process b Read-out process
The device, which is shown in Fig. 1, consists of a piezoelec-tric substrate (usually LiNbO3) with two transducers,
deposited at the far ends, which are used to launch acoustic surface waves. A silicon diode array is mounted adjacent to the delay line with a metal plate connected to the back of the diode array. The recording and storage of the signal S(t) is called the writing process. In this letter a particular mode, called the 'parametric mode',1 is considered, where an r.f. potential
W(t) is applied to the plate to interact with the potential
produced by the acoustic surface wave S(t) launched by one of the transducers and travelling beneath a diffused p+-n diode
array. Owing to the diode nonlinear characteristic, a stationary wave with spatial period corresponding to the acoustic surface wave is created, thus charging the diodes. The read-out is the process that results in an output at one of the transducers being the correlation of the stored charge pattern and another r.f. potential R(t) applied to the plate.
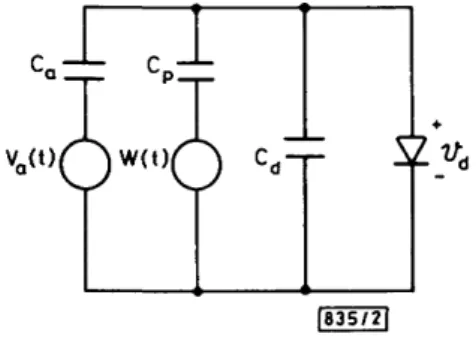
The analysis presented is based on the model proposed by Ingebrigtsen2 and Borden3 with a per-unit-area equivalent cir-cuit shown in Fig. 2. The r.f. signal to be stored, S(t), excites a
Fig. 2 Equivalent network model
surface wave potential Va = Va0 sin (cot — kz), which is coupled to the diode at location z through Ca, and the coupling of the writing signal W(t) = Vp0 sin cot to the diode is through Cp, with Va0, Ca and Cp as defined in Reference 3. The diffused p+-n diode used in conjunction with this parametric mode is repre-sented by a constant depletion-layer capacitor at zero bias Cd0
and a current generator accounting for the diode conduction current. By solving the p+-n diffusion equation together with
the circuit equations of Fig. 2, the stored charge in the diode can be solved for and written as:
Qs(t) = (KTCTlq) In [10 + Af(t)] where C — C -U C -u C
fqc
pv
po 1 r ^ COS kz (1) A = q 2Pno kTCT — exp n \ kTCT f(t) = erfc exp (-t/xp)pn0 is the thermal-equilibrium minority-carrier concentration, p are the minority carrier diffusion constant and
Dp and x fp
lifetime, respectively, and Jo is the modified Bessel function of
order zero.
Eqn. 1 is a general formula describing the relation between the stored charge in the diode and the charging time for a given acoustic signal Va0 and writing signal amplitude Vp0; although it tends to confirm the logarithmic charging behaviour with respect to time that has been observed by many authors,14 the argument of this functional dependence is different from that previously reported, and clearly shows the dependence on the minority-carrier lifetime rp.
Eqn. 1 can be greatly simplified for the following cases:
Case 1: For charging times much shorter than the
minority-carrier lifetime (ts < xp), eqn. 1 becomes
(2)
(3) in contrast to Borden's4 result, which is