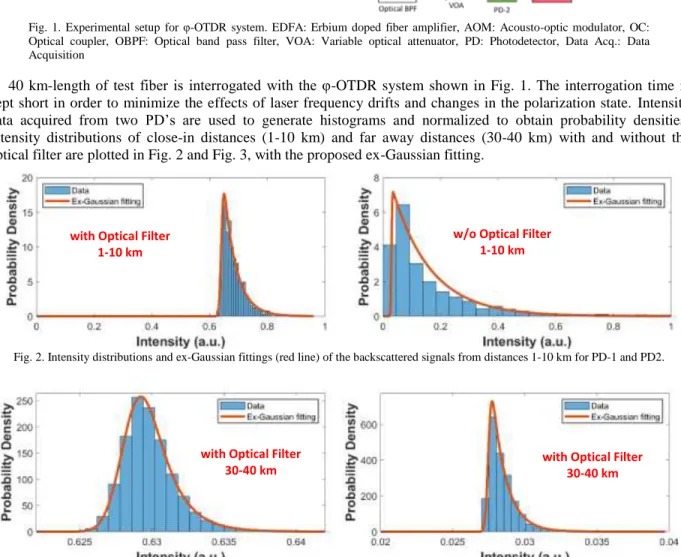
P3_25.pdf CLEO Pacific Rim 2020 © IEEE 2020
The Investigation of Rayleigh Backscattered Signal Statistics
in a φ-OTDR System Incorporating Optical Pre-Amplifier
Faruk Uyar1, Tolga Kartaloglu1, Ekmel Ozbay1, 2, 3 and Ibrahim Ozdur1, 4
1Nanotechnology Research Center, Bilkent University, Ankara, Turkey 2Department of Electrical and Electronics Engineering, Bilkent University, Ankara, Turkey
3
Department of Physics, Bilkent University, Ankara, Turkey
4Department of Electrical and Electronics Engineering, Abdullah Gul University, Kayseri, Turkey
Abstract: We theoretically model and experimentally demonstrate the photon statistics of
Rayleigh backscattered signal in a ϕ-OTDR based distributed fiber optical sensor in the presence of amplified spontaneous emission noise caused by optical pre-amplifier. © 2020 The Author(s)
1. Introduction
Phase-sensitive optical time domain reflectometry (φ-OTDR) based distributed fiber sensors have applications in many areas such as structural health monitoring, perimeter security, oil and gas monitoring and so on [1]. These systems measure the spatial acoustic signal distribution along a fiber optic cable by using a highly coherent (narrow linewidth) light source for interrogation pulses. Since the interrogation pulses are highly coherent, the return signal at the input end of the fiber exhibits a speckle-like appearance which has negative exponential distribution properties [2, 3]. When other factors such as the coherent noise components are included to the speckle field, the distribution departs from negative exponential distribution [3]. One such factor is the amplified spontaneous emission (ASE) noise caused by the optical amplifier placed before the photodetector. It is a common practice to use optical pre-amplifiers before the photodetector in direct-detection φ-OTDR systems to increase the low power signal hence the signal to noise ratio.
This work demonstrates that the characteristics of the backscattered intensity distribution is well represented by ex-Gaussian probability density function (pdf) in the presence of ASE noise from the optical preamplifier.
2. Theory
In optical systems, the distribution of the ASE noise is approximated by Gaussian distribution for statistical calculations [4-6]. Therefore, two dominant forms of the ASE noise (ASE-ASE and ASE-Signal beat noise) can be treated as independent Gaussian stochastic processes and the statistical properties of the overall ASE noise can be described by the total variance given by [4].
In order to obtain the pdf of the return light intensity, the negative exponential pdf of the Rayleigh backscattered signal is convolved with the Gaussian pdf of the ASE noise, which yields ex-Gaussian pdf with the following parameters:
(1)
where is the error function and the parameters and correspond to the mean and standard deviation of the Gaussian component. The parameters and the distribution patterns depend on the ratio between the signal intensity and ASE noise.
3. Experimental Set-up and Results
The experimental set-up used for the φ-OTDR based system is shown in Fig. 1. A highly coherent narrow linewidth (< 1 kHz) continuous-wave (CW) laser is used as the light source. An acousto-optic modulator (AOM), which is placed after a booster erbium doped fiber amplifier (EDFA), generates the interrogation pulses with a repetition rate of 2.5 kHz, 100 ns width and 300 mW peak power. The pulses are then sent to a 40 km-long single-mode fiber (SMF) optic cable via a circulator, through which the backscattered signal from the fiber is directed to a second EDFA with high gain and then split into two receiver paths. One of the receiver paths does not include any optical filter to filter out the ASE noise and all the signal is sent to the photodetector (PD-1) directly. The other path includes a narrowband optical BPF (3 GHz bandwidth) and the filtered optical signal is sent to PD-2. The detected signals by two PD’s are simultaneously acquired by a data acquisition system and then post-processed in a PC to
P3_25.pdf CLEO Pacific Rim 2020 © IEEE 2020
analyze their statistical characteristics. VOA’s in the paths are utilized for adjusting the power level to fit into the photodetector circuits.
Fig. 1. Experimental setup for φ-OTDR system. EDFA: Erbium doped fiber amplifier, AOM: Acousto-optic modulator, OC: Optical coupler, OBPF: Optical band pass filter, VOA: Variable optical attenuator, PD: Photodetector, Data Acq.: Data Acquisition
40 km-length of test fiber is interrogated with the φ-OTDR system shown in Fig. 1. The interrogation time is kept short in order to minimize the effects of laser frequency drifts and changes in the polarization state. Intensity data acquired from two PD’s are used to generate histograms and normalized to obtain probability densities. Intensity distributions of close-in distances (1-10 km) and far away distances (30-40 km) with and without the optical filter are plotted in Fig. 2 and Fig. 3, with the proposed ex-Gaussian fitting.
Fig. 2. Intensity distributions and ex-Gaussian fittings (red line) of the backscattered signals from distances 1-10 km for PD-1 and PD2.
Fig. 3. Intensity distributions and ex-Gaussian fittings (red line) of the backscattered signals from distances 30-40 km for PD-1 and PD2.
The results show that the distributions can be characterized well by ex-Gaussian pdfs. The parameters of the pdf depend on the position along the fiber and the amount of ASE noise (or filter bandwidth). The distribution may have a Gaussian or exponential decay like shape depending on the ratio between the signal intensity and ASE noise.
4. Conclusion
The statistics of the Rayleigh backscattered signal in the presence of ASE noise is theoretically modelled and compared with the experimental results for 1-10 km and 30-40 km distances. The results show that there is a good agreement between theory and experiment. Ex-Gaussian pdf is shown to be useful and effective in order to characterize the return signal distributions for φ-OTDR systems.
6. References
[1] X. Liu, B. Jin, Q. Bai, Y. Wang, D. Wang, Y. Wang, “Distributed Fiber-Optic Sensors for Vibration Detection,” Sensors 16(12), 1164 (2016). [2] P. Healey, “Statistics of Rayleigh Backscatter from a Single-Mode Fiber,” IEEE Trans. on Communications, Vol. 35, No. 2, 210–214 (1987). [3] G. R. Osche, Optical detection theory: for laser applications (Wiley, New York, 2002), Chap. 4.
with Optical Filter 1-10 km
w/o Optical Filter 1-10 km
with Optical Filter
P3_25.pdf CLEO Pacific Rim 2020 © IEEE 2020
[4] R. Steele, G. Walker, and N. Walker, “Sensitivity of optically preamplified receivers with optical filtering,” IEEE Photonics Technology Letters, Vol. 3, No. 6, 545–547 (1991).
[5] G. P. Agrawal, “Optical Amplifier Noise” in Lightwave technology: telecommunication systems, (Wiley-Interscience, Hoboken, NJ. 2005). [6] J. Rebola and A. Cartaxo, “Gaussian approach for performance evaluation of optically preamplified receivers with arbitrary optical and electrical filters,” in IEE Proceedings - Optoelectronics, Vol. 148, No. 3, pp. 135–142.