Article
A Translational Repression Complex in Developing
Mammalian Neural Stem Cells that Regulates
Neuronal Specification
Highlights
d
Radial precursors are transcriptionally primed to make
diverse neuronal subtypes
d
The 4E-T repressor forms a complex with Pum2 during
neurogenesis
d
Neuronal specification mRNAs are translationally repressed
in radial precursors
d
Disruption of the Pum2/4E-T complex causes
misspecification of cortical neurons
Authors
Siraj K. Zahr, Guang Yang,
Hilal Kazan, ..., Anastassia Voronova,
David R. Kaplan, Freda D. Miller
Correspondence
[email protected]
In Brief
Zahr et al. show that cortical RPs are
transcriptionally primed to generate
diverse neuronal subtypes and that
translational repression mechanisms
determine which transcription factor
mRNAs are translated to ensure
appropriate temporal specification of
daughter neurons.
Zahr et al., 2018, Neuron 97, 520–537 February 7, 2018ª 2018 Elsevier Inc. https://doi.org/10.1016/j.neuron.2017.12.045
Neuron
Article
A Translational Repression Complex
in Developing Mammalian Neural Stem Cells
that Regulates Neuronal Specification
Siraj K. Zahr,1,3Guang Yang,1,6Hilal Kazan,2Michael J. Borrett,1,3Scott A. Yuzwa,1Anastassia Voronova,1,7
David R. Kaplan,1,3,4and Freda D. Miller1,3,4,5,8,*
1Program in Neurosciences and Mental Health, Hospital for Sick Children, Toronto, ON M5G 1L7, Canada
2Department of Computer Engineering, Antalya Bilim University, Antalya, Turkey
3Institute of Medical Science
4Department of Molecular Genetics
5Department of Physiology
University of Toronto, Toronto, ON M5G 1A8, Canada
6Present address: HS2229, 3330 Hospital Drive N.W., University of Calgary, Calgary, AB T2N 1N4, Canada
7Present address: 8-32 Medical Sciences Building, University of Alberta, Edmonton, AB T6G 2H7, Canada
8Lead Contact
*Correspondence:[email protected]
https://doi.org/10.1016/j.neuron.2017.12.045
SUMMARY
The mechanisms instructing genesis of neuronal
sub-types from mammalian neural precursors are not well
understood. To address this issue, we have
character-ized the transcriptional landscape of radial glial
pre-cursors (RPs) in the embryonic murine cortex. We
show that individual RPs express mRNA, but not
pro-tein, for transcriptional specifiers of both deep and
su-perficial layer cortical neurons. Some of these mRNAs,
including the superficial versus deep layer neuron
transcriptional regulators Brn1 and Tle4, are
transla-tionally repressed by their association with the
RNA-binding protein Pumilio2 (Pum2) and the 4E-T protein.
Disruption of these repressive complexes in RPs
mid-neurogenesis by knocking down 4E-T or Pum2
causes aberrant co-expression of deep layer neuron
specification proteins in newborn superficial layer
neurons. Thus, cortical RPs are transcriptionally
primed to generate diverse types of neurons, and a
Pum2/4E-T complex represses translation of some
of these neuronal identity mRNAs to ensure
appro-priate temporal specification of daughter neurons.
INTRODUCTION
Appropriate circuit assembly in the mammalian cerebral cortex re-quires the genesis of diverse excitatory neurons that differ in their morphology, connectivity, and function. These different neurons are all made by radial glial precursors (RPs) that generate neurons either directly or indirectly via transit-amplifying intermediate pro-genitor (IP) cells. The newborn neurons then migrate basally to form the nascent cortical layers, with the earliest-born neurons populating the deepest layers and later-born neurons progres-sively populating more superficial layers. Subsequent to this
neurogenic period, which occurs from embryonic day 11 (E11) to E17 in the mouse, the same pool of RPs generates glial cells.
What determines this timed neuronal genesis, particularly in light of recent work showing that individual cortical RPs are mul-tipotent and sequentially generate diverse cortical neurons (Guo et al., 2013; Gao et al., 2014; Eckler et al., 2015; Shen et al., 2006)? One attractive molecular explanation posits transcrip-tional induction of regulatory proteins that specify neuron sub-types as neurons are generated (Greig et al., 2013; Kwan et al., 2012). However, this model is complicated by the finding that RPs themselves express some neuronal specifiers at the mRNA, but not, protein level (Arlotta et al., 2005; Guo et al., 2013; Eckler et al., 2015), indicating that post-transcriptional regulation might also be important. In this regard, we recently identified a translational repression complex involving the 4E-T protein and showed that it determines the timing and extent of cortical neurogenesis by regulating the translation of proneuro-genic bHLH proteins (Yang et al., 2014). These findings suggest a second, not mutually exclusive model in which cortical RPs are transcriptionally primed to make diverse neuronal subtypes and in which selective repression determines which specifiers are translated and, thus, which types of neurons are generated.
Here we have tested this model and provide evidence that, during embryonic neurogenesis, cortical RPs co-express mRNAs encoding specifiers for diverse cortical neuron subtypes and that a complex involving 4E-T and the RNA-binding protein Pumilio2 selectively represses translation of some of these mRNAs to ensure the appropriate specification of daughter neurons. RESULTS
Single-Cell RNA Sequencing Demonstrates that Embryonic RPs Co-express mRNAs Encoding Specification Factors for Different Types of Cortical Neurons
To identify neuronal specification genes expressed by embry-onic precursors, we analyzed recently published single-cell
A
Pou3f3/Brn1
Cux1
0 1 2 3 0 1 2 3
E15.5 E17.5
0 1 2 3 0 1 2 3
Pou3f3/Brn1 Cux1
E13.5Pou3f3/Brn1
Cux1
0 1 2 3 4 0 1 2 3 4
Ctip2
E13.5Fezf2
0 1 2 3 4 0 1 2 3 4Ctip2
Fezf2
E15.5 0 1 2 3 4 0 1 2 3 4E17.5
Ctip2
Fezf2
0 1 2 3 0 1 2 3 C
E15.5
Pax6 Hes5 Ctip2 Tle3 Tle4 Tle1 Diap3 Brn1 Fezf2 Brn2 B Brn1 Brn2 Gene Lhx2 Cux1 Tle3 Bhlhe22 Tle4 Ctip2 Fezf2 Otx1 Sox5 Lix1 Lmo4 Diap3 Tle1 Foxp2 38 29 19 25 7 17 4 10 16 7 7 26 7 31 1 3 51 51 46 33 13 27 3 10 16 29 14 21 13 19 11 6 % E15.5 RPs 36 38 34 15 Tbr1 2 6 4 1 9 21 21 55 13 23 12 20 9 24 6 % E13.5 RPs % E17.5 RPs E13.5 E15.5 E17.5 Age 73 % RPs expressing both DL and SL specifiers 72 54 21 % RPs expressing only SL specifiers 17 19 4 % RPs expressing only DL specifiers 8 23 D E 0 1 2 3 4 5 6 7 8 9 10 11 12 0 5 10 15 20 25 30 # of specifiers %RP s exp ress ing sp ec ifie rsE13.5
E15.5
E17.5
F 0 1 2 3 4 5 A ve rag e # of sp eci fier s pe r R P ns**
***
E13.5
E15.5
E17.5
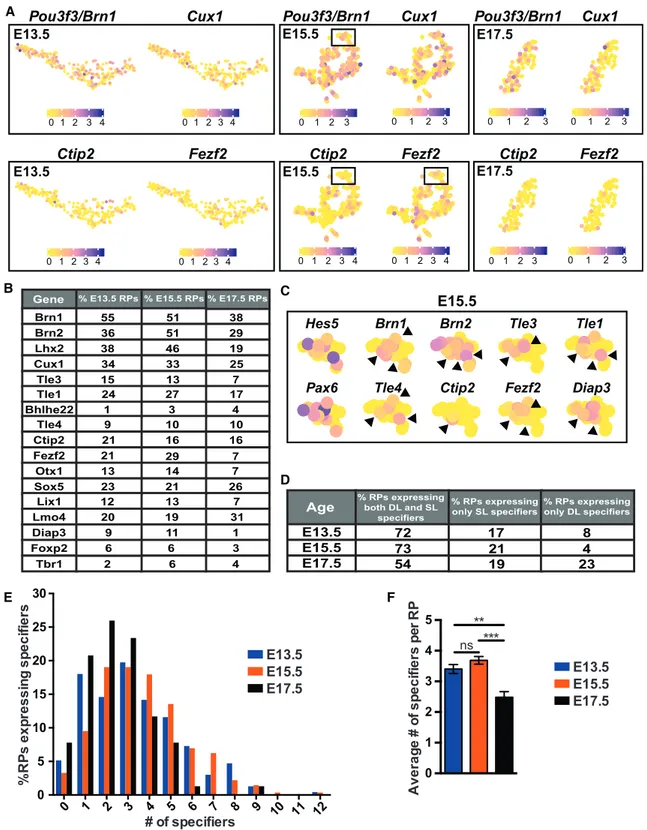
Figure 1. Individual Embryonic RPs Detectably Co-express Specification mRNAs, as Determined by scRNA-Seq
Analysis of scRNA-seq data from the E13.5, E15.5, and E17.5 RP clusters inYuzwa et al. (2017)(GEO: GSE107122;Figure S1).
(A) t-SNE visualization of E13.5, E15.5, and E17.5 scRNA-seq data overlaid with expression of the superficial layer (SL) specifiers Pou3f3/Brn1 and Cux1 and the deep layer (DL) specifiers Ctip2 and Fezf2. Cells are color-coded according to expression level, ranging from not detected (yellow) to the highest detected levels (blue), according to the adjacent color key. Boxed regions in the E15.5 images are shown at higher resolution in (C).
(B) Table showing the percentages of E13.5, E15.5, and E17.5 RPs expressing superficial and deep layer neuron specifiers.
RNA sequencing (scRNA-seq) data from the murine cortex ob-tained at E13.5, when both deep and superficial layer neurons are generated; at E15.5, when only superficial layer neurons are made; and at E17.5, when neurogenesis is over (Yuzwa et al., 2017; GEO: GSE107122). This study used droplet sequencing (Drop-seq) to transcriptionally profile 2,000–5,000 total cortical cells at each age and to define RPs, IPs, and neu-rons (Figure S1A). We focused on the RP clusters in these data-sets, which included 233, 273, and 77 cells at E13.5, E15.5, and E17.5, respectively (Figure S1A).
We first analyzed the E13.5 and E15.5 RP transcriptomes for expression of 26 genes encoding proteins that specify and/or are associated with cortical neurons in different layers (termed specification genes). These included 13 genes for superficial layer neurons (Pou3f3/Brn1, Pou3f2/Brn2, Lhx2, Cux1, Tle3,
Tle1, Mef2c, Bhlhe22/Bhlhb5, Cux2, Pou3f1/Oct6, Kitl, Unc5d,
and Satb2) and 13 for deep layer neurons (Tle4, Fezf2, Ctip2,
Otx1, Sox5, Lix1, Lmo4, Diap3, Lxn, Foxp2, Tbr1, Ldb2, and Pcp4). All of these mRNAs were detectably expressed in E13.5
neurons (see Figure S1B for examples; Yuzwa et al., 2017). Six superficial layer (Pou3f3/Brn1, Pou3f2/Brn2, Lhx2, Cux1,
Tle3, and Tle1) and nine deep layer neuron mRNAs (Tle4, Fezf2, Ctip2, Otx1, Sox5, Lix1, Lmo4, Diap3, and FoxP2) were
detectably expressed in 6%–55% of E13.5 and E15.5 RPs ( Fig-ures 1A and 1B). Visualizations using t-distributed stochastic neighbor embedding (t-SNE) indicated that among the most widely detected were the superficial layer specifiers Pou3f3/
Brn1 (51%–55%) and Cux1 (33%–34%), and the deep layer
specifiers Fezf2 (21%–29%) and Ctip2 (16%–21%) (Figures 1A and 1B). The remaining 11 genes were detectably expressed in %5% of E13.5 RPs (Bhlhe22 [1%], Cux2 [0.5%], Pou3f1/Oct6 [3%], Kitl [3%], Unc5d [2%], Satb2 [3%], Mef2c [2%], Lxn [5%], Ldb2 [2%], Pcp4 [4%], and Tbr1 [2%]) and were not further analyzed, except for Bhlhe22 and Tbr1, which were included as examples of neuron-enriched specification genes (Figure S1B). The t-SNE visualizations also showed that many RPs co-ex-pressed deep and superficial layer neuron specification mRNAs (Figure 1C). We quantified this by determining the proportion of E13.5 and E15.5 RPs that co-expressed the 15 superficial versus deep layer genes expressed in more than 5% of the RPs plus
Bhlhe22 and Tbr1 (that is, the genes shown inFigure 1B). At both ages, R95% of cells in the RP clusters expressed at least one specification mRNA, and 72%–73% co-expressed both superficial and deep layer mRNAs. A distribution analysis ( Fig-ure 1E) showed that >50% of RPs at E13.5 and E15.5 expressed 3 or more specification genes (seeFigure 1C for examples) and that about 10% expressed 6–10. Thus, from E13.5 to E15.5,
most RPs are transcriptionally primed to make diverse cortical neurons. A similar analysis at E17.5, when neurogenesis is over, showed that all of the specification genes were still detect-ably expressed in at least some RPs (Figures 1A and 1B) and that many RPs still co-expressed superficial and deep layer neuron specification genes (Figure 1D). However, individual E17.5 RPs did not express as many specification genes as at the earlier time points, and very few expressed 6 or more (Figures 1E and 1F).
Deep and Superficial Layer Neuron Specification mRNAs Are Co-expressed in RPs throughout Neurogenesis
We further characterized the co-expression of neuronal specifi-cation genes in RPs by performing single-molecule fluorescence
in situ hybridization (FISH). We focused initially on Brn1 mRNA
because it had widespread expression in RPs, as indicated by the scRNA-seq data (Figures 1A, 1B, andS1B), and because it is important for superficial layer neurogenesis (Sugitani et al., 2002; Dominguez et al., 2013). We analyzed the cortex at E12, before superficial layer neurons are generated. Immunostaining with an antibody that recognizes both Brn1 and Brn2 combined with FISH (Figures 2A andS2A) showed that Brn1/Brn2 protein was undetectable in the medial cortex, as published previously (Dominguez et al., 2013), but that Brn1 mRNA was expressed in most Pax6-positive RPs. We asked whether these Brn1 mRNA-positive RPs co-expressed other neuronal specification mRNAs, analyzing Tle4 (layer V/VI), Tle3 (layer II/III), and Diap3 (predominantly layer V) mRNAs. Multi-label FISH at E12 and E13 showed that many RPs co-expressed these mRNAs and that about 70% of cells in the E13 precursor-containing ventric-ular zone (VZ) and subventricventric-ular zone (SVZ) co-expressed Brn1,
Tle4, and Diap3 mRNAs (Figures 2B–2D).
A similar analysis at E15 and E17 (Figures 2D–2F) showed that the proportion of VZ/SVZ cells co-expressing Brn1, Tle4, and
Diap3 mRNAs decreased from E13 to E17 but that
approxi-mately 30% of E17 RPs still co-expressed all 3 mRNAs. Coinci-dentally, there was an increase in VZ/SVZ cells that expressed only Brn1 mRNA (Figure 2E). Triple-label FISH with negative control probes demonstrated the specificity of these analyses (Figures S2B and S2C).
We confirmed the co-expression of neuronal specification mRNAs in RPs by analyzing cultured E12.5 cortical precursors that generate neurons in vitro. Triple-label FISH combined with immunostaining (Figures 2G and 2H) showed that many bIII-tubulin-negative precursors co-expressed Brn1, Tle4, and
Diap3 mRNAs, although some were also positive only for Brn1
(C) Higher-resolution t-SNE visualizations of E15.5 RPs from the boxed regions in (A), showing overlaid expression of Hes5, Brn1, Brn2, Tle3, Tle1, Pax6, Tle4,
Ctip2, Fezf2, and Diap3 mRNAs. Gene expression levels are color-coded as in (A). Arrowheads denote individual RPs co-expressing superficial and deep layer
specifier mRNAs.
(D) Table showing the percentage of E13.5, E15.5, and E17.5 RPs expressing both superficial and deep layer neuron specifiers, only superficial layer specifiers, or only deep layer specifiers.
(E) Histograms showing the number of specification mRNAs, of the 17 listed in (B), that were detected in individual RPs at E13.5, E15.5, and E17.5, expressed as a percentage of the total RPs at the same age.
(F) Average number of specification mRNAs detected in individual RPs at E13.5, E15.5, and E17.5. **p < 0.01, ***p < 0.001, ns = p > 0.05 by one-way ANOVA with Tukey’s multiple comparisons test; n = 233, 273, and 77 RPs for E13.5, E15.5, and E17.5 respectively. Error bars denote SEM.
A B
D E F
Brn1 mRNA
/Brn1/2/
Pax6
/
Hoechst
Cortex
VZ
Brn1
/
Tle3
/Diap3/
Hoechst
LV
E12
VZ
Diap3
/
Brn1
/
Tle4
/
Hoechst
LVE17
VZ/SVZ
CTle4
/
Brn1
/
Hoechst
VZ
LVE12
0 80 ** 60 40 20 % cells with Diap3 , Brn1 & Tle4 mRNA in VZ/SVZE13 E15 E17 * *** E13 E17 * 0 30 20 10
% cells with only
Brn1 mRNA in VZ/SVZ E15 ** *** G
Diap3
/
Brn1
/
Tle4
/
βIII
H IBrn1/2
/
Tle4
/
Hoechst
V
VI
P3 Merge
Tle4
Brn1/2
JBrn1/2/
Brn1
/Tle4
Layer
II-IV
neurons
P3
Brn1/2
Brn1
Tle4
K
Diap3
/
Brn1
/Tle4/
Hoechst
P3
Merge Diap3 Brn1 Tle4Layer
II-III
neurons
LTle4/
Brn1
/Tle4
Layer VI neurons
Tle4
Brn1
Tle4
P3
Diap3
/
Brn1
/
Tle4
/
βIII
II-IV
Brn1 mRNA
Brn1/2
Pax6
LVMerge
mRNA. Intriguingly, about 30% of newborn bIII-tubulin-positive neurons also co-expressed Brn1, Tle4, and Diap3 mRNAs ( Fig-ure 2G, top), although many expressed only Brn1 mRNA and some only Tle4 mRNA (Figure 2H).
We asked whether this neuronal co-expression was also seen
in vivo, examining the cortex at postnatal day 3 (P3), when
neuro-genesis is complete. Immunostaining (Figure 2I) confirmed that, as published previously (Yao et al., 1998; Dominguez et al., 2013), Brn1/2 and Tle4 proteins were detectably expressed in mutually exclusive superficial and deep layer neurons, respec-tively. In contrast, FISH showed that, in superficial layers II–IV, where there were no Tle4-positive cells, some Brn1/2 protein-positive cells expressed both Brn1 and Tle4 mRNAs (Figure 2J). Indeed, triple-label FISH showed that some neurons in the most superficial layers co-expressed Brn1, Tle4, and Diap3 mRNAs (Figure 2K). Conversely, in layer VI, where there were no Brn1/2 protein-positive cells, some Tle4-protein positive cells co-expressed both Tle4 and Brn1 mRNAs (Figure 2L). Thus, newborn cortical neurons appropriately express laminar specifi-cation proteins, but, at the transcriptional level, some of them are more promiscuous.
Identification of a Pum2/4E-T Translational Repression Complex in Embryonic RPs
These data suggest that post-transcriptional regulation is impor-tant for neuronal specification. Because we showed that the translational repressor protein 4E-T regulates the extent and timing of cortical neurogenesis (Yang et al., 2014), we asked whether it might also be in a complex with neuronal specification mRNAs. Analysis of our previously published 4E-T RNA
immuno-precipitation (RIP) data from the E12.5 cortex showed that
Brn1, Tle3, Tle4, Mef2c, Bhlhe22, and Diap3 mRNAs were all
significantly associated with 4E-T (adjusted p values: Brn1, 1.75 3 10!3; Tle3, 8.53 3 10!4; Tle4, 2.81 3 10!3; Mef2c,
1.55 3 10!3; Bhlhe22, 2.72 3 10!6; Diap3, 6.13 3 10!2). We
confirmed the association of 4E-T with Brn1, Tle3, and Tle4 mRNAs in the RIPs by performing qPCR analysis (Figure 3A).
Because 4E-T does not directly bind RNA, we asked whether the 30UTRs of cortical mRNAs associated with 4E-T were
en-riched in RNA-binding protein consensus elements, as predicted by RNAcompete (Ray et al., 2009). This analysis showed that Pumilio1/2 (Pum1/2) consensus motifs significantly distin-guished 4E-T target mRNAs from background mRNAs (area under the receiver operating characteristic curve [AU-ROC] = 0.79; STAR Methods). Of particular relevance is that Brn1,
Tle3, Tle4, Bhlhe22, Diap3, and Mef2c mRNAs all had
computa-tionally predicted Pum1/2 consensus sites (Table S1).
Because Pumilio proteins are known translational repressors (Wickens et al., 2002; Miller and Olivas, 2011; Quenault et al., 2011), and Pum2 is expressed in embryonic cortical RPs (Vessey et al., 2012), we asked whether Pum2 and 4E-T were associated in the embryonic cortex. Four lines of evidence indicated that they were. First, western blots showed that Pum2 was present in anti-4E-T immunoprecipitated complexes from the E12/13 cortex (Figure 3B). Second, immunostaining of cultured E12/13 cortical precursors showed that Pum2 and 4E-T were both pre-sent in cytoplasmic granule-like structures and that about 65% of Pum2-positive puncta were also positive for 4E-T (Figure 3C). Moreover, as seen previously for 4E-T (Yang et al., 2014), many Pum2-positive puncta were also positive for the P body protein
Figure 2. Developing Cortical RPs and Newborn Neurons Co-express mRNAs Associated with Superficial and Deep Layer Cortical Neurons
(A) Representative high-magnification confocal z stack images of the E12 cortical VZ showing FISH for Brn1 mRNA (green, left and center left) and immuno-staining for Pax6 (turquoise, right) and Brn1/2 protein (red, center right; not detectable at this age). The merged image (left) shows Brn1/2 protein, Brn1 mRNA, and Hoechst 33258 counterstain (dark blue), but not Pax6. The hatched white lines denote the apical cortical border with the lateral ventricle (LV). A corresponding low-magnification image of the same section is shown inFigure S2A.
(B and C) Representative confocal z stack images of multi-label FISH for Brn1 (green), Tle3 (red), and Diap3 (blue) (B) or Brn1 (red) and Tle4 (green) (C) mRNAs in E12 coronal cortical sections, showing the VZ and the apical border (hatched white line). The boxed areas are also shown at higher magnification at the right, and single-cell nuclei are highlighted (outlined in white; Hoechst counterstain is light blue).
(D and E) Quantification of images as in (B), (C), and (F) for the proportion of VZ/SVZ cells expressing Brn1, Diap3, and Tle4 mRNAs (D) or Brn1 mRNA only (E) at E13, E15, and E17. *p < 0.05, **p < 0.01, ***p < 0.001; n = 3 embryos per time point, 100 cells per embryo.
(F) Representative confocal z stack image of multi-label FISH for Brn1 (red), Tle4 (blue), and Diap3 (green) mRNAs in an E17 coronal cortical section, showing the VZ/SVZ and the apical border (hatched white line). The boxed area is also shown at higher magnification at the bottom, and a single cell nucleus is highlighted (outlined in white; Hoechst counterstain is light blue).
(G and H) Representative z stack images of cortical cultures immunostained for ßIII-tubulin (purple) and analyzed by FISH for Brn1 (red), Tle4 (blue), and Diap3 (green) mRNAs. The arrow in the top image in (G) denotes a ßIII-tubulin-positive cell co-expressing all three mRNAs, whereas the arrow in the lower image (G) denotes a ßIII-tubulin-negative cell expressing only Brn1 mRNA.
(I) Representative images of a P3 cortical section immunostained for Brn1/2 (green) and Tle4 (red) and counterstained with Hoechst 33258 (blue in the left merged image). Arrows and arrowheads denote Tle4-positive and Brn1/2-positive neurons, respectively. Hatched lines delineate boundaries between layers II–IV, V, and VI.
(J) High-magnification confocal image showing FISH for Brn1 (red) and Tle4 (blue) mRNAs and immunostaining for Brn1/2 (green) in the superficial layers (II–IV) of the P3 cortex. Arrows indicate neurons co-expressing Brn1 and Tle4 mRNAs, and one of these (circled) is shown at higher magnification at the right, with the color channels pulled apart.
(K) Representative confocal z stack images showing FISH for Brn1 (red), Tle4 (blue), and Diap3 (green) mRNAs in the superficial layers (II/III) of the P3 cortex. Boxed cells are shown at higher magnification on the right, with the color channels pulled apart. White ovals denote cell boundaries defined by Hoechst nuclear staining (light blue/gray in the left merged image).
(L) High-magnification confocal image showing FISH for Brn1 (green) and Tle4 (blue) mRNAs and immunostaining for Tle4 (red) in layer VI of the P3 cortex. Arrows denote neurons co-expressing Brn1 and Tle4 mRNAs, and one of these (circled) is shown at higher magnification on the right, with the color channels shown separately.
Scale bars, 10 mm in (A) and (K) (low magnification), 5 mm in (B), (C), (F)–(H), (J), (L), and (K) (high magnification), and 30 mm in (I). Error bars denote SEM. See also Figure S2.
B H E
Pum2/4E-T
Hoechst
FPum2/Dcp1
Hoechst
% Pum 2+ fo ci Bin0 2 10 20 30 40 50 *** *** *** 1 3 4 I %Pum2+4E-T+/ Pum2+ foci 20 40 60 80 Bin 1 2 3 4 *** *** *** 0 DPum2
/Dcp1/
Hoechst
Merge
4E-T
/Pum2/
Hoechst
VZ/SVZ
LV
Bin 1
Bin 2
Bin 3
Bin 4
Merge
C YZ XZ4E-T
/
Pum2
/
Hoechst
YZ XZ
YZ XZ Input IgG 4E-T
4E-T
Pum2
IP p p Tle3 Tle4 Brn1 0 2 4 6 8qPCR fold enrichment
(RIP/Input)
IgG RIP 4E-T RIP ** ** A GMerge
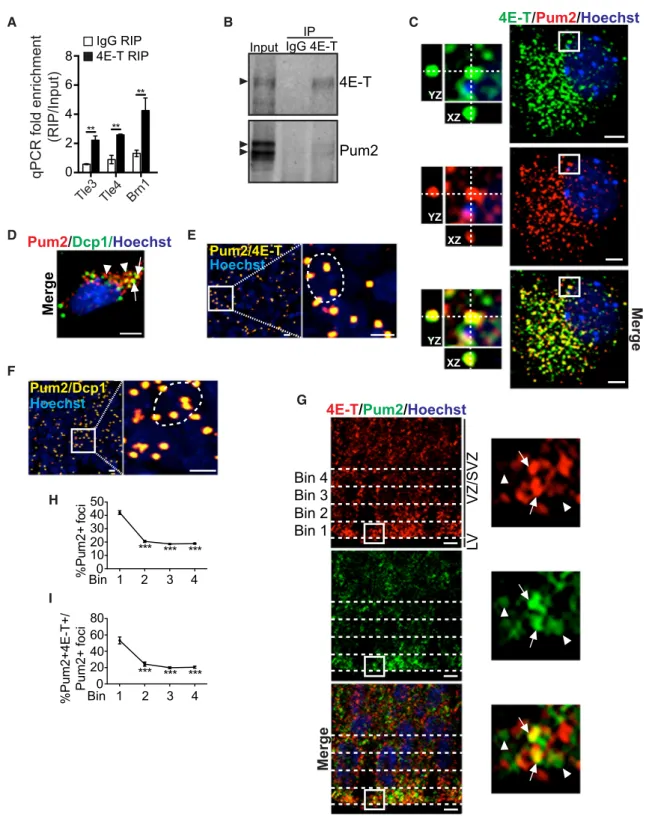
**Figure 3. Pum2 and 4E-T Are Closely Associated in Embryonic RPs
(A) qPCR validation for Tle3, Tle4, and Brn1 mRNAs in three independent 4E-T and control IgG immunoprecipitates and their initial inputs. Shown is fold enrichment of each mRNA relative to input. **p < 0.01 (pairwise comparison to IgG RIP).
(B) Western blots of E12.5 cortical lysates (input) immunoprecipitated with control IgG (IgG) or anti-4E-T (4E-T), probed for 4E-T or Pum2. Arrowheads denote target proteins.
(C and D) Representative images of E12 precursors cultured for 3 days, immunostained for Pum2 (red) and 4E-T (green, C) or Dcp1 (green, D), and counterstained with Hoechst 33258 (blue). The boxed regions in (C) are shown at higher magnification (left) and also indicate co-localization on the z axis (XZ and YZ) with hatched lines. In (D), arrows and arrowheads indicate Pum2 foci positive or negative for Dcp1, respectively.
Dcp1 (Figure 3D). Third, proximity ligation assays identified foci in cultured cortical precursors where Pum2 was located within 40 nm of 4E-T or Dcp1 (Figures 3E and 3F). In contrast, proximity ligation assays for Pum2 and the NPY1 receptor or Pax6 showed only a few background dots (Figure S3).
Fourth, we asked whether Pum2 and 4E-T were associated
in vivo. Immunostaining of E13 cortical sections (Figure 3G) showed that Pum2-positive puncta were present throughout the cortex and significantly enriched in the most apical region of the VZ (Figures 3G and 3H). In this same apical region, about 50% of Pum2-positive puncta were also positive for 4E-T ( Fig-ures 3G and 3I). To ensure that this co-localization was specific, we randomized the images (Costes et al., 2004). For the original Pum2/4E-T data, Pearson’s coefficient was r = 0.541, and for the randomized data it was r = 0.0 ± 0.009 (p = 100% that co-local-ization was not random).
Pum2 and 4E-T Share Target mRNAs, Including Neuronal Specification mRNAs
These data predict that some 4E-T target mRNAs would be associated with Pum2. To test this prediction, we immuno-precipitated Pum2 from the E12 cortex and analyzed the co-immunoprecipitated mRNAs by microarrays (GEO: GSE108404). As controls, we performed similar immunopre-cipitations with non-specific immunoglobulin G (IgG). We analyzed these microarray datasets (three independent repli-cates each of the Pum2 and IgG immunoprecipitations), first removing all non-protein-coding genes and genes with an IgG/input fold change of greater than 1.5. We then defined the Pum2 target set as those remaining mRNAs that were en-riched more than 1.5-fold in the Pum2 RIP versus input, with p < 0.05. We also defined a background set, including mRNAs that were not enriched in the Pum2 RIP (fold change of less than 1) with p < 0.05. This analysis defined 1,783 probes as Pum2 targets and 2,806 as the background set (Table S2). Of the 1,783 Pum2 target mRNAs, 282 were also 4E-T target mRNAs that had Pum1/2 consensus motifs in their 30 UTRs
(Table S1), including Tle3, Tle4, Neurog1, Neurog2, Ascl1, and Mef2c mRNAs. Brn1 mRNA, which is a 4E-T target that contains consensus Pum1/2 motifs (Table S1), was also signif-icantly associated with Pum2 in the RIP dataset (p = 0.017) but was enriched only 1.3-fold. Other mRNAs defined as shared Pum2 and 4E-T targets that encoded transcriptional regulators were Arid1a, Bcl6, Ets2, E2f3, Gli2, Klf6, Mkl1, Meis1, Nkrf,
Phf12, Pou3f4, Prdm16, Sox13, Sox2, Rere, Bhlhe40, Cbx4, Cbx8, Elp3, Epc2, Foxc1, Foxk1, Irf2bp1, Jun, Lin54, Maml1, Med23, Mn1, Myc, Mef2a, Nrip1, Nfya, Pias1, Rnf44, Sal13, Stat3, Six4, Txnip, Sp8, Tfap2a, Usp22, Mafb, Mycn, Zbtb14,
Zfp11, Zfp143, Zfp229, Zfp273, Zfp282, Zfp518a, Zfp763, Zfp85, Zic1, Zic3, and Zhx1.
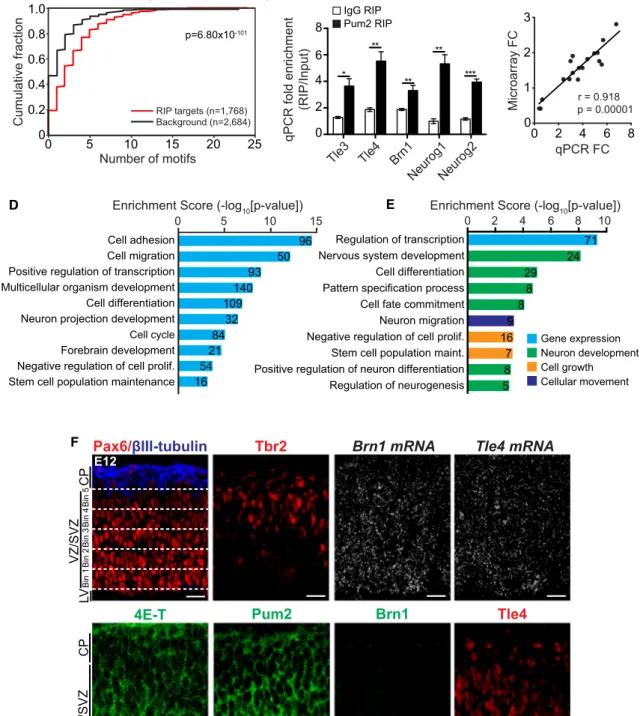
We validated the Pum2 RIP dataset in a number of ways. First, computational analysis defined significantly more Pum1/2 motif occurrences in the 30UTRs of Pum2 target mRNAs versus a set
of background mRNAs not enriched in the Pum2 RIP (Figure 4A). Second, qPCR of three independent Pum2 RIP experiments confirmed that Tle3, Tle4, Brn1, Neurog1, and Neurog2 mRNAs were all significantly enriched in the Pum2 RIPs (Figure 4B). Finally, we performed a correlation analysis, comparing relative fold changes in mRNA levels as determined by microarrays versus qPCRs. For this comparison, we analyzed the shared Pum2 and 4E-T target mRNAs (Tle3, Tle4, Brn1, Neurog1, and
Neurog2) and eight other Pum2 target mRNAs (4et, Brn4, Prox1, Celsr2, Foxq1, Ptpru, Rabgef1, and Tspan14). We also
included four mRNAs (Foxf2, Sepp1, Cox6b1, and Mmd2) that were not enriched in the Pum2 RIPs. There was an excellent correlation (r = 0.918) between the fold changes obtained using microarrays versus qPCRs (Figure 4C).
We next used the database for annotation, visualization, and integrated discovery (DAVID) to perform gene ontology on all Pum2 target mRNAs in the RIP dataset and on the subset of these that were also 4E-T target mRNAs. Total Pum2 targets were highly enriched for proteins associated with cell adhesion, cell migration, transcription, cell differentiation, cell cycle and forebrain, projection neuron, and stem cell development ( Fig-ure 4D;Table S3). The Pum2/4E-T shared targets were particu-larly enriched for proteins associated with transcriptional regula-tion and nervous system/neuronal development (Figure 4E; Table S3). We obtained a similar enrichment for transcriptional regulators when the Pum2/4E-T dataset was analyzed by protein analysis through evolutionary relationships (PANTHER). Of 282 shared target mRNAs, 126 encoded proteins assigned to cate-gories by PANTHER, and the most enriched group included 37 transcription factors (Table S4).
Pum2 and 4E-T Are Associated with Brn1 and Tle4 mRNAs in Apical RPs during Cortical Neurogenesis The shared Pum2 and 4E-T transcription factor targets included
Brn1 and Tle4 mRNAs. Because these mRNAs are co-expressed
during neurogenesis, we asked whether they were associated with Pum2 and/or 4E-T in RPs. Initially, we used immunostaining and FISH to define their expression patterns in the E12 cortex during deep layer neurogenesis. At this age, 4E-T and Pum2 proteins were detectable throughout the cortex (Figure 4F). Brn1 protein was not detectable, but Brn1 mRNA was present in all cortical layers (Figure 4F), in agreement with the E13.5 scRNA-seq data (Figure S1B), which also showed that the
(E and F) Representative confocal z stack images of E12 precursors cultured for 3 days and analyzed by proximity litigation assay (PLA) with antibodies for Pum2 and 4E-T (E) or Dcp1 (F). Cells were counterstained with Hoechst 33258 (blue), and gold dots indicate the PLA signal. Boxed regions are expanded on the right, and single nuclei are demarcated (hatched lines).
(G) Confocal images of an E13 section immunostained for Pum2 (green) and 4E-T (red), counterstained with Hoechst 33258 (blue in merged image). Boxed regions are expanded on the right. Arrows and arrowheads denote Pum2 foci that are or are not co-localized with 4E-T. Hatched white lines denote the four bins used for quantification.
(H and I) Quantification of the images as in (G) for the percentage of total Pum2 granules in each of the four bins (H) or for the percentages of Pum2 granules in each bin that were also positive for 4E-T (I). ***p < 0.001 by one-way ANOVA with Dunnett’s multiple comparisons test; n = 3 embryos.
0 2 0 1 2 3 4 6 8 Microarray FC qPCR FC p = 0.00001r = 0.918 B C D E 15
Enrichment Score (-log10[p-value])
0 5 10
Cell adhesion Cell migration Positive regulation of transcription Multicellular organism development Cell differentiation Neuron projection development Cell cycle Forebrain development Negative regulation of cell prolif. Stem cell population maintenance
50 96 93 140 109 32 84 21 54 16 A * ** ** *** ** Tle3 Tle4 Brn1 0 2 4 6 8 qPCR fold enrichment (RIP/Input) Neurog1Neurog2 IgG RIP Pum2 RIP F
Pax6/
βIII-tubulin
VZ/SVZ LV CPE12
Brn1 mRNA
Tle4 mRNA
Pum2
VZ/SVZ LV CP4E-T
Tbr2
B in 1 Bi n 2Bi n 3Bi n 4Bi n 5Tle4
Brn1
Gene expression Neuron development Cell growth Cellular movement 4 2 6 8 10 0 Cell differentiation Pattern specification process Negative regulation of cell prolif. Neuron migration Stem cell population maint. Cell fate commitmentRegulation of neurogenesis
Enrichment Score (-log10[p-value])
Nervous system development Regulation of transcription
Positive regulation of neuron differentiation
71 24 29 8 8 9 16 7 8 5 Pum2 Motif Counts (RNAcompete PWM)
1.0 0.8 0.6 0.4 0.2 0 0 5 10 15 20 Cumulative fraction Number of motifs p=6.80x10-101 25 RIP targets (n=1,768) Background (n=2,684)
Figure 4. Pum2 and 4E-T Share Target mRNAs
(A–E) Pum2 was immunoprecipitated from the E12/E13 cortex, and associated mRNAs were analyzed by microarray (GEO: GSE108404). As a control, similar immunoprecipitations were performed with non-specific IgG. Three independent samples of each were analyzed. The Pum2 target set was defined as the 1,768 mRNAs with enrichment of greater than 1.5-fold (p < 0.05) versus the input, whereas the background set included 2,684 mRNAs that were not enriched in the Pum2 RIP (fold change of less than 1; p < 0.05) (seeTable S2for lists of these mRNAs).
(A) The 30UTRs of mRNAs from the Pum2 RIP target and background datasets were analyzed for occurrences of the top 10 Pum1/2 n-mer consensus motifs predicted by the RNAcompete position frequency matrix (PFM). Motif occurrences were counted, and the cumulative distribution function (CDF) of motif counts is displayed separately for the two groups of mRNAs. The CDF calculates the cumulative probability for a given motif count, and this is significantly larger in the target versus background datasets (p = 6.80 3 10!101, Wilcoxon rank-sum test).
average Brn1 mRNA levels in Brn1-positive RPs and neurons were similar (1.34 and 1.38 a.u., respectively). In contrast to Brn1, at E12, Tle4 protein was present in cells from the VZ/SVZ to the cortical plate (CP) (Figure 4F), consistent with ongoing deep layer neurogenesis. Tle4 mRNA was also distributed across the E12 cortex (Figure 4F), in agreement with the E13.5 scRNA-seq, showing similar expression levels in Tle4-positive RPs and neurons (0.97 and 1.33 a.u., respectively). As controls for the specificity of the FISH, we showed that two RP markers,
Vcam1 and Aldoc mRNAs, were found only in the VZ/SVZ of the
E13 cortex (Figure S4A).
We next performed co-localization studies, combining immu-nostaining and FISH. Quantification of Brn1 mRNA in the CP and five equal-sized bins spanning the VZ/SVZ confirmed that it was equally distributed across the cortex (Figures 4F,5A, and 5C). Approximately half of the Brn1 mRNA foci were co-localized with 4E-T in the most apical precursors (Bin 1) and in the CP, with significantly less co-localization in other regions (Figures 5A and 5D). A similar high level of co-localization between Pum2 and Brn1 mRNA was found in the most apical RPs (Figures 5B and 5E), with 30%–40% co-localization in other cortical com-partments. A similar analysis for Tle4 mRNA confirmed that it was also equally distributed across the cortex (Figures 4F,5F, and 5H). However, only about 20% of Tle4 mRNA was associ-ated with 4E-T in the most apical RPs (Bin 1), with less associa-tion elsewhere (Figures 5F and 5I). Co-localization with Pum2 was also lower, with approximately 29% of Tle4 mRNA foci asso-ciated with Pum2 in the VZ and less elsewhere (Figures 5G and 5J).
Two controls demonstrated the specificity of these analyses. First, we randomized the data (Costes et al., 2004). For the original versus randomized 4E-T/Brn1 mRNA data, Pearson’s coefficients were r = 0.271 and r = 0.0 ± 0.033, respectively (p = 100%). For the original versus randomized 4E-T/Tle4 mRNA data, r = 0.198 and r = 0.0 ± 0.057 (p = 100%). For the original versus randomized Pum2/Brn1 mRNA data, r = 0.465 and r = 0.0 ± 0.038 (p = 100%). For the original versus random-ized Pum2/Tle4 mRNA data, r = 0.357 and r = 0.0 ± 0.008 (p = 100%). Second, we performed a co-localization analysis for Glo1 mRNA, which is not a target of Pum2 or 4E-T. Less than 19% of Glo1 mRNA foci were co-localized with Pum2 in the E12 VZ/SVZ (Figures S4B and S4C), and our previously published data showed a similar low level of co-localization (10%–13%) of Glo1 mRNA with 4E-T in the VZ/SVZ (Yang et al., 2014). Thus, both Brn1 and Tle4 mRNAs co-localize with
4E-T and Pum2 in E12 apical RPs, but Brn1 mRNA is more highly co-localized.
These data showed that about 50% of Brn1 mRNA was asso-ciated with 4E-T in E12 apical RPs. We asked whether this was also true at E16 during superficial layer neurogenesis. As seen at E12, 4E-T and Pum2 proteins and Brn1 mRNA were all ex-pressed throughout the cortex (Figures 5L,S4D, and S4E). How-ever, at this age, Brn1 protein was also readily detectable in cells located from the SVZ to the CP (Figure S4D), as published previ-ously (Dominguez et al., 2013). Quantification showed that Brn1 mRNA was equally distributed across the VZ/SVZ and that it was co-localized with 4E-T in the most apical RPs but that the asso-ciation with 4E-T was significantly decreased relative to E12 by more than 2-fold (Figures 5K–5N). Thus, translation of Brn1 pro-tein during superficial layer neurogenesis is associated with a decreased association between Brn1 mRNA and 4E-T in RPs. Pum2 or 4E-T Knockdown Causes Aberrant Co-expression of Brn1 and Tle4 Proteins during Neurogenesis
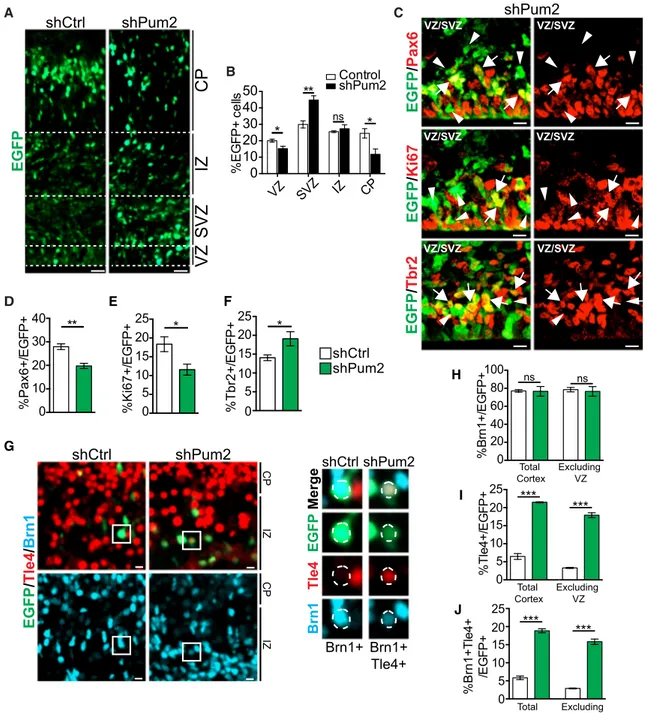
These data suggest that a Pum2/4E-T complex selectively re-presses mRNAs to regulate cortical neurogenesis and neuronal specification. In this regard, we showed previously that 4E-T knockdown enhanced neurogenesis by derepressing basic-helix-loop-helix (bHLH) proneurogenic mRNAs (Yang et al., 2014). Because our RIP data indicated that Ascl1, Neurog1, and Neurog2 were also Pum2 targets, we asked whether Pum2 regulated neurogenesis by knocking it down with a previ-ously characterized Pum2 short hairpin RNA (shRNA) (Vessey et al., 2006, 2010) after confirming its efficacy in cultured cortical precursors (Figures S5A and S5B). Specifically, we electropo-rated E13/14 cortices with Pum2 shRNA and a nuclear EGFP plasmid, selectively transducing RPs that generate predomi-nantly (90%) superficial layer neurons (Tsui et al., 2013; Gal-lagher et al., 2015). Immunostaining 3 days later demonstrated that EGFP-positive cell locations were altered by Pum2 knock-down, with a lower proportion in the VZ and CP and a higher pro-portion in the SVZ (Figures 6A and 6B).
We asked whether these alterations reflected aberrant neuro-genesis by immunostaining for EGFP and the RP marker Pax6, the proliferation marker Ki67, or the IP marker Tbr2 (Figures 6C andS5C). Pum2 knockdown significantly decreased the propor-tions of EGFP-positive RPs and proliferating precursors and increased EGFP-positive, Tbr2-positive IPs (Figures 6D–6F). These alterations were not due to increased cell death because
(B) qPCR validation of Brn1, Tle3, Tle4, Neurog1, and Neurog2 mRNAs in three independent Pum2 and control IgG immunoprecipitates and their initial inputs. Shown is fold enrichment of each mRNA relative to input. *p < 0.05, **p < 0.01, ***p < 0.001 (pairwise comparison with IgG RIP).
(C) Correlation of the average fold change (immunoprecipitates/input, n = 3) in the Pum2 RIP microarray versus qPCR analyses for the shared Pum2/4E-T target mRNAs in (B), eight other Pum2 target mRNAs (4et, Prox1, Brn4, Celsr2, Foxq1, Ptpru, Rabgef1, and Tspan14), and four mRNAs that were not enriched in the Pum2 RIPs (Foxf2, Sepp1, Cox6b1, and Mmd2). Each point represents one of these mRNAs. Pearson’s correlation coefficient = 0.918, p = 0.00001. (D and E) Gene ontology and pathway analysis for all Pum2 target mRNAs in the E12/E13 cortex (Tables S2andS3) (D) and for the 282 shared Pum2 and 4E-T target mRNAs (Tables S1andS3) (E). Shown are the top ontology terms ranked by their enrichment score (!log10 [p value], x axis; determined by a modified Fisher’s exact test) and the number of genes in each category. In (E), the terms were classified into four color-coded groups based on their biological functions. Some genes are annotated in several categories.
(F) Confocal images of E12 medial cortex sections immunostained for 4E-T (green), Pum2 (green), Brn1 (green, not detectable at this age), and Tle4 (red) or analyzed by FISH for Brn1 or Tle4 mRNA (both white dots). Also shown is immunostaining for Pax6 (red), Tbr2 (red), and bIII-tubulin (blue) to define the VZ, SVZ, and CP, respectively. The top left shows the 5 VZ/SVZ bins used for quantification. Scale bars, 30 mm.
C D J CP
%
Brn1
+
foci
Bin 1 2 3 4 50 30 20 10 0 20 40 60 CP Bin 1 2 3 4 5 *** *** *** ***%
Brn1
+4E-T+
/Brn1
+
foci
E H CP Bin 1 2 3 4 50 60 40 20%
Brn1
+Pum2+
/Brn1
+
foci
0 30 20 10 CP Bin 1 2 3 4 5%
Tle4
+
foci
I 0 20 40 60 CP Bin 1 2 3 4 5%
Tle4
+4E-T+
/Tle4
+
foci
** ** * * CP Bin0 1 2 3 4 5 60 40 20%
Tle4
+Pum2+
/Tle4
+
foci
* * * BBrn1
/
Pum2
/Hoechst
VZ
YZ
XZ
YZ
XZ
YZ
XZ
E12
G 0 60 40 20 E12 E16%
Brn1
+4E-T+
/Brn1
+
foci
*** N 5%
Brn1
+
foci
0 30 20 10 Bin 1 2 3 4 L ABrn1
/4E-T/
Hoechst
VZ
XZ
YZ
XZ
YZ
XZ
YZ
E12
F
Tle4
/4E-T/
Hoechst
YZ
XZ
YZ
XZ
YZ
XZ
E12
VZ
Tle4
/
Pum2
/Hoechst
YZ
XZ
YZ
XZ
YZ
XZ
E12
VZ
KBrn1
/4E-T/
Hoechst
Brn1
4E-T
Merge
E16
VZ/SVZ
M 60%
Brn1
+4E-T+
/Brn1
+
foci
5 4 * ** ** ** Bin 10 2 3 40 20three or fewer EGFP-positive cells per section expressed the apoptotic marker cleaved caspase-3 2 days post-electropo-ration with either control or Pum2 shRNA (n = 3 embryos each). Thus, like 4E-T knockdown, Pum2 knockdown enhanced neurogenesis.
To ask whether Pum2 knockdown also affected neuronal specification, we performed similar electroporations and analyzed Brn1 and Tle4 protein expression. Immunostaining 3 days post-electroporation showed that, in controls, approxi-mately 77% and 6% of EGFP-positive cells expressed Brn1 and Tle4 proteins, respectively (Figures 6G–6I). Pum2 knock-down had no effect on Brn1-positive cells but significantly increased EGFP-positive, Tle4-positive cells by about 3-fold (Figures 6H and 6I). Almost all EGFP-positive, Tle4-positive cells were also positive for Brn1 protein (Figures 6G and 6J). The large majority of these triple-labeled cells were located outside of the VZ, with most in the intermediate zone or CP (Figures 6G and 6J). Thus, Pum2 knockdown caused aberrant Tle4 protein expres-sion in Brn1 protein-positive cells, predominantly superficial neurons.
We asked whether 4E-T knockdown had similar effects using a previously characterized 4E-T shRNA (Yang et al., 2014). Three days post-electroporation with either control or 4E-T shRNAs, approximately 80% of EGFP-positive cells were Brn1 positive (Figures 7A and 7B). However, the proportion of Tle4-positive cells was almost tripled by 4E-T knockdown, and almost all of these Tle4 protein-positive cells co-expressed Brn1 protein ( Fig-ures 7A, 7C, and 7D).
Several additional experiments argued that the aberrant co-expression of Tle4 in Brn1-positive cells was not simply due to enhanced neurogenesis. First, we performed similar electropo-rations with an expression plasmid for Creb binding protein (CBP) S436D, an activated CBP phosphomimic that enhances neurogenesis by regulating histone acetylation (Wang et al., 2010, 2012). As predicted, CBP S436D enhanced neurogene-sis, as indicated by an increase in EGFP-positive cells in the CP and a decrease in the VZ (Figure 7E). It did not, however,
alter the proportion of EGFP-positive cells expressing Brn1 protein, Tle4 protein, or both (Figures 7F and 7G). Second, we transfected cultured E11.5 cortical precursors with Pum2, 4E-T, or control shRNA and a nuclear EGFP plasmid. Immuno-staining 2 days later showed that Pum2 or 4E-T knockdown increased the proportion of EGFP-positive, bIII-tubulin-nega-tive precursors that co-expressed Tle4 and Brn1/2 proteins (Figures S6A and S6B). Finally, we performed E13/14 electro-porations with control, Pum2, or 4E-T shRNA and analyzed them at 2 rather than 3 days, at which time point half of the electroporated cells are RPs and a further 20%–25% IPs (Yuzwa et al., 2016;Figures S6C and S6D). In controls, approx-imately 65%–70% of EGFP-positive VZ/SVZ cells were Brn1 protein positive, and this did not change with Pum2 or 4E-T knockdown (Figures 7H,S6E, and S6F). In contrast, Pum2 or 4E-T knockdown caused an approximately 3-fold increase in EGFP-positive, Tle4 protein-positive VZ/SVZ cells, and almost all of these were also positive for Brn1 protein (Figures 7I and 7J). Thus, Pum2 or 4E-T knockdown caused aberrant co-expression of Brn1 and Tle4 proteins in both precursors and newborn neurons.
Disruption of Pum2 or 4E-T Derepresses a Deep Layer Neuron Phenotype in Newborn Superficial Layer Neurons
We next asked whether the aberrant co-expression of Tle4 in Brn1-positive cells reflected a general derepression of a deep layer neuron phenotype by immunostaining electroporated sec-tions for Brn1 and three other deep layer transcription factors, Ctip2, Tbr1, and FoxP2 (Figures 8A, 8B, andS7). In controls, 72% of EGFP-positive cells were Brn1 protein positive, and very few expressed Ctip2 (1%), Tbr1 (4%–5%), or FoxP2 (6%– 7%) proteins (Figures 8A–8D, 8F, 8H, andS7). Following Pum2 knockdown, EGFP-positive, Brn1 protein-positive cells were unaltered, but EGFP-positive cells expressing Ctip2, Tbr1, or FoxP2 were increased to more than 15% (Figures 8A–8D, 8F, 8H, andFigure S7), and almost all of these were also positive
Figure 5. Cortical Neuron Specification mRNAs Are Associated with 4E-T and Pum2 in Embryonic RPs
(A and B) Confocal images showing FISH for Brn1 mRNA (red) and immunostaining for 4E-T (green; A) or Pum2 (green; B) in the E12 VZ. Sections were coun-terstained with Hoechst 33258 (blue). Arrows denote co-localized foci. Shown on the right are higher-magnification images of the boxed regions that also show co-localization on the z axis (XZ and YZ, indicated by hatched white lines).
(C–E) The E12 VZ/SVZ was divided into five equal bins, and the CP was considered as a separate bin (Figure 4F). Sections as in (A) and (B) were then quantified for the percentage of total Brn1 mRNA foci in each bin (C) or for the percentages of Brn1 mRNA foci within a bin that were co-localized with 4E-T (D) or Pum2 (E). ***p < 0.001 by one-way ANOVA with Dunnett’s multiple comparisons test; n = 3 embryos each.
(F and G) Confocal images showing FISH for Tle4 mRNA (red) and immunostaining for 4E-T (green; F) or Pum2 (green; G) in the E12 VZ. Sections were counterstained with Hoechst 33258 (blue). Arrows denote co-localized foci. Shown on the right are high-magnification images of the boxed regions that also show co-localization on the z axis (XZ and YZ, indicated by hatched white lines).
(H–J) The E12 cortex was subdivided as in (C)–(E), and sections as in (F) and (G) were then quantified for the percentage of total Tle4 mRNA foci in each bin (H) or for the percentages of Tle4 mRNA foci within a bin that were co-localized with 4E-T (I) or Pum2 (J). *p < 0.05, **p < 0.01 by one-way ANOVA with Dunnett’s multiple comparisons test; n = 3 embryos each.
(K) Confocal image showing FISH for Brn1 (red) and immunostaining of 4E-T (green) in the E16 VZ. The section was counterstained with Hoechst 33258 (blue). The boxed regions are expanded on the right, where the color channels are separated. Arrows denote Brn1-positive, 4E-T-positive foci and arrowheads foci that are
Brn1 positive only.
(L and M) The E16 VZ/SVZ was divided into five bins of equal width and quantified for the percentage of total Brn1 mRNA-positive foci in each bin (L) or for the percentages of Brn1 mRNA-positive foci within a bin that were co-localized with 4E-T (M). *p < 0.05, **p < 0.01 by one-way ANOVA with Dunnett’s multiple comparisons test; n = 3 embryos each.
(N) Quantification of the percentages of Brn1 mRNA-positive foci in the most apical bin (Bin 1) that were co-localized with 4E-T at E12 (white bar) and E16 (green bar). ***p < 0.001; n = 3 embryos each.
A
shCtrl
shPum2
VZ
SVZ
IZ
CP
VZ SVZ IZ CP 0 10 20 30 40 50 %E G FP + ce lls shPum2 Control*
*
**
B C F D 0 10 20 30 40**
%Pax6+ /E G FP + 0 5 10 15 20 25*
%Tbr2 +/ EGFP + E 0 5 10 15 20 25*
%Ki67+ /E G FP + shPum2 shCtrlshPum2
EGFP
/
Pax6
VZ/SVZ VZ/SVZ VZ/SVZEGFP
/
Ki67
VZ/SVZEGFP
/
Tbr2
VZ/SVZ VZ/SVZ GshCtrl shPum2
EGFP
Tle4
Brn1
Merge
Brn1+ Brn1+
Tle4+
CP IZEGFP
/
Tle4
/
Brn1
shCtrl
shPum2
CP IZ J H 0 20 40 60 80 100 ns %B rn 1+ /E G FP + ns Excluding VZ Total Cortex I 0 5 10 15 20 25 %T le 4+ /E GF P+***
***
0 5 10 15 20 25 %Brn1+ Tl e4 + /E GF P+***
***
Excluding VZ Total Cortex Excluding VZ Total CortexEGFP
nsFigure 6. Pum2 Is Important for Regulating Neurogenesis and Neuronal Specification
E13/E14 cortices were electroporated with a nuclear EGFP plasmid and Pum2 (shPum2) or control (shCtrl) shRNA, and coronal cortical sections were immunostained 3 days later at E16/E17.
(A) Representative images of electroporated sections immunostained for EGFP. Hatched white lines delineate the borders of the cortical regions. IZ, interme-diate zone.
(B) Quantification of images as in (A) for the percentages of EGFP-positive cells in each of the cortical regions. *p < 0.05, **p < 0.01; n = 4 embryos each, 3–4 sections per embryo.
(C) Representative confocal z stack images of the VZ/SVZ of sections electroporated with Pum2 shRNA and immunostained for EGFP (green) and Pax6 (red, top), Ki67 (red, center), or Tbr2 (red, bottom). Arrows and arrowheads indicate EGFP-positive, marker-positive cells and EGFP-positive, marker-negative cells, respectively.
(D–F) Quantification of sections as in (C) for the percentages of EGFP-positive cells expressing Pax6 (D), Ki67 (E), or Tbr2 (F). *p < 0.05, **p < 0.01; n = 3–4 embryos, 3–5 sections per embryo.
for Brn1 (Figures 8E, 8G, and 8I). These Brn1-positive, EGFP-positive cells aberrantly expressing deep layer transcription factors were almost all outside of the VZ, with many in the inter-mediate zone and CP (Figures 8A–8E). These cells were likely neurons because only a small population of EGFP-positive, Ctip2-positive cells outside of the VZ expressed the IP marker Tbr2 (Figure 8J).
We also asked about 4E-T knockdown. Similar electropora-tions showed that 4E-T knockdown increased the proportion of EGFP-positive, FoxP2 protein-positive cells from approxi-mately 3%–4% to about 15% (Figures 8K and 8L) and that almost all of these FoxP2-positive electroporated cells were also positive for Brn1 (Figures 8K and 8M). Thus, disruption of either Pum2 or 4E-T caused aberrant expression of a deep layer neuron phenotype in a subset of newborn Brn1-positive superfi-cial neurons.
DISCUSSION
During embryogenesis, cortical RPs sequentially generate different neuronal subtypes, with the earliest-born neurons populating deeper cortical layers and later-born neurons more superficial layers. Because it is now clear from lineage-tracing studies that individual RPs generate multiple types of cortical neurons (Guo et al., 2013; Gao et al., 2014; Eckler et al., 2015), a key question involves the molecular mechanisms determining this sequential neurogenesis. Several models could be invoked to explain these findings. In one extensively investigated model, the genes that encode neuronal specification proteins are turned on when a particular neuronal subtype is being generated and then are rapidly turned off when that subtype is no longer made (reviewed inKwan et al., 2012; Greig et al., 2013). Here we provide evidence for a second, not mutually exclusive model in which RPs are transcriptionally primed to make diverse cortical neuron subtypes and post-transcriptional mechanisms select when and where neuronal specification mRNAs are translated.
The conclusion that RPs are transcriptionally primed to generate diverse cortical neurons comes from the scRNA-seq and FISH analyses. These studies indicate that RPs co-express mRNAs encoding deep and superficial layer specification pro-teins throughout the neurogenic period. Although there are fewer precursors co-expressing superficial and deep layer mRNAs at E17.5, the end of neurogenesis, there are nonetheless still many RPs and even newborn neurons with this mixed transcrip-tional phenotype. Precedent for this type of transcriptranscrip-tional prim-ing comes from embryonic stem cells (Efroni et al., 2008) and makes biological sense from several perspectives. First, neuro-genesis occurs within a short time frame, and a switch from making one to another neuronal subtype could occur more rapidly if the mRNAs were already present and simply needed to be derepressed. Second, transcriptional priming would allow
fast extrinsic regulation of neuronal specification and, thus, pro-vide flexibility within a rapidly changing environment. Third, this model provides a mechanism for rapidly turning protein expres-sion off, as exemplified by our data showing that, in the absence of 4E-T and/or Pum2, deep layer specifiers are aberrantly trans-lated during superficial layer neurogenesis. These studies do not preclude an important role for transcriptional regulation but, instead, provide evidence for an additional regulatory layer that acts to ensure appropriate neuronal specification. These find-ings are also consistent with previous reports showing that
Fezf2 mRNA persists in the VZ long after deep layer neurons
have been generated (Guo et al., 2013), Cux2 mRNA is ex-pressed in the VZ before superficial layer neurons are made (Nieto et al., 2004; Guo et al., 2013), and Ctip2 protein is only observed in postmitotic subcerebral neurons, whereas Ctip2 mRNA is expressed in cortical precursors (Leid et al., 2004; Arlotta et al., 2005).
Our findings raise a number of key questions. One of these in-volves the precise molecular nature of the translational repres-sion complexes. In particular, our work defines a Pum2/4E-T complex that represses mRNAs regulating both the timing and specificity of neurogenesis (this study;Yang et al., 2014). How-ever, many specification mRNAs that are expressed in RPs were not immunoprecipitated with Pum2 and, thus, are likely silenced by other RNA binding proteins and/or microRNAs. Moreover, the Pum2 and 4E-T target mRNAs were only partially overlapping, indicating other protein partners for both of these translational repressors. In this regard, we recently showed that the RNA binding protein Smaug2 interacts with 4E-T in RPs to repress translation of the proneurogenic protein Nanos1 (Amadei et al., 2015).
A second key issue involves the association/dissociation of target mRNAs with Pum2/4E-T complexes. In this regard, both 4E-T and Pum2 are known phosphoproteins, Pumilio pro-teins are phosphorylated in response to growth factors like EGF (Kedde et al., 2010), and phosphorylation regulates Pum-ilio activity (Ota et al., 2011). Because embryonic cortical RPs are exposed to many growth factors that regulate neurogene-sis (for example, seeYuzwa et al., 2016), then we propose that environmentally driven signaling cascades directly regulate mRNA interactions with Pum2/4E-T complexes. However, simple phosphorylation-based models may not be sufficient to explain selective complex association with target mRNAs. For example, more than half of Brn1 mRNA, but only 20% of
Tle4 mRNA, is complexed with 4E-T and Pum2 in E12 apical
RPs. We believe that this selective association is likely mediated by other, still undefined proteins associating with Pum2, 4E-T, and/or the mRNAs themselves, in agreement with recent data showing that many RNA-binding proteins and components of the translational machinery are expressed and differentially regulated across cortical neurogenesis (DeBoer et al., 2013).
(G) Representative confocal images of electroporated sections immunostained for EGFP (green), Tle4 (red), and Brn1 (turquoise). Boxed regions are shown at higher magnification on the right, with the color channels shown individually. Nuclei are outlined with hatched white ovals, as defined by nuclear EGFP. (H–J) Quantification of sections as in (G) for the percentage of EGFP-positive cells expressing Brn1 (H), Tle4 (I), or both Brn1 and Tle4 (J) in either the entire cortex (Total Cortex) or in the SVZ, IZ, and CP (Excluding VZ). ***p < 0.001, ns = p > 0.05; n = 3 embryos each, 3 sections per embryo.
Our findings raise one final important question. How long does this transcriptional flexibility persist? Our data show that RPs continue to express neuronal specification mRNAs after
neuro-genesis is complete and that some postnatal neurons express specification mRNAs for diverse neuronal phenotypes when they have already ‘‘chosen’’ a single identity at the protein level.
B C D A
%B
rn
1+
/E
G
FP
+
0
20
40
60
80
100
ns%T
le
4+
/E
G
FP
+
0
5
10
15
20
**
shCtrl
sh4E-T
%Brn
1+
Tl
e4+
/E
GFP
+
0
5
10
15
20
**
EGFP
/
Tle4
/
Brn1
shCtrl
sh4E-T
CP CP CP CPsh4E-T
Brn1+ Tle4+ Brn1+shCtrl
VZ SVZ IZ CP 0 10 20 30 40 %E G FP + Cel lsControl
CBP Phosphomimic (S436D)
**
*
E%Brn
1+
/E
G
FP
+
0
20
40
60
80
100
ns FControl
CBP Phosphomimic (S436D)
0
5
10
15
20
%T
le
4+
/E
G
FP
+
ns0
5
10
15
20
%Brn
1+
Tl
e4+
/E
GFP
+
ns GshCtrl
shPum2
sh4E-T
0
10
20
30
%T
le
4+
/E
G
FP
+
**
**
nsns%B
rn
1+
/E
G
FP
+
0
20
40
60
80
0
10
20
30
%Brn
1+
Tl
e4
+
/E
GFP
+
**
***
H I J ns nsVZ/SVZ
VZ/SVZ
VZ/SVZ
Figure 7. 4E-T Regulates Translation of Brn1 and Tle4 mRNAs during Neurogenesis
(A) E13/E14 cortices were co-electroporated with a nuclear EGFP plasmid and control (shCtrl) or 4E-T (sh4E-T) shRNA, and coronal cortical sections were analyzed 3 days later by immunostaining for EGFP (green), Brn1 (turquoise), and Tle4 (red). Boxed regions are shown at higher magnification on the right, where the different color channels are separated.
(B–D) Quantification of images as in (A) for the percentages of total EGFP-positive cells that were also positive for Brn1 (B), Tle4 (C), or both Brn1 and Tle4 (D). **p < 0.01, ns = p > 0.05; n = 3 embryos each, 3 sections per embryo.
(E–G) E13/E14 cortices were co-electroporated with a nuclear EGFP plasmid and an expression construct for CBP S436D or the empty vector (control), and coronal cortical sections were immunostained 3 days later for EGFP, Brn1 and Tle4.
(E) Quantification of the percentage of EGFP-positive cells that were in each of the cortical regions. *p < 0.05, **p < 0.01, ns = p > 0.05; n = 3 embryos each, 2–3 sections per embryo.
(F and G) Quantification of the percentages of total EGFP-positive cells that were positive for either Brn1 or Tle4 (F) or for both Brn1 and Tle4 (G). ns R 0.05; n = 3 embryos each, 2–3 sections per embryo.
(H–J) E13/E14 cortices were co-electroporated with a nuclear EGFP plasmid and control (shCtrl), Pum2 (shPum2), or 4E-T (sh4E-T) shRNA, and coronal cortical sections were analyzed 2 days later by immunostaining for EGFP, Brn1, and Tle4 (Figures S6E and S6F). Confocal images of these sections were then quantified for the percentages of total EGFP-positive cells in the VZ/SVZ that were also positive for Brn1 (H), Tle4 (I), or both Brn1 and Tle4 (J). **p < 0.01, ***p < 0.001, ns = p > 0.05 by one-way ANOVA with Dunnett’s multiple comparisons test; n = 3 embryos each, 2 sections per embryo.
A E
Brn1+ Brn1+
Ctip2+
EGFP
Merge
Brn1
Ctip2
shCtrl shPum2
EGFP
/
Brn1
/
Ctip2
shCtrl
shPum2
CP IZ CP IZ J D %C tip 2+ /E G FP + 0 5 10 15 20 25***
*
Excluding VZ Total Cortex %B rn1 +C tip 2+ /E GFP + 0 5 10 15 20 25***
*
Excluding VZ Total Cortex C %B rn 1+ /E G FP+ 0 20 40 60 80 ns ns Excluding VZ Total CortexEGFP
Merge
Tbr2
Ctip2
Tbr2-Ctip2+
EGFP
/
Tbr2
/
Ctip2
shPum2
SVZ IZ SVZ IZBrn1+ Brn1+
Tbr1+
EGFP
Merge
Tbr1
Brn1
shCtrl shPum2
EGFP
/
Tbr1
/
Brn1
shCtrl
shPum2
CP IZ CP IZ BshPum2
shCtrl
0
**
5
10
15
20
25
% Tbr1 +/ EGFP +0
5
10
15
20
%Brn1+T br 1+ / EGFP+**
F G0
5
10
15
20
%F ox P2 +/ EGFP+**
0
5
10
15
20
%Brn1+F ox P2 +/ EGFP+***
H IshPum2
shCtrl
EGFP
/
FoxP2
/
Brn1
shCtrl
sh4E-T
CP
CP
CP
CP
**
0
5
10
15
20
%F ox P2 +/ EGFP+ L**
0
5
10
15
20
%B rn1+ Fo xP 2+/ EGFP + MBrn1+
Brn1+ FoxP2+
EGFP
Merge
FoxP2
Brn1
shCtrl
sh4E-T
Ksh4E-T
shCtrl
sh4E-T
shCtrl
shPum2
shCtrl
shPum2
shCtrl
shPum2
shCtrl
shPum2
shCtrl
These findings may thus reflect a general developmental flexi-bility with regard to neurogenesis and neuronal phenotypes and may even provide a partial explanation for the ability to reprogram perinatal cortical neurons from one subtype to another with single transcription factors such as Fezf2 (Rouaux and Arlotta, 2013). This type of transcriptional priming may thus reflect a general cellular strategy where post-transcriptional repression mechanisms provide an important way to ensure appropriate differentiation within a rapidly evolving developing environment.
STAR+METHODS
Detailed methods are provided in the online version of this paper and include the following:
d KEY RESOURCES TABLE
d CONTACT FOR REAGENT AND RESOURCE SHARING d EXPERIMENTAL MODEL AND SUBJECT DETAILS
B Mice
B Primary cell cultures and transfections d METHOD DETAILS
B Plasmids
B In utero electroporation B Antibodies
B Immunostaining and histological analysis B Protein immunoprecipitation and immunoblotting B RNA immunoprecipitation (RIP) and microarray
analysis B PCR
B Pum2 motif prediction and knockdown analysis B Fluorescence in situ hybridization (FISH) B Proximity ligation assay (PLA)
B Single-cell RNA sequencing (scRNAseq) d QUANTIFICATION AND STATISTICAL ANALYSIS
B Microscopy and quantification B Statistics
d DATA AND SOFTWARE AVAILABILITY
SUPPLEMENTAL INFORMATION
Supplemental Information includes seven figures and five tables and can be found with this article online athttps://doi.org/10.1016/j.neuron.2017.12.045. ACKNOWLEDGMENTS
This work was funded by CIHR grants and the CFREF ‘‘Medicine by Design’’ (to F.D.M. and D.R.K.) and by an EU FP7 Marie Curie grant (to H.K.). F.D.M. is a Canada Research Chair and was an HHMI Senior International Research Scholar during the course of this work. S.K.Z. was funded by a CIHR M.D./ Ph.D. studentship, G.Y. by a Brain Canada Mental Health fellowship and an HSC Restracomp/CBMH fellowship, S.A.Y. by OIRM and Lap-Chee Tsui HSC Restracomp postdoctoral fellowships, M.J.B. by an NSERC Masters stu-dentship, and A.V. by CIHR, MSSOC, and HSC Restracomp postdoctoral fel-lowships. We thank Sarah Burns and Dennis Aquino for technical assistance, Stefano Stifani for the Tle4 antibody, John Vessey for the Pum2 shRNA, and Jing Wang for the CBP phosphomimic expression plasmid.
AUTHOR CONTRIBUTIONS
S.K.Z. conceptualized, designed, performed, and analyzed most of the experiments and co-wrote the paper. G.Y. conceptualized, performed, and analyzed the RIP/microarray experiments and contributed to the qRT-PCR, FISH, culture, and co-immunoprecipitation experiments. H.K. analyzed and validated the RIP experiments. S.A.Y. and M.J.B. performed and analyzed the scRNA-seq experiments, and M.J.B. participated in the FISH analysis. A.V. performed and analyzed the qPCRs. D.R.K. conceptualized experiments and co-wrote the paper. F.D.M. conceptualized and designed experiments, analyzed data, and co-wrote the paper.
DECLARATION OF INTERESTS The authors declare no competing interests. Received: August 18, 2017
Revised: November 22, 2017 Accepted: December 28, 2017 Published: January 25, 2018 REFERENCES
Amadei, G., Zander, M.A., Yang, G., Dumelie, J.G., Vessey, J.P., Lipshitz, H.D., Smibert, C.A., Kaplan, D.R., and Miller, F.D. (2015). A Smaug2-based
Figure 8. Pum2 and 4E-T Are Important for Repressing a Deep Layer Neuron Phenotype in Newborn Superficial Layer Neurons
(A–J) E13/E14 cortices were electroporated with a nuclear EGFP plasmid and Pum2 (shPum2) or control (shCtrl) shRNA, and coronal cortical sections were immunostained 3 days later at E16/E17.
(A and B) Representative confocal images of electroporated sections immunostained for EGFP (green, both), Brn1 (red in A; turquoise in B), and either Ctip2 (turquoise; A) or Tbr1 (red; B). Boxed regions are shown at higher magnification on the right, with the color channels shown individually. Nuclei are outlined with hatched white ovals, as defined by nuclear EGFP.
(C–G) Quantification of sections as in (A) and (B) for the percentages of EGFP-positive cells expressing Brn1 (C), Ctip2 (D), Brn1 and Ctip2 (E), Tbr1 (F), or Brn1 and Tbr1 (G) in either the entire cortex (Total Cortex) or in the SVZ, IZ, and CP (Excluding VZ). *p < 0.05, **p < 0.01, ***p < 0.001, ns = p > 0.05; n = 3 embryos, 3 sections per embryo.
(H and I) Quantification of electroporated sections immunostained for EGFP, Brn1, and FoxP2 (Figure S7) for the percentages of total EGFP-positive cells ex-pressing FoxP2 (H) or Brn1 and FoxP2 (I). **p < 0.01, ***p < 0.001; n = 3 embryos, 3 sections per embryo.
(J) Representative confocal images of an electroporated section immunostained for EGFP (green), Tbr2 (red), and Ctip2 (turquoise). The boxed region is shown at higher magnification on the right, with the color channels shown individually. The nucleus of an EGFP-positive, Ctip2-positive, Tbr2-negative cell is outlined with hatched white ovals, as defined by nuclear EGFP.
(K–M) E13/E14 cortices were electroporated with a nuclear EGFP plasmid and 4E-T (sh4E-T) or control (shCtrl) shRNA, and coronal cortical sections were analyzed 3 days later.
(K) Representative confocal images of sections immunostained for EGFP (green), Brn1 (blue), and FoxP2 (red). Boxed regions are shown at higher magnification at the bottom, with the color channels shown individually. Nuclei are outlined with hatched white ovals, as defined by nuclear EGFP.
(L and M) Quantification of sections as in (K) for the percentages of total EGFP-positive cells expressing FoxP2 (L) or Brn1 and FoxP2 (M). **p < 0.01; n = 3 embryos, 3 sections per embryo.