T.C.
ISTANBUL AYDIN UNIVERSITY INSTITUTE OF SOCIAL SCIENCES
MEASURING FINANCIAL PERFORMANCES VIA TOPSIS AND GREY ANALYSIS; IRON & STEEL SECTOR EXAMPLES
MASTER THESIS
FADİME SARGUT
BUSINESS ADMINISTRATION DEPARTMENT MASTER PROGRAM
THESIS ADVISOR
ASISTANT. PROF. DR. ÖZGE EREN
T.C.
ISTANBUL AYDIN UNIVERSITY INSTITUTE OF SOCIAL SCIENCES
MEASURING FINANCIAL PERFORMANCES VIA TOPSIS AND GREY ANALYSIS; IRON & STEEL SECTOR EXAMPLES
MASTER THESIS Y1512.130093 FADİME SARGUT
BUSINESS ADMINISTRATION DEPARTMENT MASTER PROGRAM
THESIS ADVISOR
ASISTANT. PROF. DR. ÖZGE EREN
iii
DECLARATION
I hereby declare that this master’s thesis titled as “MEASURING FINANCIAL PERFORMANCES VIA TOPSIS AND GREY ANALYSIS; IRON & STEEL SECTOR EXAMPLES ” has been written by myself in accordance with the academic rules and ethical conduct. I also declare that all materials benefited in this thesis consist of the mentioned resources in the reference list. I verify all these with my honor.
(12/01/2018)
FADİME SARGUT
v
ACKNOWLEDGEMENT
I would first like to express gratitude to GOD for giving me the strength, patience and courage to complete this study.
I would like to express my gratitude to Asistant. Prof. Dr. Özge Eren and Asistant. Prof. Dr. Çiğdem Özarı.
Furthermore, I thank to Asistance. Prof. Dr. Özge Eren for her valuable comments throughout my study and continuous help, her patience to me.
I would also like to thank everyone who separate their time to me for help me.
I would like to thank chartered accountants Mustafa Kaşif and Aysen Bayrak Şahinoğlu.
I would like to thank my mum and my closer mate Nilay Türkmen.
vii
LIST OF CONTENTS
Page
LIST OF CONTENTS ... vii
LIST OF TABLES ... ix LIST OF FIGURE ... xi ABBREVATIONS ... xiii ABSTRACT ... xv ÖZET ... xvi 1. INTRODUCTION ... 1
2. FINANCIAL TABLE ANALYSIS ... 3
2.1. Financial Analysis Concept ... 3
2.2. Financial Tables Analysis ... 3
2.2.1. Balance Sheet ... 4
2.2.2. Income Statement ... 5
3. FINANCIAL TABLE ANALYSIS TECHNIQUES ... 7
3.1. Comparative Financial Tables Analysis ... 7
3.2. Trend Analysis ... 8
3.3. Ratio Analysis ... 8
3.4. DuPont Analysis ... 14
3.5. Vertical Analysis ... 14
4. MULTI CRITERIA DECISION MAKING (MCDM) METHODS ... 17
4.1. TOPSIS (Technique for Order Preference by Similarity to Ideal Solution) ... 18
4.2. PROMETHEE (The Preference Ranking Organization Method for Enrichment Evaluation) ... 22
4.3. ELECTRE (Elemination and Choice Translating Reality English) ... 24
4.4. AHP (The Analytic Hierarchy Process) ... 25
viii
5. INVESTIGATION OF IRON AND STEEL TRADED IN ISE (ISTANBUL
STOCK EXCHANGE) ... 31
5.1. Ereğli Iron & Steel Ratio Analysis ... 31
5.2. Kardemir Iron & Steel Inc.’s Ratio Analysis ... 36
5.3. Performance Analysis in Financial Tables by TOPSIS Method ... 39
5.4. Performance Analysis in Financial Tables by GRA ... 51
5.5. Comparison of Results of TOPSIS and GRA Methods ... 60
6. CONCLUSION ... 63
REFERENCES ... 66
APPENDIX ... 73
Appendix-1. Ereğli Iron & Steel Inc. 2011-2016 Financial Data Period ... 73
Appendix-2. Ereğli Iron & Steel Inc. Ratio Analysis (2011-2016) ... 76
Appendix-3. Kardemir Iron & Steel Inc. 2011-2016 Financial Data Period ... 77
Appendix-4. Kardemir Iron & Steel Inc. Ratio Analysis (2011-2016) ... 80
ix
LIST OF TABLES
Page
Table 5.1: Performance Criteria ... 40
Table 5.2:Values of Performance Variables by Years ... 41
Table 5.3: Standard Decision Matrix ... 43
Table 5.4: Normalized Decision Matrix ... 44
Table 5.5: Weighted Standard Decision Matrix ... 46
Table 5.6:Positive and Negative Ideal Solution Set (P + & P-) ... 48
Table 5.7: The closeness to positive and negative ideal solution cluster ... 49
Table 5.8: TOPSIS Ranking ... 50
Table 5.9: Reference Series ... 52
Table 5.10: Normalize Data Matrix ... 54
Table 5.11: Absolute Value Matrix ... 56
Table 5.12: GIA Coefficient Matrix ... 58
Table 5.13: GRA Order ... 59
Table 5.14: GRA Performance Ranking ... 60
Table 5.15: TOPSIS and GRA Comparison-1 ... 61
xi
LIST OF FIGURE
Page
Figure 4.1: Supplier Selection Process ... 18
Figure 4.2: Grey Relational Analysis Process ... 27
Figure 5.1: Ereğli Iron & Steel Inc.’s Liquidity Ratio ... 31
Figure 5.2: Ereğli Iron & Steel Inc.'s Financial Structure Ratios ... 32
Figure 5.3: Ereğli Iron & Steel Inc’s Operating Ratios ... 34
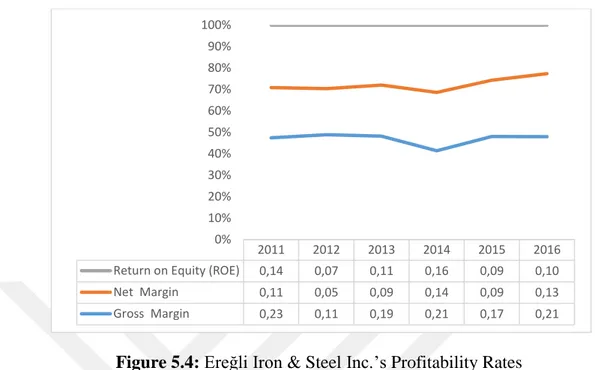
Figure 5.4: Ereğli Iron & Steel Inc.’s Profitability Rates ... 35
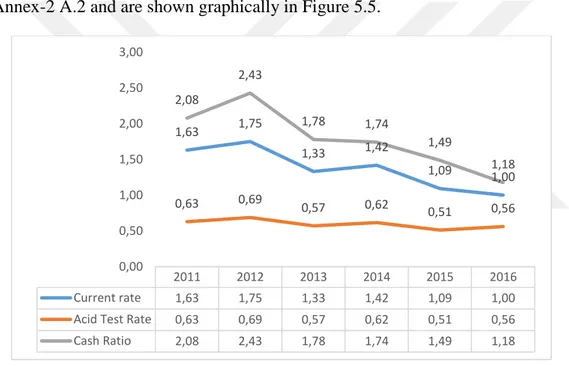
Figure 5.5: Kardemir Iron & Steel Inc.’s Liquidity Ratios ... 36
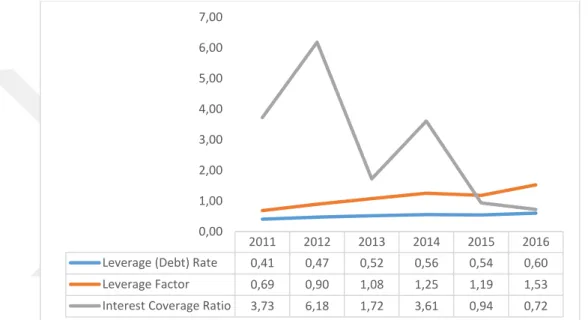
Figure 5.6: Kardemir Iron & Steel Inc.’s Financial Structure Rates ... 37
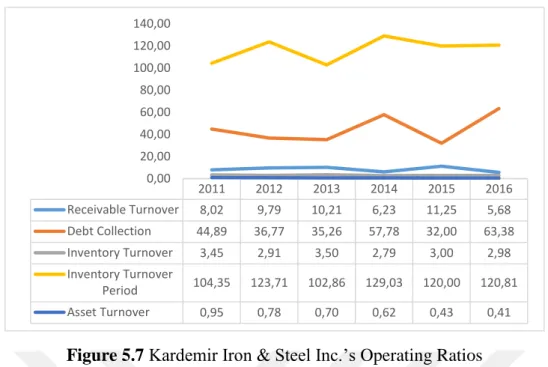
Figure 5.7 Kardemir Iron & Steel Inc.’s Operating Ratios ... 38
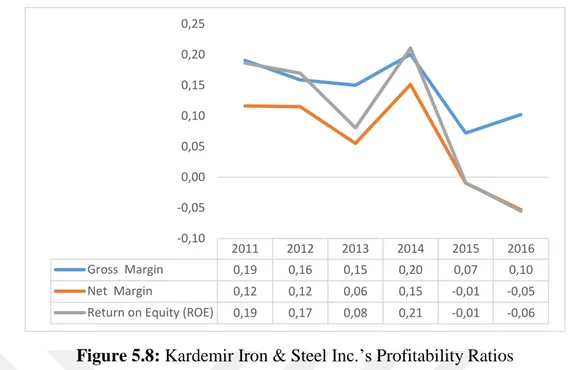
Figure 5.8: Kardemir Iron & Steel Inc.’s Profitability Ratios ... 39
Figure 5.9: TOPSIS Ranking ... 51
xiii
ABBREVATIONS
AHP : Analytical Hierarchy Process
ELECTRE : Elemination and Choice Translating Reality English GAIA : Geometrical Analysis for Interactive Aid
GRA : GrayRelationship Analysis
GST : The Gray System Theory
MAX : Maximum
MCMM : Multi Criteria Decision Making
MDMM : Multicriteria Decision Making Methods
MIN : Minimum
PROMETHEE : The Preference Ranking Organization Method for Enrichment Evaluation
ROE : Return on Equity
TOPSIS : Technique for Order Preference by Similarity to Ideal Solution
xv
MEASURING FINANCIAL PERFORMANCES VIA TOPSIS AND GREY ANALYSIS; IRON & STEEL SECTOR EXAMPLES
ABSTRACT
Financial analysis is based on an examination of the relationship between the balance sheet items and income statement that make up the fund structure of the business to determine the extent to which the financial equilibrium has been met and to ensure that rational decisions are taken accordingly.
The purpose of this study is to demonstrate the applicability of Multi-Criteria decision making techniques in financial statement analysis. In the first part of this study, the Financial Tables analysis will be mentioned. In the second part, the types and uses of financial analysis techniques will be discussed. In the third chapter, multi criteria decision making techniques will be mentioned and also in this section, the five most common methods will be mentioned. In the last part, 2011-2016 balance sheet data of Ereğli Iron & Steel Inc. and Kardemir Iron & Steel Inc. will be evaluated with the help of financial analysis techniques.In this context, the financial statements of the two firms were analysed by ratio analysis, one of the financial analysis techniques. In the second stage, the results of the ratios analysis were analyzed using multi criteria decision making techniques. In this context, TOPSIS and GRA methods were utilized.
xvi
İDEAL ÇÖZÜME BENZERLİK BAKIMINDAN SIRALAMA
PERFORMANSI TEKNİĞİ VE GRİ İLİŞKİSEL ANALİZİ İLE FİNANSAL PERFORMANSLARIN ÖLÇÜLMESİ; DEMİR VE ÇELİK SEKTÖRÜ
ÖRNEKLERİ ÖZET
Finansal analiz, finansal dengenin ne derece karşılandığını belirlemek ve rasyonel kararların uygun şekilde alınmasını sağlamak için, şirketin fon yapısını oluşturan bilanço kalemleri ile gelir tablosu arasındaki ilişkinin incelenmesine dayanmaktadır. Bu çalışmanın amacı çok kriterli karar verme tekniklerinin mali tablolar analizinde uygulanabilirliğini göstermektir.
Çalışmanın ilk bölümünde Mali Tablolar analizinden bahsedilecektir. İkinci bölümünde, finansal analiz tekniklerinin türleri ve kullanımı tartışılacaktır. Üçüncü bölümde çok kriterli karar verme tekniklerinden bahsedilerek bu bölümünün en sık kullanılan beş yöntemden bahsedilecektir. Son bölümde Ereğli Demir ve Çelik A.Ş ve Kardemir Karabük Demir Çelik Sanayi ve Ticaret A.Ş. nin 2011-2016 yıllarının bilançosu verileri mali analiz teknikleri yardımıyla değerlendirilecektir. Bu bağlamda, iki firmanın finansal tabloları, finansal analiz tekniklerinden biri olan oran analizi ile analiz edilmiştir. İkinci aşamada da, oran analizde çıkan değerlerin çok kriterli karar verme tekniklerinde kullanarak analiz edilmiştir. Bu bağlamda TOPSIS ve GRA yöntemleri kullanılmıştır.
1
1. INTRODUCTION
Financial analysis is to determine the extent to which the financial balance has been met and to ensure that rational decisions are taken accordingly by examining the relationship between balance sheet items and income statement that constituting the fund framework of the company (Mucuk, 2001:329).
Financial analysis will be use obtained by applying analysis techniques to accounting information and interpreted to understand the financial position of the company and its operating results.
Effective execution of sound decision making, planning and supervision functions in enterprises makes it necessary to perform financial analysis on a regular basis.For this reason, among the most important responsibilities of business managers is the measurement and analysis of financial performance.
Business manager should know that is necessary what data will accurately reflect the performance of the business, how they can be collected, and how the collected data should be assessed.A responsible managers that if the performance is not satisfactory, it should take measures to make it possible to achieve a higher performance expected. Among the main questions a business manager should ask himself, what the current financial status of the entity is and to make the financial capacity of the business is enough or not to enter a price war with rivalries, and also there are questions such as whether the company has performed well ın the last period or whether the financial performance of the business lags behind the competitors in the market (Acar, 2003). Financial Analysis is done on the financial tables. Balance sheet and income table are basic financial statements of the business. There are several types of analysis that are commonly used to perform financial analysis in the accounting process; these are the main and most used ones; Comparative Table Analysis, Vertical Analysis, Trend Analysis, Ratio Analysis and DuPont Analysis. Only Ratio analysis will be used in the analysis section of this study.
2
The purpose of this study is to demonstrate the applicability of Multi-Criteria decision making techniques in financial statement analysis.
In the first part of this study, the Financial Tables analysis will be mentioned. In the second part, the types and uses of financial analysis techniques will be discussed. In the third chapter, multi criteria decision making techniques will be mentioned and also in this section, the five most common methods will be mentioned. In the last part, 2011-2016 balance sheet data of Ereğli Iron & Steel Inc. and Kardemir Iron & Steel Inc. will be evaluated with the help of financial analysis techniques.
In this context, the financial statements of the two firms were analysed by ratio analysis, one of the financial analysis techniques. In the second stage, the results of the ratios analysis were analyzed using multi criteria decision making techniques. In this context, TOPSIS and GRA methods were utilized.
3
2. FINANCIAL TABLE ANALYSIS
In order for the information on the financial tables to be used by the users in the best possible manner, these tables need to have certain characteristics. These features are: financial statements must be understandable, appropriate, reliable, and comparable and should be organized on time.
2.1. Financial Analysis Concept
Financial Analysis can be defined as the examination of the changes in financial statement items, the relations between items and the trends they have shown over time and the whole activities of its interpretation by comparing. It with the standard and sector average determined when necessary in order to determine whether an enterprise's financial situation and financial development is sufficient.
2.2. Financial Tables Analysis
Financial Analysis is a process on financial statements. The main financial tables of the enterprises are balance sheet and income table. For this reason, the concept of financial analysis must be mentioned in the balance sheet and income table. This topic will be discussed in detail in the balance sheet and income table.
The comparatives of between the various items in the financial statements are defined by means of percentages , ratios and the measurement and interpretation of these relations. With this analysis, it will be tried to determine what the connections are and what factors play a role in the changes, and it will be predicted where the company will go in time. It is possible to list the principal methods of analysis as follows; Analysis of Comparative Tables (Horizontal Analysis), Vertical Analysis (Analysis by Percentage Method), Analysis by Trend Percentage Method (Trend Analysis), Ratio Analysis (Ratio Analysis). These analytical techniques will be discussed in detail in Chapter 3.
4
2.2.1. Balance Sheet
A balance sheet is a chart showing an entity’s financial situation at a certain point. It is meant by the financial situation is the monetary size of the assets owned by the entity and the resources provided by the assets.
Assets from balance sheet items are classified as Current Assets and Non-Current Assets. Assets from balance sheet items are account groups in each class and accounts in these account groups and account (balance sheet items) in these account groups. Therefore, there is a relationship between the balance sheet items used in the balance sheet arrangement and the accounts and it is necessary to have an account plan for balance sheet arrangement. The Uniform Chart of Accounts in the Uniform Accounting System in Turkey covers all balance sheet items that should be shown in the balance sheet. The balance sheet is drawn up with the remainder of the account on the balance sheet date of the accounts included in this account plan.
The balance sheet is examined in five groups. These; Current Assets, Non-Current Assets, Short Term Liabilities, Long Term Liabilities and Equities.
Current Assets: All of the possible values that the business can freely spend and the money in the bank will be turning to cash within one year can be called as current assets. Current assets; cash and cash equivalents, marketable securities, trade receivables, other short-term receivables, inventories. Expense and income accruals and other current assets. In the analysis, the total of current assets is called gross working capital. Gross working capital is used to carry out day to day operations such as acquisitions, production, maintenance and repairs, sales, and to payed short-term debts.
Non-Current Assets: The values that are to be used in business activities for more than one year, even those that are not considered to be converted into money for a year or that cannot be converted into money are called non-current assets. Non-current assets; long-term trade and other receivables, financial assets, tangible assets, intangible assets, assets subject to special consumption, future years expenses and income accruals and other non-current assets.
Short Term Liabilities: Debt to be paid within one year is called short term liabilities.However, it is a fact that these debts are to be compensated from the current assets. The Company’s financial liabilities, trade payables, other
5
liabilities, advances received, taxes and other legal liabilities to be paid, liability and expense provisions, future income accruals and expense accruals and other short term liabilities constitute the short term liabilities group.
Long Term Liabilities: Longer term liabilities of a business than one year are called long term liabilities. It is expected that long-term liabilities will be met from the values that will come out of non-current assets in business. Long-term financial liabilities of the business, trade debts, other debts, advances received taxes payable and other liabilities, provisions for liabilities and expenses, income and expense accruals for the future years and other long term liabilities.
Equities: Equity consists of operating capital and period profits and reserves. Equities come from paid capital, capital back-ups, profit back-ups, period profit or loss items.
The equity refers to the ownership of the entity’s owners or partners on the assets and does not place any financial burden, such as interest. It is to be expected that equities in an enterprise will be at least equal to short term liabilities and long term liabilities.This also ensures the safety of buyers. Term losses in equity past years losses are undesirable items.The size of them means that the capital is destroyed.
2.2.2. Income Statement
The income statement is a financial statement showing the entity’s operating results for a particular operating period.The income statement shows all the income the entity has earned in a given period and all the costs and expenses incurred in obtaining such income. The net profit for the period or net loss for the period that the entity obtains is included in the income statement.
The balance sheet refers to a specific moment, in other words, the date on which the balance sheet is adjusted, and the remaining balance sheet accounts on that date. Income statement shows the sum of the accounts traded, while expressing a certain period at time. In other words, the accounts that make up the income table do not give any account remuneration at the date when the income statement was issued.
6
As in the balance sheet, the Uniform Chart of accounts in the Uniform Chart of Accounts is used in the income statement and the income statement is grouped according to the income statement accounts included in this account plan.
Gross Sales Profit or Loss: Gross sales profit or loss relates to the main activity area of the business and indicates the success of the business in its main activity. In the gross sale profit or loss, the revenues incurred for these are deducted from the costs related to the essential activity. However, operating expenses have not yet been reduced. The gross sales profit or loss group includes gross sales, sales discounts, net sales, and the cost of sales.
Operating Profit or Loss: Operating profit or loss arises from the difference between gross sales profit or loss and operating expenses, and is the result of the entity’s net profit or loss on its core business. It is important to measure the success of the business in its core business.
Ordinary Profit or Loss: The profit or loss that the entity derecognizes from its activities other than its core business or the result of adding the expense losses is called ordinary profit or loss. Positive results are profit, negative results are damages. According to the Uniform Accounting System, financing costs are separately presented from ordinary profit or loss; if the profit is deducted, if there is a loss, it is added.
Period Profit or Loss: We have already mentioned the extraordinary income and profits, expense and losses that may arise outside the main activities of the business and its main activities.The period profit or loss is calculated by adding to the ordinary profit or loss of the enterprise, adding extraordinary income and profit, or by deducting extraordinary expenses and losses.
7
3. FINANCIAL TABLE ANALYSIS TECHNIQUES
There are several types of analysis that are commonly used to perform financial analysis in the accounting process; these are the main and most used ones (Çetiner,2007:7);
Comparative Table Analysis
Trend Analysis
Ratio Analysis
DuPont Analysis
Vertical Analysis
3.1. Comparative Financial Tables Analysis
Financial statements of an entity for more than one period are prepared comparatively. These tables can be arranged in two period or can be edited by comparing more than two period. The tables prepared in this way allow the entity to see past and current financial position and to identify the differences (increase and decrease) of the current financial position from past years. It can also be found inferences about the future financial situation in this way (Yurdakul, 2006:251).
Important information is obtained about the developments of economic and financial structure, profitability, productivity of the enterprise. The greatest advantage of comparative analysis is that it is considered to be a good indicator of the direction of development of the investigated enterprise. An examination of the changes in the items in the financial tables is important to show that the business and its financial characteristics are developing in which direction. A comparative analysis is also useful for estimating the future development of the enterprise. As long as there are no major changes to the conditions, it is expected that the business will have a favourable development in the past (Oztin, 2002:347).
8
The balance sheet and income table information of the business for several periods are arranged side by side and compared. The increases and decreases in the items are calculated as percentages.
Difference: Current period-Previous period
Percent: (Current period-Previous period) / Previous Period *100
3.2. Trend Analysis
A vertical percentage analysis is performed to examine the proportional size of a total or group within a financial table of a certain period. Trend analysis is determine of the tendency of equal and much longer periods of time. Thus company, it can be seen how the asset’s productivity, debt tendency, equity chance, profitability increase or decrease, and so on over the years as it has been for as long as 8-10 years, and also policies are created accordingly.
In this analysis method, one of the years to be compared is selected as the base year, and the sum of this year is accepted as 100. It is indexed to base year on other years and the increase or decrease is shown as a percentage of the basic year. Long-term development of the business is being studied since the comparative analysis over the years provides for dynamic analysis (Penman, 2012 :316-317; Clemenson ve Sellers, 2013 :257; Toroslu and Durmuş, 2013:80).
The choice of the base year is very important. The base year should be a completely normal year, with no extraordinary traits. A significant year should not be selected as a result of the assessment of profits or crisis in a year when profits are very high or when business’ sector and the country as a whole are in crisis in a year. Otherwise, comparisons will be unhealthy. In addition, year to be compared should be free of inflation (Omag, 2014).
3.3. Ratio Analysis
An examination of the relationship between the items in the balance sheet and the income statement. The comparison of these relationships with previous years and other enterprises in that business type (Cetiner, 2002:138).
9
Significant relationships between the items in the financial statements are expressed as either percentages or multiple times. By establishing mathematical relations between account and account groups, it is tried to reach a judgment on the economic and financial structure, profitability and working situation of the enterprise. The ratio is accepted as a simple mathematical expression of the relationship between two items. In this analysis method calculation of ratios is not enough alone. It is considered important that the ratio, which are a financial instrument by the authorities, are assessed and interpreted in conjunction with the objectives of the enterprise (Akdoğan, 2007:640).
The ratios can be sorted according to their usage as follows (Erdogan, 1997): Rates used in the analysis of the liquidity situation,
Rates used in the analysis of the financial structure, Rates used in the analysis of the operating ratio, Rates used in the analysis of the profitability situation.
Acid-Test Ratio: Represents the ratio of current assets without stock to short-term foreign assets. Stock is ignored in the calculation of this ratio, so stock items need more time to be sold and turned into money than other current assets (Evin, 2014).
Acid-Test Ratio = (Current Assets - Stocks - Other Current Assets) / Short Term Liabilities
It is considered sufficient that the result of the acid test ratio is 1. So, assets that are return without selling the inventory of the company are required to be at a level where they can pay short-term debts.
The Current Rate: Current rate is calculated by dividing the gross operating capital (current assets) necessary for the companies to continue their operations into short term debts. The current rate indicates the adequacy of the net business capital and the debt paying capacity. However, it is more accurate to evaluate it together with net business capital change. The increase in net business capital is not a sign of increased debt pay-out capacity of the company. Current ratio may decrease if short-term debt is increased from current assets. In addition, the quality of current assets (to find the real value when the sale is
10
made) should be taken into account when assessing the current rate (Evin, 2014).
Current Ratio = Current Assets / Short Term Liabilities
The current ratio result is 2 considered sufficient. In short, it is desirable that the aggregate current assets of the business have more than doubled from short-term liabilities.
The Cash Ratio: Cash ratio is a measure of how much of the short-term debt of an entity's ready value can be met (Evin, 2014).
Cash Ratio = (Current Assets-Trade Receivables + Inventories) / Short Term Liabilities
It is desirable that the cash rate should not fall below 0.20. Otherwise it puts the business into cash tightness, while a large proportion is a sign that the business does not plan its cash well and cannot use it.
Leverage (Debt) Rate: Determines to what extend the business is dependent on debt. A high leverage ratio means a riskier firm. Even if the profits of the firm are fluctuating, debt payments are fixed and a pre-payment plan is certain. If the cash flow eventually declines, the firm cannot afford to pay its debts (Evin, 2014).
This ratio can be normalized to be around 50%. However, the disruptive effect of the inflation on the passive structure of balance-sheet has increased up to 70% in our country. For this situation, the role of capital shortage in our country and advantages of borrowing is great. However, the relatively high cost of borrowing removes this situation.
Leverage (Debt) Ratio = Total Debt / Total Assets
Leverage Factor: It is preferred that the ratio of Leverage Factor is low, indicating how much foreign resources are used in funding the firm's assets compared to its own funds. However, the factors that make up the rate need to be examined in a good way. The development of the Leverage Factor over time, which is a good indicator of the capital structure of the companies, allows the companies to observe their preferences in capital structures. As mentioned in the Debt-Assets ratio, it is very important to establish a proper equilibrium
11
between equity and foreign resources. Companies that work with appropriate management understanding and are in favourable sectors they can work with higher Debt-Assets and Debt-Equity ratios, if their business risk and operational risk rates are low, while it is accepted as a general rule by western financial institutions that the rate should not exceed 100%, it can be accepted that this ratio is between 150% and 200% in the countries where it is difficult to find equity like our country (Evin, 2014).
Leverage Factor = Short-Term Liabilities+Long-Term Liabilities / Equities
Ratio of Fixed Assets to Continuous Capital: This ratio shows how much the company's core capital is used to finance its tangible assets. With this rate, we can measure how successful companies are in funding their financial investments (Evin, 2014).
Fixed Asset - Continuous Capital = Tangible Assets/Long-Term Debt + Equity
Interest Coverage Ratio: It shows how the companies can meet (how many times the interest rate) the profit (interest and profit before tax) and financing costs resulting from all activities that they have shown. It can also be used as a risk and safety indicator for companies. In western countries this ratio is sufficient to be 8: 1, 7: 1. In our country, high interest rates and fluctuating conjuncture in recent years cause this ratio to wavy and be lower than standard. In this case, it is sufficient that the ratio is about 4 or 3 (Evin, 2014).
Interest Coverage Ratio =Profit before Tax + Financing Expense / Financing Expense
Receivables Turnover: Receivable turnover is a measure of the ability of companies to collect their trade receivables and how many times they have transferred their receivables over a year. If a company is able to collect their receivables quickly (if the turnover rate is high), the liquidity can be considered high. The company does not enter into cash tightness on this account, and it can use them more economic areas without much loss of receivables
Company's receivables will differ due to reasons like seasonal fluctuations, inflation, etc. Especially if there are ever-increasing trade receivables items during the period and it is more meaningful to use trade receivables averages in the denominator in order to get the betting factors to go away. For example,
12
in the year-end balances, the rate may be high because the level of commercial activity generally falls to the lowest level and the receivables are closed (Evin, 2014).
Receivables Turnover =Net Credit Sales(sales revenue) / Trade Receivable
Debt Collection, it is the day-to-day conversion of the receivables turnover rate and gives us the same results as the turnover rate. However, since it gives the results day by day, it shows how many days the companies could collect their receivables on average (Evin, 2014).
The sooner a company can collect its receivables, the higher the liquidity, and the company will not have shortage of cash. Therefore, it can use its receivables in more economic areas before falling in value. When examining the average collection period of receivables, it is possible to reach healthier results by comparing it with the average collection period of the previous term, the sector average and the maturity period applied by the company generally.
Debt Collection: 360 / Receivables Turnover
Inventory Turnover : Another ratio to measure the efficiency of the use of assets; it is the inventory turnover rate which shows how many times inventories are handed over in one year. The purpose of inventory turnover analysis is to see how quickly these assets, which are held as inventory, are consumed by the firm during manufacture and are made ready for sale. In this way, it reveals that how many times inventories have been renewed in a certain period. High inventory turnover rates indicate that inventories are being held and used more optimally. In such a case, companies could earn more profits with less operating capital; but the high inventory-turnover rates of companies might be due to insufficient inventories (Evin, 2014).
Inventory Turnover = Cost of Goods Sold / Inventories
Inventory Turnover Period: The average consumption period of inventories is the day-to-day turnover of the inventory turnover rate and gives us the same results as the inventory turnover rate. However, since it gives the results day by day, it shows the average number of days the companies are out of inventories (Evin, 2014).
13
Inventory Turnover Period=360/ Inventory Turnover
Asset Turnover: Asset turnover is a measure of the success of the sales volume created by the assets (total assets) of the companies. This ratio shows us whether there is excessive investment in the assets, in other words whether the asset sizes of the companies are increased unnecessarily. This might be a measure of the use of technology or the use of assets in an enterprise.
If the assets occupy a significant place within total assets, the asset turnover rate will be low. This situation is more likely to occur in capital-intensive industrial companies. On the other hand, it is natural that this ratio is high in enterprises where fixed investments are less (for example in trading or finance companies). Asset turnover is an important indicator of the profitability of the enterprise (Evin, 2014).
Asset turnover =Net Sales(Sales Revenue)/Total Assets
Gross Margin: Gross margin is a positive difference between the sales of companies and the cost of sales. When we divide gross profits by net sales, we find gross profit margin. Gross profit margin is only a measure of how much profit margin achieved by sales without taking the company's other revenues and expenses into account. Gross profit margins will yield meaningful results when compared to the companies in the same line of business and the company's past. In this way, we could see how much profit margin is achieved by companies in terms of periods or in the same period against similar companies, i.e. their competitive power and the competitive power improving over periods (Evin, 2014).
Gross Margin=Gross Profit or Gross Loss / Net Sales(Sales Revenue)
Net Margin: Net margin is a value reflecting the results of all the activities of the companies. When we divide net profit for the period by sales, we find net profit margin. Net profit margin is a measure that allows us to make judgment on all the company's operating, investment and financing policies since the company's other revenues and expenses are considered (Evin, 2014).
14
Equity Capital: Equity capital is one of the main sources of the companies and constitutes the part of the companies which their partners deserve. The components constituting the equity capital are comprised of the undistributed profits of the current and previous period, which the shareholders become entitled to take by the capital they invested but left them to the company (Evin, 2014).
Return on Equity (ROE): Return on equity is a measure of the profitability of a unit of funds that partners have left as a source for the company. This rate, which is used to measure the success of the management, is also used by shareholders to see the return of their participation (Evin, 2014).
Return on Equity (ROE)= Net Profit(Loss) for the period/Equity Capital
3.4. DuPont Analysis
It is used to analyze how the business affects the profitability of its assets. The analysis shown that an business’ sales with a high profit margin will not guarantee a profitable period profit, it also indicates that a sales amount related to the resources used for it must also be realized. On the other hand, it also reveals that high sales volume will not give the desired result without an adequate profit margin (Prendergast, P).
Profitability of Total Assets =Net Profit Sales ×
Sales
Average Total Assets Equity Profitability =Net Profit
Sales ×
Sales
Average Total Assets×
Average Total Assets Average Own Funds
3.5. Vertical Analysis
In the analysis of the Vertical method, the balance sheet total is taken as accepted of 100 and the total rate of each of the account is calculated, and also can be compared of financial statement with the similarities of similar businesses if desired. When the same analysis is made for the income statement, the net sales are accepted as 100 and the proportion of the income statement data to net sales is calculated.
In this analysis method, next to the column where the numerical data in the row is located, and also for a group sum and general sum, a column is opened and the ratios are written in this section.
15
It is calculated by the below formula according to group total; Group Percent: (Item amount / Group sum)*100 It is calculated by the below formula according to general total;
17
4. MULTI CRITERIA DECISION MAKING (MCDM) METHODS
Multi Criteria Decision Making Methods the data used to compare and financial the countries economical and the results obtained with the model established these data and the order of the options are used in research studies as appropriate methods that can select and classify from among the options (Urfalıoğlu and Genç, 2013:329-360). Multi-criteria analysis techniques provide for the scientific selection of the environment in which multiple, similar and near features criteria exist. It serves a variety of purposes, such as solving the problem, choosing the best, and determining the performance.
In cases where more than one alternative exists and the alternatives cannot be decomposed according to their differences, Multi Criteria Decision Making (MCDM) methods are used (Turan et al., 2016). In 2009, Wang separated the Multicriteria Decision Making Methods into three groups (Wang, 2009: 2273). These groups are; Basic Methods (Weighted Addition and Multiplication Methods), One Valued Unified Criteria Methods (AHP, TOPSIS, Grey Relational Method, Fuzzy TOPSIS) and Sorting Methods by Proficiency (ELECTRE, PROMETHEE) (Turan et al., 2016). In spite of the fact that these methods have different methods of analysis, similar results can be obtained. Another Multi Criteria Decision Making Methods analysis method is GRA (Gray Relation Analysis). This method provides an easier solution than the methods of mathematical analysis where uncertainty is the case.The GRA method can be used to quantitatively and logically measure the relationship between two sequences. The relation level computed at the end of the constructed operations is called the gray relation level and takes values between ‘0’ and ‘1’ (Feng-Wang, 2000:137).
Multi criteria analysis methods are often used in supplier selections.These analysis methods were used in performance evaluation as well as supplier selection.
18
Figure 4.1: Supplier Selection Process Source: Alkan et al., 2016:262
In Figure 4.1, the supplier selection process determined by multi criteria analysis methods is given in a schema.
In this part of the study, 5 (five) of the most frequently used analytical methods will be examined in this section. These are; TOPSIS (Technique for Order Preference by Similarity to Ideal Solution), PROMETHEE (The Preference Ranking Organization Method for Enrichment Evaluation), ELECTRE (Elemination and Choice Translating Reality English), AHP (The Analytic Hierarchy Process) and GRA (Gray Relationship Analysis).
4.1. TOPSIS (Technique for Order Preference by Similarity to Ideal Solution) The TOPSIS method is used to find the best option with the help of multiple choice criteria. Positive ideal and negative ideal solutions are available according to the TOPSIS method. In this method, as the ideal solution, the positive ideal solution is considered the closest and negative ideal solution is the farthest option. In the TOPSIS method, the Euclidean distance method is used to calculate the positive ideal and negative ideal solution distances of options (Turan et al., 2016;56-66).
It is frequently seen that TOPSIS (Technique for Order Preference by Similarity to Ideal Solution) method which is one of the MDMM (Multicriteria Decision Making Methods) methods is used to measure the economic performance of countries and companies and to prefer the most suitable supplier in manufacturing enterprises (Uygurtürk and Korkmaz, 2012:95-115). In this context, it is possible to list some of the studies done with TOPSIS method and the literature;
Granting Supplier Selection Decision Determination of Criteria to be Used in Supplier Selection Determination of Weights of Determined Criteria by AHP Method Evaluation of Suppliers by AHP and Promethee Methods Sensitivity Analysis and Evaluation of Results
19
Work carried out in order to find the most suitable supplier; in his 2007 work, Eleren studied how to choose the province as the most suitable place for the leather sector by using the Fuzzy TOPSIS method. As a result of the analysis made, it is concluded that Istanbul is the most suitable province (Eleren, 2007). In the study conducted by Eleren and Ersoy in 2007, marble block cutting methods were evaluated by Fuzzy TOPSIS method and the most suitable method was determined (Eleren, 2007). Abalı et al. In 2012, they analysed the scholarship selection in an educational institution using both the AHP (Analytical Hierarchy Process) method and the TOPSIS method (Abalı et al., 2012).
In 2016 Geyik et al. they used very specific decision-making techniques in the selection of the book publishing house. In the study, the criteria were weighted using the Analytical Hierarchy Process (AHP) method. In the later stage, alternatives are listed using the TOPSIS method. In this way, the best alternatives have been identified (Geyik et al., 2016). In a study by Yilmaz and Ballı in 2016, BAHS, TOPSIS and PROMETHEE (The Preference Ranking Organization Method for Enrichment Evaluation) analysed multi-criteria decision making methods in a C # -based program to select an intelligent system for the use of data encryption algorithms. As a result of the analysis made, they obtained the order which is closest to the order made by an expert previously with the PROMETHEE method (Yılmaz and Ballı, 2016).
In 2017, Eren et al. used multi-criteria decision making techniques in the selection of echocardiography devices. In the study, the criteria were weighted using the Analytical Hierarchy Process (AHP) method. In the later stage, alternatives are listed using the TOPSIS method. In this way, the best alternatives have been identified (Eren et al., 2017). In the study conducted by Girgin in 2017, the basic characteristics of students who graduated from the department of map and geomatics engineering were searched for in private sector recruitment and analysed by multi-criteria decision analysis methods. In this context, AHP and TOPSIS methods are used (Girgin, 2017).
Studies aimed at finding the best performance; Yurdakul and İç analyzed the performance of Turkish automotive firms in 2003 using TOPSIS method (Yurdakul and İç, 2003). Özgüven evaluated the performances of retailers who could compete in the global arena in the crisis period by using Fuzzy TOPSIS method in his study in 2011 (Özgüven, 2011). In the study conducted by Uygurtürk and Korkmaz in 2012,
20
the financial performance of metal industry companies was evaluated using TOPSIS method (Uygurtürk and Korkmaz, 2012).
In the study conducted by Akkaya in 2013, the financial performances of airline companies were evaluated. During the performance evaluation, 63 financial ratios were determined and analysed by TOPSIS method (Akkaya, 2013). Turan et al. In the study they carried out in 2016, they evaluated the economic performance of the Soviet Union, from 1992 until 2014, using the TOPSIS method (Turan et al., 2016). Demir et al. while they were looking at the performance of the economy in 2016, especially in the period referred to as Özal Period, they evaluated how the 24 January decisions taken at that time affected the economy. In addition, the study also compared the AK Party period, which is said to be similar to the Özal period (Demir et al., 2016). In 2017, Ünlü et al. in the study they conducted, BIST 30 firms that have been traded in, have examined their firm performances by using the TOPSIS method (Ünlü et al., 2017).
Two different results can be obtained by using the TOPSIS method. These results are called positive and negative ideal solutions. In this method, the order of the choices is based on the relative proximity of the ideal solution. The positive ideal solution maximizes the utility criterion, while the antithesis is the method that minimizes the cost criterion. The negative ideal solution is the reverse of the positive solution. In the negative solution, the utility criterion is minimized while the cost criterion is maximized (Cheng-Ru, 2008: 256).
The steps of the TOPSIS method are described below (Yanık and Eren,2017);
In the first step; The decision matrix is formed. While the decision matrix, Which is called the initial matrix, contains the desicion points to be ranked for excellence in the rows, there are evaluation factors to be used in decision making in the columns.The decision matrix is shown as follows.
𝑅𝑚×𝑛= [𝑅𝑖𝑗] = [ 𝑟11 𝑟12 𝑟13 … 𝑟1𝑛 𝑟21 𝑟22 𝑟23 … 𝑟2𝑛 … … … … … 𝑟𝑚1 𝑟𝑚2 𝑟𝑚3 … . 𝑟𝑚𝑛 ]
i∈{1, 2, …, m} and j∈={1, 2, …, n} to be; 𝑟𝑖𝑗 = 𝑎𝑖𝑗
√∑𝑚𝑘=1𝑎𝑘𝑗2
21
In the second step; Standard Decision Matrix is established.In this step, the decision matrix is normalized and a standard decision matrix is obtained.
Rj = w1X1j+ w2X2j+ w3X3j… + w14X14j
In the third step;Weighted Standard Decision Matrix is created. Firstly, weights related to evaluation criteria are determined. Then the elements in each column of the matrix are multiplied by the corresponding weight value to form a Weighted Standard Decision matrix.
The significance levels (wi) of the variables used for the analysis are assumed
to be equal because of the uncertainty (w1=w2=…=w14=0.071). This will affect
the results of the analysis of these significance levels in the analysis work done, which will ensure that different results are obtained.
𝑊𝑚×𝑛 = [𝑤𝑖𝑗] = [ 𝑤1𝑟11 𝑤2𝑟12 𝑤3𝑟13 … 𝑤𝑛𝑟1𝑛 𝑤1𝑟21 𝑤2𝑟22 𝑤3𝑟23 … 𝑤𝑛𝑟2𝑛 … … … … … 𝑤1𝑟𝑚1 𝑤2𝑟𝑚2 𝑤3𝑟𝑚3 … . 𝑤𝑛𝑟𝑚𝑛 ] 𝑤1 + 𝑤2+ ⋯ + 𝑤𝑛 = 1
In the fourth step; Positive ideal solution and Negative ideal solution are created. Positive The largest values of the column values in the Weighted Standard Decision matrix are selected so that the ideal solution set can be generated.The ideal solution set is shown in the following form. Negative The minimum values of the column values in the Weighted Standard Decision matrix are selected so that the ideal solution set can be generated.The ideal solution set is shown in the following form.
Along with the weighted standard decision matrix, there are positive (P+) and negative (P−) solution clusters. The elements of the positive and negative
solution clusters are constructed by calculating the maximum and minimum values of each column of the weighted standard decision matrix. The positive ideal set of solutions(𝑃+), is calculated by weighted standard decision matrix.
𝑃+ = {𝑤1+ = max 𝑖={1,2,…,𝑚}𝑤𝑖1, 𝑤2 += max 𝑖={1,2,…,𝑚}𝑤𝑖2, … , 𝑤𝑛 + = max 𝑖={1,2,…,𝑚}𝑤𝑖𝑛}
The negative ideal set of solutions is calculated by means of a set of weighted standard decision matrix (𝑃−)
𝑃− = {𝑤
22
In the fiveth step; Separation measures are calculated.In the TOPSIS method, the evaluation factor value for each decision point has deviations from the positive ideal and negative ideal solution set.
The cluster consisting of positive ideal solution distance is called (S+) and the
cluster consisting of negative ideal solution distance(S−). The values obtained
from these two clusters reach to the (C) cluster which is composed of the relative solution values of the ideal solution. During the sorting process, the highest priority is the C value.
𝑆+ = {𝑆 1+, 𝑆2+, … , 𝑆𝑚+ } i={1, 2, …., m} to be, 𝑆𝑖+ = √∑ (𝑤 1𝑗− 𝑤𝑗+)2 𝑛 𝑗=1 . 𝑆− = {𝑆 1−, 𝑆2−, … , 𝑆𝑚− } i={1, 2, …., m} to be, 𝑆𝑖− = √∑𝑛 (𝑤1𝑗− 𝑤𝑗−)2 𝑗=1 .
In the sixth step; Relative proximity is calculated. Positive ideal and negative ideal difference measures are used to calculate the ideal resolving relative proximity of each of the decision points.
𝐶 = {𝐶1, 𝐶2, … , 𝐶𝑚} k={1, 2, …, m} to be, 𝐶𝑘 = 𝑆𝑘−
𝑆𝑘−+𝑆𝑘+, .
For each k value, 0 ≤ 𝐶𝑘≤ 1 equals. In other words, if k is 1, it is the positive ideal solution of the corresponding decision point, 0 is the negative ideal solution of the corresponding decision point.
4.2. PROMETHEE (The Preference Ranking Organization Method for Enrichment Evaluation)
The Promethee method, introduced in 1982, is a multi criteria sorting method (Dağdeviren and Erarslan, 2005).Promethee is a method that allows for the sorting of alternatives taking into account conflicting criteria. This method starts with the
23
evaluation chart. Alternatives in this table are evaluated according to different critreia (Ömürbek et al., 2014).
There are two kinds of information needed for the implementation of Promethee.We can sort this information in the following way (Ömürbek et al., 2014);
Function preferences of the decision maker to compare the contribution of alternatives in each criterion.
Criteria considered are of relative importance.
Some of the works done by PROMETHEE method in literature are;
In a study conducted by Özgüven in 2012 , a research on special shopping sites also used Promethee ranking method (Özgüven, 2012).
In 2013, the work done by Genç was introduced to the PROMETHEE method which is used frequently in academic studies and also the aim of GAIA (Geometrical Analysis for Interactive Aid), which is a geometric representation of the method, is to emphasize the advantages of visual decision making on the decision maker (Genç, 2013).
In 2014, the service quality of the GSM operators was evaluated with the methods of ELECTRE and PROMETHEE in the work done by Çelik and Ustasüleyman (Çelik and Ustasüleyman, 2014).
Promethee method consists of 7 steps. It is possible to describe these steps in the following order (Dağdeviren and Erarslan, 2005);
In the first step;w=(w1,w2,…,wk) weights with k criteria, for the alternatives evaluated by c=(f1,f2,…,fk), the data matrix A=(a,b,c,…)is constucted.
In the second step; The preference function is defined for each criterion. In the third step; The common preference functions for alternative pairs are
determined on the basis of preference functions.
In the fourth step;The alternative index is calculated for the base alternative that based on the common preference functions.
In the fiveth step; Positive (Φ+) and negative (Φ-) superiorities are determined for each alternative.
In the sixth step; Partial priorities are determined by Promethee I. Partial priorities describe the relationships of alternatives to each other.These relations
24
are; preferences of alternatives and determination of alternatives which are not-different from each other.
In the seventh step; The exact priorities for using Promethee II for alternatives are calculated and the exact values are calculated by evaluating these calculated values on the same plane as all alternatives (Alkan et al., 2016:262).
4.3. ELECTRE (Elemination and Choice Translating Reality English)
The method of ELECTRE (Elemination and Choice Translating Reality English) is a multi decision method originally proposed by Beneyoun in 1966. The method is based on binary superiority comparisons between altermative decision points for each rating factor. The ELECTRE method takes place in 8 (eight) steps (Triantaphyllou, 2000). It is possible to list these steps as follows;
In the first step; The Decision Matrix is formed.Decision points in order to rank their superiority in the order of the decision matrix and also in the column, are evaluation factors to be used in decision making. This matrix is the initial matrix generated by the decision maker.
In the second step; Standard Decision Matrix is created. The standard decision matrix is obtained by dividing the square of the sum of the squares of the one column elements of the decision matrix.
In the third step; Weighted Standard Decision Matrix is calculated. Assessment factors may significance in their difference in terms of decision maker. The Y matrix is calculated to reflect these significance differences to the ELECTRE solution. The decision maker must first determine the weights of the evaluation factors.
In the fourth step; Compliance and nonconformity sets are determined.To be benefit for the weighted standard decision matrix is used to determine the compliance sets. Decision points are compared with each other in terms of evaluation factors.
In the fiveth step; Compliance and nonconformity sets are created.In order to construct this matrix, the set of compliance and nonconformities calculated in the previous step is used.
25
In the sixth step; Matrices of compliance superiority and nonconformity superiority are formed.In this phase, the adaptation matrix is obtained by comparing the element with the adaptation threshold value.
In the seventh step; A total dominance matrix is formed.This matrix consists of multiplication of the elements of the compliance superiority and nonconformity superiority.
In the eighth step; The importance order of the decision points is determined. The rows and columns of the total dominance matrix show the decision points. Ranking is made according to the level of importance of the decision maker.
4.4. AHP (The Analytic Hierarchy Process)
AHP (The Analytic Hierarchy Process), Which is one of the multi criteria decision methods, is based on binary comparisons. Comparisons can be made subjectively or objectively depending on the definition of the criteria. The comparison weights should be done objectively considering how much more important an alternative is than the other. According to the criteria such as the outcome of personal evaluations, conformity, preference and importance, when compared with expert opinions, subjective result arise. Although the subjectively of expert opinions other than quantifiable criteria appears to be an advantage of the AHP method, this personality remove definite to the consequences (Anderson et al., 1998:746-756).
The AHP method is based on naturalness seen during the viewpoint of the human brain created (Çiftçioğlu, 2013). AHP method; based on a binary comparison of alternatives according to the criteria.The AHP provides decision support for the solution of multi criteria and multi alternative problems (Ömürbek et al., 2014).
The AHP was first introduced by Myers and Alpert in 1968.The AHP method developed by Saaty in 1977 consists of five basic steps (Saaty,1980).It is possible to explain these steps in the following order (Alkan et al., 2016:262);
In the first step; The problem is identified,the main target is determined by hierarchical structure.
In the second step; A hierarchy of criteria and alternatives is created. In the third step; The binary comparison matrix(s) is generated.
26
In the fiveth step; The consistency rate is calculated.In case of inconsistency, the binary comparisons are passed through the eyes and the transactions are repeated until they are consistent.
4.5. GRA (Gray Relationship Analysis)
The Gray System Theory (GST) entered the world of science in the 1980s. In 1982, the Chinese Professor Deng Ju Long has been attracted attention for article in the issue of control problems with Gray systems. This article is the first article mentioned in the GST. GST, which gathers attention in the scientific World, has been involved in the work of many researchers and has been developed by these researchers. GST is a technique that aims to make numerical or digitize ambiguous states.The basic approach is to measure and analyze the responses of uncertain systems that can not be achieved with fuzzy techniques. GST has easier and clearer steps than fuzzy logic. In doing so, if the data is limited, is the advantage of the method (Aydemir et al., 2013:188).
Gray theory provides analysis of the relationship between the available, countable, extensible, independent, dashed numbers and qualified series (Sofyalıoğlu, 2011:159). GST has subdivision like are Gray Relationship Analysis, Gray Modeling, Gray Estimation, Gray Decision Making (Büyükgebiz, 2013:18).
One of the subdivisions of GST, Gray Relational Analysis (GRA),is the most popular with many different areas being applicable. Gray incidence analysis (GIA) is a rating, classification and decision making method. It is a method that is used to analyze the relationships between the dashed data sets and to solve problems in the missing information light (Sofyalıoğlu, 2011:159).
GIA does not need complex and long running calculations, it is the preferred method of research because it leads to clear results, and easy to implement.(Büyükgebiz, 2013:19). In GIA, the relation between value and each criterion can be examined and inter criteria valuation can be made (Tayyar et al., 2014:29).
While the grey concept mentioned in the method states that the information in a system is not fully known, however, white color has full knowledge, black color means that knowledge is never known. The purpose in the grey theory is; to bring the information that is black in the system to a grey state (Çelebi, 2008:23).
27
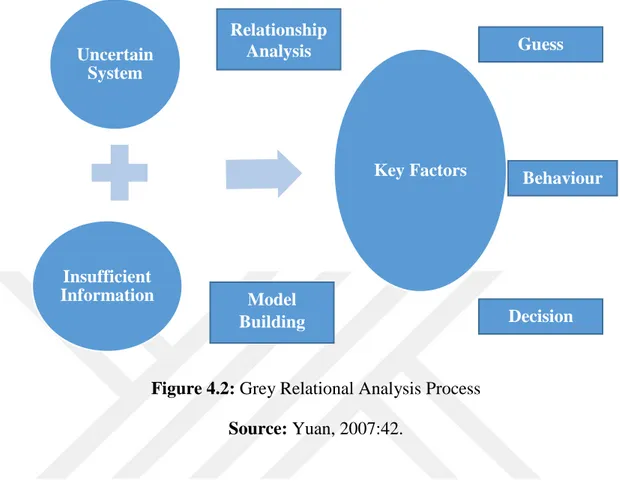
The Grey Relational Analysis Process designed by Yuan (2007) is given in Figure 4.9. (Yuan, 2007:42).
Figure 4.2: Grey Relational Analysis Process Source: Yuan, 2007:42.
When we look at literature, GRA method is use in performance measurement and supplier selection just like a TOPSIS method. Here are some of these studies;
In 2009, Özdemir and Deste conducted Gray relational analysis method use for selecting suppliers in the automotive sector (Özdemir and Deste, 2009).
In the study conducted by Peker and Birdoğan in 2011, gray relational analysis method was used to measure performance in the Turkish insurance sector (Peker and Birdoğan, 2011).
It was used in the study conducted by Çakmak and Baş Metin in 2012 to the Gray relational analysis and the Compliance analysis were used to the production errors encountered in company (Çakmak and Baş Metin, 2012).
In the study conducted by Ecer in 2013, gray relational analysis method was used to compare the financial performances of Private Banks in Turkey (Ecer, 2013). Uncertain System Insufficient Information Key Factors Relationship Analysis Model Building Guess Behaviour Decision
28
The Gray relational analysis method was used to evaluate the financial performances of the tourism companies traded in the Stock Exchange Istanbul in the work done by Fatih and Günay in 2015 (Fatih and Günay, 2015).
The GRA method takes place in 6 (six) steps. These steps (Çakır, 2017);
In the first step; The initial decision matrix is constructed. In the decision matrix is to ‘m’ is the number of alternatives and ‘n’ is the number of criteria to assumed.
In the second step; Here, the reference series and the comparison matrix are constructed. The reference series can be created by setting the values that would be an ideal alternative; or among the available alternatives, it can be determined by using of the best scores for each criterion.The comparison matrix is reached by adding the first line of reference series in the decision matrix created in the previous step.
In the third step; In this step, normalization is required to make the data uniform. The normalization process is done in three different forms according to the characteristics of the criteria.
In the normalization process for the better contribution of the greatest value, the following equation is used.
𝑥𝑖∗(𝑗) = 𝑥𝑖(𝑗) − 𝑗[𝑥𝑖(𝑗)] 𝑚𝑖𝑛 [𝑥𝑖(𝑗)] 𝑗 𝑚𝑎𝑘𝑠 − [𝑥 𝑖(𝑗)] 𝑗 𝑚𝑖𝑛
In the normalization process for the contribution of the smallest value, the following equation is used.
𝑥𝑖∗(𝑗) = 𝑚𝑎𝑘𝑠𝑖=1
𝑛 [𝑥
𝑖(𝑗)] − 𝑥𝑖(𝑗)
𝑚𝑎𝑘𝑠𝑖=1𝑛 [𝑥𝑖(𝑗)] − 𝑚𝑖𝑛𝑖=1𝑛 [𝑥 𝑖(𝑗)]
For the contribution of the ideal value to be optimal, the condition 𝑚𝑖𝑛𝑖=1𝑛 [𝑥𝑖(𝑗)] ≤ 𝑥𝑖𝑑𝑙(𝑗) ≤ 𝑚𝑎𝑘𝑠𝑖=1𝑛 [𝑥𝑖(𝑗)] in the normalization process,in the
normalization process with condition to provide the condition, the following equation is used. The target value for the 𝑥𝑖𝑑𝑙(𝑗), j’s criterion.
𝑥𝑖∗(𝑗) = 1 − [𝑥𝑖(𝑗) − 𝑥𝑖𝑑𝑙(𝑗)] 𝑚𝑎𝑘𝑠{𝑚𝑎𝑘𝑠𝑖=1𝑛 [𝑥
29
In the fourth step; Absolute difference tables between 𝑥0∗ and 𝑥1∗ are found and an absolute value table is created.
In the fiveth step; In this step, gray relational coefficient matrix is constructed. For this, each element in the matrix is calculated using the following equations.
𝛾0𝑖(𝑗) = ∆𝑚𝑖𝑛+ 𝛿∆𝑚𝑎𝑘𝑠 ∆0𝑖(𝑗) + 𝛿∆𝑚𝑎𝑘𝑠 ∆𝑚𝑎𝑘𝑠= 𝑚𝑎𝑘𝑠 𝑖 𝑚𝑎𝑘𝑠 𝑗 ∆0𝑖(𝑗) ∆𝑚𝑖𝑛= 𝑚𝑖𝑛𝑖 𝑚𝑖𝑛 𝑗 ∆0𝑖(𝑗)
In the sixth step; The gray relational ratios are calculated in this step. It can be seen how the 𝑥0∗series compared to the calculated gray relational degree is similar to the 𝑥1∗ reference series.
Γ0𝑖 = 1
𝑛∑ 𝛾0𝑖(𝑗)
𝑛
𝑗=1
𝑖 = 1, 2, 3, … … , 𝑚
If the criteria have different weights, the gray relational level of the series is calculated using the following formula.
Γ0𝑖 = 1
𝑛∑[𝑞𝑗⨂𝛾0𝑖(𝑗)]
𝑛
𝑗=1
31
5. INVESTIGATION OF IRON AND STEEL TRADED IN ISE (ISTANBUL STOCK EXCHANGE)
In this section, Ereğli Iron & Steel Inc. and Kardemir Iron & Steel Inc.'s financial statements will be analyzed by ratio analysis. In Annex-1 Tables A.1A, B, C, D and E, there is 6 (six) years of balance sheet of Ereğli Iron & Steel Inc. In Annex-2 Tables A.1A, B, C, D and E there is 6 (six) years' balance sheet of Kardemir Iron & Steel Inc.
5.1. Ereğli Iron & Steel Ratio Analysis
In this section, the financial statements of Ereğli Iron & Steel Inc. will be analyzed by ratio analysis.
The ratio analysis of Ereğli Iron & Steel Inc.'s 6 (six) year old balance sheet is given in Annex-1 Table A.1
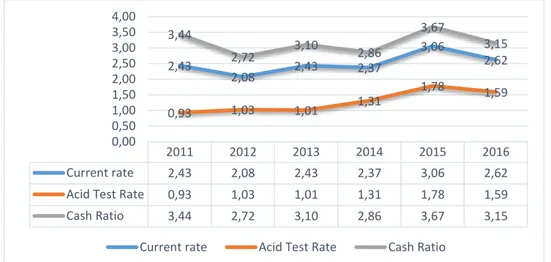
The graph of current ratio, acid-test rate and cash ratio of Ereğli Iron & Steel Inc. is given in Annex-1 A.2 and is shown graphically in Figure 5.1.
Figure 5.1: Ereğli Iron & Steel Inc.’s Liquidity Ratio
As shown in Figure 5.1, as a result of the ratio analysis on the balance sheet data of Ereğli Iron & Steel Inc.,
2011 2012 2013 2014 2015 2016
Current rate 2,43 2,08 2,43 2,37 3,06 2,62
Acid Test Rate 0,93 1,03 1,01 1,31 1,78 1,59
Cash Ratio 3,44 2,72 3,10 2,86 3,67 3,15 2,43 2,08 2,43 2,37 3,06 2,62 0,93 1,03 1,01 1,31 1,78 1,59 3,44 2,72 3,10 2,86 3,67 3,15 0,00 0,50 1,00 1,50 2,00 2,50 3,00 3,50 4,00
32
The current ratio in the graph of Ereğli Iron & Steel Inc. shows a trend of 2.43 despite the global crisis of 2011 ,however a slight downward trend in 2012. The trend in 2013 was as high as in 2011 and continued its upward tendency in 2014, 2015 and 2016. Ereğli Iron & Steel Inc has been in the range of 1.5-2, which should be in our country by years. In short, it is desirable that the total amount of current assets owned by the enterprise is higher than the short-term liabilities reaching double. Ereğli Iron & Steel Inc has achieved it.
The acid-test rate was affected by the crisis of 2011 in the graph of Ereğli Iron & Steel Inc., and showing a tendency to be under 1, that is, the effect of stock on the decrease of sales.
2012, 2013, 2014 and 2015, it has the short-term liabilities solvency without depending on liquidity stocks that should be, and it has a consistent management policy since it shows a good value above during these years.
Cash ratio in Ereğli Iron & Steel Inc.’s graph which is the ratio of 0.20 in our country. Shows the fact that the enterprise does plan and use its cash well. Despite the world crisis in 2011, it provides a solid business image with a high cash rate of 3.44, at the level of developed countries.
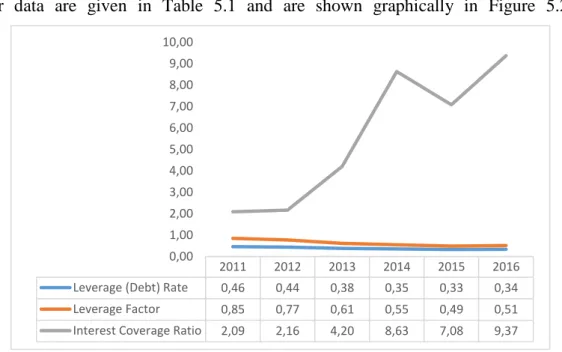
Ereğli Iron & Steel Inc.'s Interest Coverage Ratio, Leverage(Debt) Rate and Leverage Factor data are given in Table 5.1 and are shown graphically in Figure 5.2.
Figure 5.2: Ereğli Iron & Steel Inc.'s Financial Structure Ratios 2011 2012 2013 2014 2015 2016 Leverage (Debt) Rate 0,46 0,44 0,38 0,35 0,33 0,34 Leverage Factor 0,85 0,77 0,61 0,55 0,49 0,51 Interest Coverage Ratio 2,09 2,16 4,20 8,63 7,08 9,37
0,00 1,00 2,00 3,00 4,00 5,00 6,00 7,00 8,00 9,00 10,00
33
As shown in Figure 5.2, as a result of the ratio analysis on the balance sheet data of Ereğli Iron & Steel Inc.,
Interest Coverage Ratio, Ereğli Iron & Steel Inc.’s interest coverage ratio shows a trend below the ratio accepted in our country. It can also be used as a risk and safety indicator for companies. First two years trend ratio is decreases however 2013, 2014, 2015 and 2016 increases. The greater this rate, the greater the power to pay the company’s interest expenses. This company has a good management team, so done well this. Leverage Factor, the ratio of debt to equity is much lower than the generally accepted ratio in the 6-years period of Ereğli Iron & Steel Inc. Equity capital has a very strong influence on the resources of the enterprise. Therefore, as seen from the interest coverage ratio, foreign resources are used.
Leverage (Debt) Rate, it is seen that Ereğli Iron & Steel Inc. did have a good management policy with the effect of 2011 crisis and the management policy after 2012 has more improved. While the debt ratio in 2011 was 0.46, it decreased slightly up to 0.44 in 2012. Overall, the enterprise is in a good condition based on the ratio in our country. In 2015 and 2016 it achieved to keep the resource cost at the optimum level.
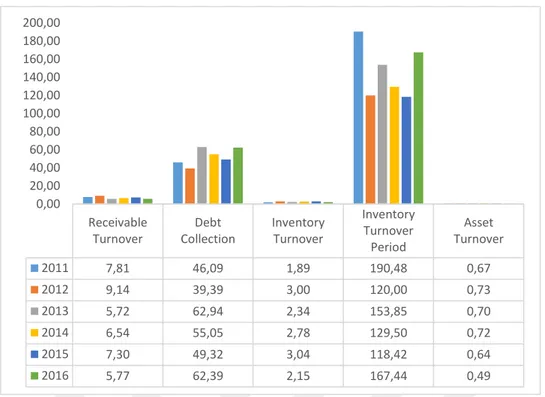
Ereğli Iron & Steel Inc.'s Receivables Turnover, Debt Collection, Inventory Turnover,Inventory Turnover Period and Asset Turnover ratios are given in table 4.1 and are shown graphically in Figure 5.3.