Istanbul Bilgi University
Institute of Social Sciences
Marketing Master’s Degree Program
Investigating the Mobile-Internet Based Healthcare
Services on Patients’ Satisfaction and Word-of-Mouth
(WOM)
Fahriye Sude Engin
117689013
Prof. Dr. Selime Sezgin
Istanbul
2019
iii
ACKNOWLEDGMENT
I would like to express my gratitude for my thesis advisor Prof. Dr. Selime Sezgin for providing her knowledge and guidance and she was always reachable whenever I needed her opinion. Additionally, without her inspirational talks, this thesis wouldn’t be completed successfully.
I would like to also thank Prof. Dr. Beril Durmuş for her guidance and patience during this period. She was always there whenever I needed assistance in every step of this journey. Her presence and assistance really were the key to finishing this thesis.
More importantly, I would like to dedicate this research to my wonderful family and express my gratitude to my friends. Their undivided patience and support gave me the motivation that I needed to complete this project.
iv
Table of Content
Acknowledgement………..iii List of Figures………vi List of Tables………..vii Abstract………..viii Özet………...ix INTRODUCTION………...…...11.1. Purpose of the Study………..2
2. REVIEW of the LITERATURE…...………...3
2.1. Internet as an Information Tool………...3
2.2. E-health………..4
2.3. Electronic Word-of-Mouth (WOM)...5
3. RESEARCH DESIGN….……….…...8
3.1. Introduction……….……..8
3.2. Research Design and Hypothesis Development……….……...9
3.2.1. Continued Use Intention, Satisfaction, and WOM…….……...10
3.2.2. Expectation Confirmation Model of Information Technology (ECM-IT)...11
3.2.3. Facilitating Conditions, Perceived Risk and Perceived Interactivity………13
3.2.3.1. Perceived Interactivity………....13
3.2.3.2. Perceived Risk………....15
3.2.3.3. Facilitating Conditions………...16
3.3. Research Methodology……….17
3.3.1. Implementation of MIHS and Its Use………...…17
3.4. Measures………..19
v
4. RESEARCH FINDINGS………..24
4.1. Frequency Analysis for Demographic Features………...24
4.2. Frequency Analysis for MIHS Purpose of Use………....25
4.3. Factor and Reliability Analysis………....26
4.3.1. Factor and Reliability Analysis of Confirmation of MIHS Performance Expectation………..28
4.3.2. Factor and Reliability Analysis of Facilitating Conditions…...29
4.3.3. Factor and Reliability Analysis of Intention of Continued Use of MIHS……….30
4.3.4. Factor and Reliability Analysis of Perceived Interactivity…....31
4.3.5. Factor and Reliability Analysis of Perceived Risk………32
4.3.6. Factor and Reliability Analysis of Perceived Usefulness……..33
4.3.7. Factor and Reliability Analysis of Patients' Satisfaction with MIHS……….34
4.3.8. Factor and Reliability Analysis of Electronic word-of-mouth (WOM)...35
4.4. Correlation………36
4.5. Regression………39
4.5.1. Multiple Regression Analysis of H1, H2, H4, H5, H6, H8, H9, H10 and H11………..39
4.5.2. Linear Regression Analysis of H3……….44
4.5.3. Linear Regression Analysis of H7 ………45
4.6. Hypothesis Results………47
5. CONCLUSION………...48
5.1. Managerial Implications………....53
6. LIMITATION AND FUTURE RESEARCH AND PROJECTS..……….54
vi
LIST OF FIGURES
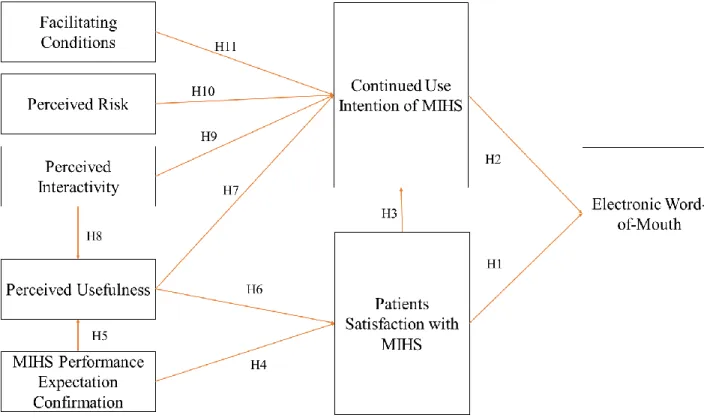
Figure 1: Proposed Research model………..….9
Figure 2: Multiple Regression of H1 and H2………..…...41
Figure 3: Multiple Regression of H9, H10, and H11…………...………..…....42
Figure 4: Multiple Regression of H5 and H8………...….43
Figure 5: Multiple Regression of H4 and H6………..…..44
Figure 6: Linear Regression of H3………..…..45
vii
LIST OF TABLES
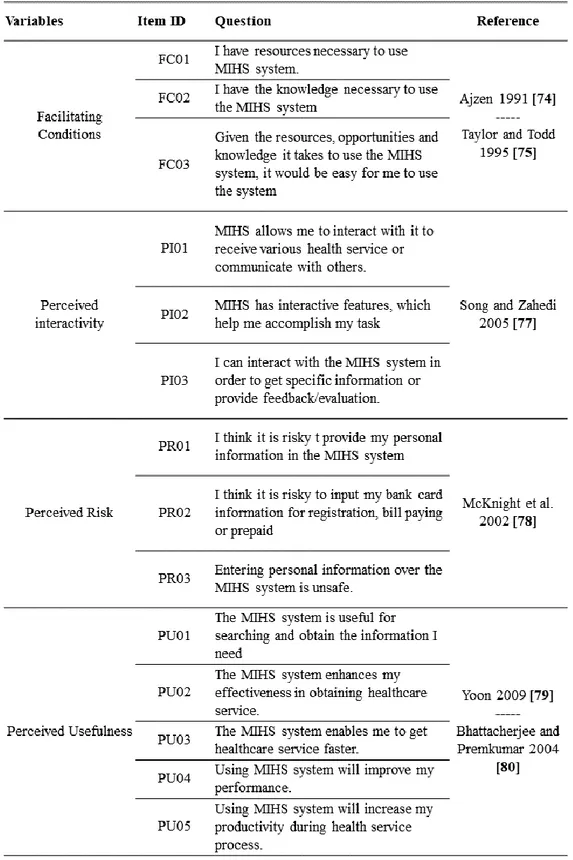
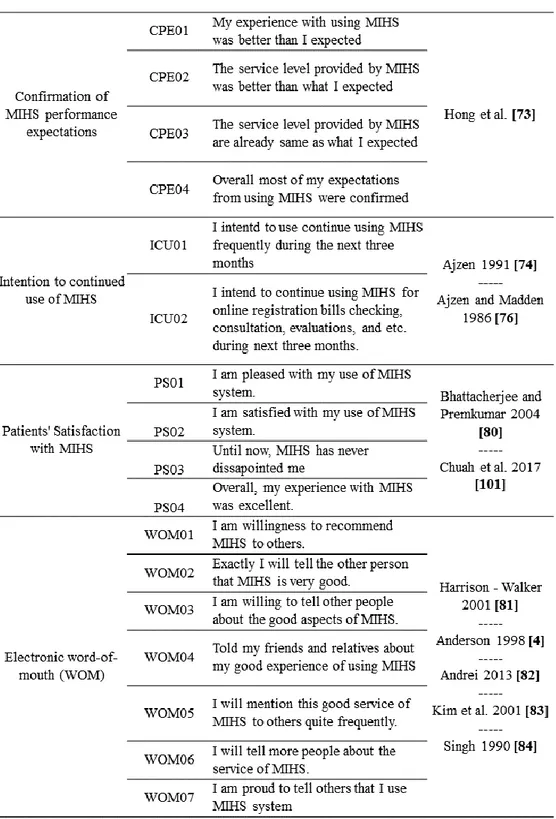
Table 1: Research variables and items………..……...…...21
Table 2: Demographic features of the participants………..….25
Table 3: Participants’ MIHS Purpose of Use………....26
Table 4: Factor and Reliability Analysis of Confirmation of MIHS Performance Expectation………...28
Table 5: Factor and Reliability Analysis of Facilitating Conditions………...29
Table 6: Factor and Reliability Analysis of Intention of Continued Use of MIHS...30
Table 7: Factor and Reliability Analysis of Perceived Interactivity………..31
Table 8: Factor and Reliability Analysis of Perceived Risk………..32
Table 9: Factor and Reliability Analysis of Perceived Usefulness………..…..33
Table 10: Factor and Reliability Analysis of Patients’ Satisfaction with MIHS…...34
Table 11: Factor and Reliability Analysis of Word-of-Mouth………..….35
Table 12: Correlation Analysis for CPE, FC, ICU, PI, PR, P PU, and WOM...….38
Table 13: Multiple Regression of H1 and H2………....40
Table 14: Multiple Regression of H9, H10, and H11…………...………...41
Table 15: Multiple Regression of H5 and H8………..…..42
Table 16: Multiple Regression of H4 and H6………..…..43
Table 17: Linear Regression of H3………..…..44
Table 18: Linear Regression of H7………..…..45
viii ABSTRACT
Technology is always evolving and pushing the boundaries and force everything and everyone around it to evolve with it. New boundaries brought new aspects to various types of concepts. With the internet technology, people started to search the information that they need from online platforms and that lead organization and their marketers to adapt their marketing strategies and create their own versions of digital strategy to attract their potential customers’ interest by creating websites and new services. The type of digital information and platforms that provide health-related information is called “E-health” or “Health 2.0”. Among these various type of platforms, Mobile and Internet-based health services (MIHS) helped patients to find the necessary information and evaluate the most suitable doctors and make online appointments for diagnosis and the treatment purposes.
The aim of this research is to investigate the factors that affect MIHS success. The result of this research will contribute to the marketing literature specifically for healthcare services.
ix ÖZET
Günümüzde teknoloji her daim gelişerek ve sınırları zorlayarak herşeyi ve herkesi kendisiyle birlikte gelişmeye ve adapte olmaya zorlamaktadır. Yeni sınırlar çeşitli konseptler için yeni bakış açılarını da beraberinde getirdi. Internet teknolojisi ile birlikte insanlar ihtiyacı olan bilgilere online platform ve web siteleri üzerinden ulaşmaya başladı ve araştırma süreci diğer bir çok şey gibi dijitalleşti. Bu durum da Sağlık Servis Sağlayıcılarını ve pazarlamacıları kendi pazarlama stratejilerini adapte etmeye zorladı ve her Sağlık Servis Sağlayıcısı farklı dijital içerikler üreterek (web siteleri, blog yazıları, sosyal medya vb.) potansiyel müşterilerine bilgi tedarik etmeye başladı. Sağlık tabanlı bilgi veren her türlü dijital platform literatürde “E-health” yada “Health 2.0” olarak adlandırılmaktadır.
Mobil-İnternet tabanlı Sağlık Hizmetleri (MIHS), hastalara ihtiyaçları olan bilgileri sağlayarak kendileri için en uygun olan doktoru yada hizmeti seçmelerine, gerekirse online randevu, ödeme gibi konularda yardımcı olarak müşteri memnuniyetini arttırmaya yardımcı olmaktadır.
Bu araştırmanın amacı MIHS sistemlerinin başarısını etkileyen faktörleri ortaya çıkarmaktır. Araştırma sonuçlarının özellikle sağlık sektöründe pazarlama literatürüne katkıda bulunması amaçlanmaktadır
1 INTRODUCTION
We live in a word that is literally integrated with technology. It became more integrated with our daily lives day by day and the concepts like innovation and digitalization were never this present. Technology is always evolving and pushing the boundaries and force everything and everyone around it to evolve with it. New boundaries brought new aspects to various types of things. It literally affected everything in our daily lives. It affected how people communicate with each other and also affected the way of information searching. With the internet technology people started to search the information that they need from online platforms and that lead organisations and their marketers to adapt their marketing strategies and create their own version of digital strategy to attract their potential customers’ interest by marketing their service or product in different kinds of ways such as creating a website or social media, writing blogs and articles about common issues and providing chat rooms so that they make themselves more accessible in the eyes of their customers. This type of digital information and platforms that provide health-related information is called “E-health” or “Health 2.0”.
The concept of E-health is to make hard or long processes like doctor appointments or waiting for other patients to leave just to ask a simple question to the doctor easier for the patients. Offering easy and fast information or service is the key to this concept. There are various types of platforms that provide such comfort to customers that are developed by the healthcare organizations. Among these various types of platforms, Mobile and Internet-based health services (MIHS) helped patients to find the necessary information and evaluate the most suitable doctors and make online appointments for diagnosis and the treatment purposes.
2
Comparing to the traditional methods (calling the hospital in order to get an appointment or go to the hospital to get your test results), changing simple procedures like making an appointment, getting your test results or asking questions to the doctor via your phone is a huge and positive change when it comes to ease of use and time efficiency which eventually lead healthcare organizations to have more satisfied patients and an opportunity in order to improve their service in a better way by using the feedback that they procure from patients who use the MIHS platforms.
1.1 Purpose of the Study
The success of the MIHS system that is provided by the healthcare organizations are affected by different types of factors and these factors affect patients’ satisfaction and their intention to create Word-of-Mouth (WOM). Therefore, investigating these factors will help healthcare organizations to detect the weak spots of their MIHS and increase their service quality by improving these points so that they can make their patients more satisfied which eventually lead them to talk about the high-quality service that they experienced with other potential patients (Word-of-Mouth).
In this research factors like Facilitating Conditions, Perceived Risk, Perceived Interactivity, Perceived Usefulness, Continued Use Intention of MIHS, MIHS Performance Expectation Confirmation and their relationship with the Patients’ Satisfaction and Word-of-Mouth will be investigated.
3 2. REVIEW of the LITERATURE
2.1 Internet as an Information Tool
In the last 100 years, different kinds of technologies were developed and without any doubt, the internet and computers were the most life changing ones among them. With the help of the internet, computers allowed people to communicate with each other interactively and that changed the way of communication between people to people and companies to consumers[44]. Internet’s involvement made any kind of information more accessible which inevitably lead us to a time where people ask or search their questions online and find different types of answers from various types of platforms like social media, websites, forums or blogs. Today, on a yearly base more than 1 billion users have access to the internet and people are using this resource to communicate, gather more information and create communities to share their stories and their knowledge.
As a result of the internet’s growth as an information and communication tool, organisations and their marketers started their own strategies to attract potential customers’ interest towards their products and services by marketing themselves in this platform by various types of ways such as creating websites or social media accounts in order to provide more information about their services or create support groups or chat rooms to make themselves more accessible in the eyes of their customers. Health-care organizations were the ones who used this technology in their best interest since their way of doing things is way too complicated and challenging for consumers to understand on their own and it directly affects their quality of life which drives them to have an insatiable desire for knowledge for healthcare-related information. As a result of this desire, the term “E-health” alias “Health 2.0” (Web 2.0 in general) has come up.
4 2.2 E-health
With the improvement of technology, E-health has procured the ability of creating and accessing millions of pages of healthcare-related information which allowed consumers that are known as “E-patients” to get the needed information at anytime and anywhere and that eventually encouraged them to be more aware of their health and seek control over it and challenge the healthcare organisations accordingly[45].
The difference of E-health media from traditional media is that anyone who demands information can easily access it via different kinds of channels and platforms which means that they don’t have to wait for anything and that is what empowers patients to use it rather than the ordinary progress. The complexity of healthcare organizations the need for appointments or waiting for other patients to leave just to ask a simple question to the doctor makes the process hard and frankly unbearable which what e-health is all about. Offering easy and fast information or even service to make patients’ lives easier. Using technology for gathering more information makes patients feel more empowered in different kinds of ways. According to an article [1], 60% of the e-patients feel more empowered and safer. In the meantime, 47% of patient says that the information they gathered from e-health platforms affected their decision about a certain treatment. Which shows the obvious effect and power of e-health platforms over e-patients. With a broad array of information content and channel, E-health changed the expectations of the patients to ask new and well-informed questions to the doctors.
This desire of the knowledge of e-patients driven Healthcare Organisations to create more and more content and services via different kinds of platforms and make them feel present while it helps them to communicate with their customers in an easier way.
5
In these days almost every healthcare organization has websites and apps that provide an online appointment system, detailed information of doctors, hospitals and departments which ease some of the complex steps of healthcare providers. With those services, the patient can make and manage their appointments without even making a call or easily access any kind of information about the doctors and departments of that health organization. Websites and apps help organizations to communicate with their customers and made them feel more present in the eyes of the patients. The accessibility and easiness encourage people to use these new technologies and empowers other people to do the same as well.
While they are developing new websites and applications, most of the organisations also started contributing the source of information of the e-health by creating their own informative content such as articles, interviews and feedbacks of certain patients which eventually revealed another factor that has great importance over the marketing of the service and choice of criteria of the e-patients and that is called “Electronic Word-of-Mouth”.
2.3 Electronic Word-of-Mouth
E-patients use online health resources to gather more information from other patients, medical professionals, social groups and health organizations in order to become well-informed and healthcare organizations using social media channels to market their own agenda by posting different kinds of contextual content.
With these materials, they shared some of their patients’ stories or pieces of information of common and known diseases that can be encountered in daily life and eventually share some details about the ways of early diagnosis or the precautions that e-patients can take in order to prevent it from happening. The point of this new strategy is to market their own brand and service while gaining potential customers’ trust by providing true and precise information.
6
Healthcare services generally require highly involved customer participation and it is a type of service that is quite complex and intangible. With the help of the “Health 2.0” concept, the traditional way of doing things such as diagnosing an illness or understanding the treatment has changed and transformed into something easier and more user-friendly. Healthcare organizations adapted to the new concept by creating new platforms in order to communicate with their patients better and offer them a better and more comfortable service. Among these various type of platforms, Mobile and Internet-based health services (MIHS) helped patients to find the necessary information and evaluate the most suitable doctors and make online appointments for diagnosis and the treatment purposes. Changing these simple procedures like making an appointment or getting your test results was a huge change when you think about the traditional methods like calling the hospital in order to get an appointment or go to the hospital to get your test results.
Health 2.0 concept changed patients’ way of looking at the healthcare services and their understanding of satisfaction as well. In an online platform, patients can make an appointment according to other patients’ experiences and Word-of-Mouth (WOM) of the healthcare organization or doctors’ previous treatment results. In practice, patients creating online and offline WOM is a unique and important tool for healthcare organizations in order to promote their brand, service and even their own reputation which helps their marketing strategy to attract other patients’ attention towards their services.
7
Various types of researches show and state that there are lots of different factors that affect the WOM behavior of the patients. Some of these factors based on customer satisfaction, some psychological factors, and social interaction status.
With the development of new technologies, internet, and social networking, the concept Health 2.0 emerged and Mobile and Internet-based health services (MIHS) started increasing and eventually became a trend among the patients because of their practicality and easy use.
The success of MIHS depends on various factors that are affecting its users. For instance, doctor-patient interaction has a huge role just because it is affecting patients’ satisfaction hence their trust directly. So it is really important to create the perfect strategy in order to create satisfaction and for that, it is crucial to know the factors that influence the patients’ WOM.
Patients’ satisfaction and their intention of using the MIHS continuously are two main factors that we should be looking into since patients’ satisfaction is related to their subjective opinions about the MIHS and their willingness to continue of using the system. Previous researches stated that patients’ satisfactory is directly related to their WOM. Hence the WOM of the patients is directly influenced by patients’ satisfaction towards MIHS and their intention of using the tool in the future. It is safe to say that patients’ WOM is actually all about their perceived quality of the service. So if a hospital wants to improve its service quality hence their patients’ satisfaction they should know the factors that lie behind the structure of WOM.
If we look at this case from a different perspective we can say that patients’ WOM might affect the healthcare service quality by affecting their employees (doctors, nurses, etc.) performance. Previous researches show that online and offline WOM can actually encourage doctors to improve their work by reducing waiting times and providing useful pieces of information more quickly and easily[2]. Factors that affect patients’ WOM are complex and way too subjective depending on different variables like social and economic diversities. Therefore, degrading these factors to MIHS will allow us to investigate these factors more conveniently and interactively.
8 3. RESEARCH DESIGN
3.1 Introduction
Expectation Confirmation Theory (ECT) is generally used to explain the post-purchase or post-adoption behaviors to understand the concept of expected perceived performance of the service. The purpose behind it is really simple. Every single user has an expectation or at least an idea about how the service is going to be. If the service meets or exceeds the users’ expectations then users will be satisfied and if the other way around happens service will be dissatisfactory for them. ECT points out the positive connection or association between confirmation and satisfaction and it says that both of these factors actually affecting users in a positive way so that they keep using the service and show the same behavior.
Technology Adoption Model (TAM) is a system that models how users accept to use a new technology. TAM generally suggests that there are lots of different kind of factors that has an influence on users about that specific service.
These factors also affect the terms like “how” to use the service and “when” to use it. “Perceived Usefulness” and “Perceived Ease-of-use” are two of the most known factors in this system.
In all reason, using ECT and TAM are the two best models we can think about this project. On the other hand, an article proposes a new model which is quite like a combination of ECT and TAM and this new model is called ECT-IT [3, 4]. It is related to the continued use of information technologies (IT). Like mentioned before, ECT mostly focuses on the factors that motivate users to use the service again. In ECT-IT, the main focus is on the post-usage, importance of the post-usage expectations and perceived usefulness of post-usage. In a nutshell, the main difference between these ECT and ECT-IT is that ECT-IT focuses on post-use in general and ECT is focusing on motivating the users.
9
The objective of this study is to analyze the factors that influence online healthcare service WOM or Electronic Word-of-Mouth (e-WOM) in general. During the thesis, Expectation Confirmation Model of Information Technologies model (ECT-IT) will be used in order to achieve our goals.
3.2 Research Design and Hypothesis Development
10
3.2.1 Continued Use Intention, Satisfaction, and WOM
Once a user is finished using the service and became satisfied, we may expect two behavioral outcomes that we can also name as “post-adoption outcomes”[5]. The first one is the continuous use of the information system (IS) and the second one is to create WOM.
Continuous use of IS can be utilized as the customers’ satisfaction and if the service is satisfactory it is safe to assume that they will keep using it for a long period of time. Another outcome of the post-adoption is the WOM[6-10]. When a user got a positive experience with the IS they intend to share this knowledge and experience with the other potential users to affect their opinion at some point [11,14]. WOM can be considered as the broadcasting of the service or the product. Service customers tend to value more the information that they receive from the other users than an ordinary brochure that has been handed by the healthcare service provider because it is generally provided by friends, family, classmates rather than a corporation. Therefore, it is considered more reliable and trustworthy. Hence WOM is considered one of the most affecting ways to reach other potential customers and it is a resource that has an influence on customers’ evaluation process on services and products.
WOM is a really important tool when it comes to influencing customers’ behavior. Users generally share their thoughts and experiences via their social circle such as family, friends, etc.. Previous researches state that a customers’ loyalty or their commitment to a certain product, a service or a service provider can be determined by their willingness to recommend the mentioned service to other potential users. It has been proven by Cheo and Patrick[15] that there is a relationship between repurchase intentions and WOM. For the IS side, various types of research found and stated that the relationship between WOM and the use intention of IS.
11
Additionally, some researches mention that satisfaction is a really important factor when it comes to motivating customers’ WOM behavior about various types of things such as service quality, price perception, loyalty and many more.
When we consider all the previous researches [11-15] that mentioned before, we can state that satisfaction and continued intention to use of MIHS have a great effect on consumers’ WOM behavior which leads us to our study’s first two hypotheses;
Hypothesis 1 (H1): Patients’ satisfaction has a positive effect on patients’ WOM towards MIHS.
Hypothesis 2 (H2): Patients’ continued intention use has a positive effect on patients’ WOM towards MIHS.
3.2.2 Expectation Confirmation Model of Information Technology (ECM-IT)
As it has been mentioned previously ECM-IT mostly focuses on the post-adoption stage of IS and users’ motivation for continued use intentions. ECM-IT model that is developed by Bhaffatacherjer generally states that users’ satisfaction has a great influence on continued use intention and this theory is also supported by prior experimental research [16, 17]. The research states that users’ satisfaction directly affects IT continued use. Additionally, one research specifically [18] states that expectancy has a significant and affecting role when it comes to using intention and perceived usefulness of the users. Satisfaction, in general, has great importance and affects different factors in different kinds of ways.
ECM-IT model developed to understand the factors that affect post-adoption behaviors and the main purpose of MIHS is to help patients to obtain the knowledge that they are seeking more easily, make complex procedures more user-friendly and of course, provide feedback to the hospitals so that they can improve their services[19].
12
Satisfaction level usually evaluated by comparing other service experiences or products with the expectation before and after using or purchasing the specific service or product. If the experience is better than the expectation then customers feel satisfied with the product or service. Prior researches state that IT provides useful information in order to improve the satisfaction level of the customers[20]. Healthcare organizations may develop MIHS with the expectation of improving the efficiency of the service, avoiding long waiting lines, communicating about the suggestions that are related to healthcare organizations and many more. When we are talking about the internet healthcare context or E-health materials in general, it is reasonable to deduce if a patient is satisfied with MIHS, they will keep using that specific internet healthcare service. In the meantime, if a patient is satisfied with the service and their expectations are confirmed, their idea of perceived usefulness and satisfaction about MIHS for various types of tasks such as online registration, payment, consultation, feedback, diagnosis, and related inspections, etc. will be enhanced. Platforms like this improved the efficiency of healthcare [21, 22]. If a patient thinks that MIHS is useful for them in a way that makes standard procedures like registration or payment easier, they will probably leave the service with the satisfaction which will empower them to keep using the service in the future [23]. So we hypothesize that;
Hypothesis 3 (H3): Patients’ satisfaction with MIHS has a positive effect on patients’ continued use intention.
Hypothesis 4 (H4): Patients’ confirmation with MIHS performance expectation has a positive effect on patients’ satisfaction with MIHS.
Hypothesis 5 (H5): Patients’ confirmation with MIHS performance expectation has a positive effect on their perceived usefulness of MIHS.
Hypothesis 6 (H6): Perceived usefulness of a patient has a positive effect on patients’ satisfaction with MIHS.
Hypothesis 7 (H7): Perceived usefulness of a patient with MIHS has a positive effect on their continued use intention.
13
3.2.3 Facilitating Conditions, Perceived Risk and Perceived Interactivity
3.2.3.1 Perceived Interactivity
Interactivity can be defined as the communication process between a specific technology and its users. One specific prior research defines interactivity as “users perceive their experiences as a simulation of interpersonal interaction…”[24]. It is a new way of communicating or message exchange method that affects the users’ perception after using a product or a service[25, 26]. Interactivity is one of the most important key advantages that internet offers. Several pieces of research focused on how interactivity can affect users’ post reactions in terms of continued use intention and satisfaction. One research, in particular, stated that interactive features like easy communication empower users to share and even comment[27]. Some of the previous researches stated that there might be a relationship between interactivity and usability. If an IT can offer enough and effective interactivity users who use that specific service will probably have an easy time using it which enhances the usability level of the service. There are lots of examples on this case just like research stated that the interactivity of a hotel website empowers its users to revisit or reuse the website[28].
Of course, our focus on this study is the interaction of the online healthcare service or MIHS. We will specifically investigate the relationship between a user’s perception of interactivity and MIHS in terms of facilitating interactions between managerial or medical staff since it is the core of the MIHS design.
We will also discuss the theoretical relationship between perceived interaction and continued use intention in terms of interactive mobile-internet based platforms that developed for medical services like hospitals. Just like for most of the communication systems and technologies, interactivity has great value over customers’ experience throughout the service.
14
MIHS helps patients to get easy service and allows them to participate even more during their time in the service. Live chat boxes, online messages, feedbacks and evaluations of the system are just a few of the communication channels that MIHS offers so that patients can communicate with medical staff and use support services more easily.
As we mentioned before when we talk about interactivity we can also discuss its relationship with usefulness so in that case, it is logical for us to consider the importance of the patients’ perceived ease-of-usefulness during our investigation. There are lots of different factors that affect users’ willingness to adopt the new technologies, therefore, finding the right factors that eventually lead users whether to continue or discontinue using the specific service is quite critical for this research. ECM-IT model helps us to understand the post-adoption behaviors of IT usage.
Mobile-Internet based healthcare services is a new kind of technology that gains popularity and participation in our daily lives day by day. Its usage allows us to do a wide range of activities that are both work-related and fun. Interactivity is the key component of MIHS when it comes to evaluating the experience that it offers. The interaction is not only with medical staff but also with plugins, messages, and links that help patients to access new information easily [29]. The positive outcome that is caused by interactivity will enhance the perception of the usefulness of the patients and motivate them to continue using the specific service[29, 30]. Therefore, we hypothesize;
Hypothesis 8 (H8): Perceived interactivity has a positive effect on MIHS’s perceived usefulness.
Hypothesis 9 (H9): Perceived interactivity has a positive effect on their continued use intention of MIHS.
15 3.2.3.2 Perceived Risk
The main concept of perceived risk is based on psychology and it is originally proposed by Bauer[60]. One particular research defined perceived risk as “representation of uncertainty, probabilistic potential future outlay.”[31]. If we try to simplify this definition, perceived risk is a dilemma that consumers or users have before using or purchasing a product or a service. It refers that customers’ perception of potential risk factors that are associated with the purchase or experience. Bauer believes that some uncertainties that customers have, can impact on their purchase intention[32]. If uncertainty level comes into prominence, perceived risk will increase and gain importance as well.
Previous researches defined perceived risk as consumers’ own ideas of a negative outcome or consequence. There might be a connection between perceived risk and post-adoption behaviors of users. We can use perceived risk in order to understand the users’ resistance behavior towards an IT system[33, 34].
If we look from the users’ perspective, using a MIHS system may involve different types of risk factors or variables which eventually can make users nervous when it comes to using the specific service.
The most striking feature that MIHS system offers compared to traditional healthcare service is that patients can access the platform and complete their task more quickly and easily at any time and any place as long as they have the internet connection. However, this availability and easy access can cause and bring more issues which means the MIHS system might face more of these issues compared to traditional healthcare services. Additionally, regarding the features that it offers such as online registration, billing, payment, etc., the MIHS system saves a great amount of personal information including patients’ credit card information, their conditions, their personal questions and concerns and many more.
16
All of these factors can directly affect users’ continued use intention so by considering these different factors we can hypothesize;
Hypothesis 10 (H10): Perceived risk has a negative effect on patients’ continued use intention of MIHS.
3.2.3.3 Facilitating Conditions
According to several resources, facilitating conditions is one of the most basic factors that have an effect on patients’ behaviors. Thinking it in detail, seeing an organizational structure or infrastructure in real life, existing, make patients think that they will get the support that they will need while they are using a specific service and it will make their experience more stable which will empower them to continue using the service. Particular research by Hsieh et al.[35] used a model called the Theory of Planned Behaviours to detect and define several beliefs and factors that might help us to understand the patients’ continued use intention. Some researches also stated facilitating conditions are especially important for people that are living their lives in middle or low class that we might put them as underprivileged [35]. Another research states that facilitating conditions and social networks exist and differ in divided initiatives from countries to countries[36].
A study that is published by Barnard et a. Facilitating conditions have a great effect on the intention of technology use[37]. Additionally, Liao et al. stated and backed up our theory about how facilitating conditions affect patients use intention[38].
Many hospitals that are located in developed countries such as China procured several facilitating conditions for the patients that are using the implemented MIHS in order to provide support more easily and quickly to those who need it during their experience.
17
These facilitating conditions involve support staff that assists the patients who encountered an issue and fix the issue itself, online information desk, live chat access and many more.
The main purpose is to assure the patients that they will be taken care of by the healthcare organization and this factor clears the doubts that patients might have during their experience on MIHS. A patient can easily obtain service support if something goes wrong and with facilitating conditions they will also know how to proceed in a case like this. Every resource that we mentioned before will allow customers to be more comfortable and it will help them to use the MIHS in any way they want. With all the learning and questioning opportunities, the patients will feel more encouraged and it will definitely affect their intention to use this service in the future. Hence, we can hypothesize;
Hypothesis 11 (H11): Facilitating conditions have a positive effect on patients’ continued use intention of MIHS.
3.3 Research Methodology
3.3.1 Implementation of MIHS and Its Use
Most of the healthcare organizations in Turkey started to implement and use the MIHS systems at the beginning of the 2012s. Almost every single one of the doctors and workers were assigned to promote these systems therefore, the use of the system became quite popular in a short period of time.
With time most of the patients started to share their experiences and promoted the MIHS as well. Here are the benefits of the MIHS system that allows patients to have a better experience;
18
a) Patients can access the MIHS system anywhere and anytime as long as they have internet service. There are lots of information about doctors’ availability and their schedule that are available for the patients so that they can arrange a meeting and plan their schedules to arrange an examination or meeting with the doctor.
They can search the doctor that they want to have an appointment and then select the time slots that are available for the doctor as well. They can complete the registration process and for some of the services patients even can pre-pay the service instead of waiting for long waiting lines.
b) Some of the healthcare organizations conduct a post-operational evaluation process via the MIHS in order to track the patient's’ status after a specific experience or operation. Patients can share their thoughts about the procedures or symptoms and ask for medical advice from doctors or other medical staff. They can also discuss their health status and ask advice for some of the post-operational treatment options such as rehabilitation, precautions, etc..
c) Patients can access their medical history by using the MIHS systems so that they can keep track of the operations that they went through or even find and share some of the test results with other medical staff of the other healthcare organizations. This feature helps patients to stay more organized even though they don’t deliberately try.
d) Patients can access their medical bill history and expense information such as registration fees, drug fees, operation fees or postoperative treatment fees, etc. via MIHS. Patients can print out their these documents and voice their concerns if there is one. This feature helps them to track the needed process and its outcomes.
19
e) Patients can also evaluate their own experiences in terms of doctors, nurses, departments or facilitating conditions in general and share their satisfaction level. They can write detailed information or they can participate in a survey that has been developed by the service provider itself so that they can easily share specific details about specific departments or doctors. As an outcome hospitals can conduct a satisfaction data analysis out of these surveys or detailed information and find better ways to improve their service in the best way possible.
3.4 Measures
Measures for all of the variables that we are about to mention have been taken from previous researches and studies and properly adapted to our topic which is healthcare. In this study, we evaluate eight different variables which are Facilitating Conditions, Perceived Risk, Perceived Interactivity, Perceived Usefulness, Continued Use Intention of MIHS, MIHS Performance Expectation Confirmation, Patients’ Satisfaction with MIHS and Electronic Word-of-Mouth. The Likert scale is used for the questionnaire from 1 (strongly disagree) to 5 (totally agree). The participants chose the level of their concordance to that specific statement.
In order to measure the Facilitating Conditions, we used a three-item scale that is adapted from previous researches[73]. Perceived Interaction was measured with a three-item scale. Perceived Risk was measured with a three-item scale. Perceived Usefulness was measured with a five-item scale. Continued Use Intention of MIHS was measured with a two-item scale. MIHS Performance Expectation Confirmation was measured with a four-item scale. Patients’ Satisfaction with MIHS was measured with a four-item scale.
20
Electronic Word-of-Mouth was measured with a seven-item scale. All of these items were adapted from previous researches to be more convenient for the topic of healthcare. The measurement items are listed in Table 1.
After spending lots of time gathering and compiling the most suitable questions from different researches, we finally created our questionnaire and translate it in Turkish and started to share our questionnaire via different platforms.
21
22
23 3.5 Sample and Data Collection
In order to confirm the research model and hypothesis, we conducted a survey so that we can find out which one of the features of the MIHS system was the most popular one and understand if patients were satisfied with the experience. To conduct this survey we first researched and found relative articles about the items that have an effect on patients’ satisfaction. After determining the items and created the hypothesis, we started to search for relative questions and eventually translated them into Turkish since we are trying to reach the Turkish participants. Finally, we created our survey in digital and start to share it.
We simply collected our data by using the snowball sampling technique. Firstly we reached university students and asked them to share the survey for us. Secondly, we shared the research with colleagues, friends, and family and asked them to spread it on our behalf. Lastly, we contacted different social media groups that have different interests such as medical and academical, etc.. Thus we got to reach different kinds of people that have different professions, ages, and lifestyles. In conclusion, we gather our data from 256 participants in total which is enough for what we are trying to accomplish.
After a day of investigating we detected that some of the participants answered half of the survey so we removed their questionnaire from our data pool. In total, we gather 247 valid and usable questionnaires.
24 4. RESEARCH FINDINGS
In order to analyze the data that we collected, we used SPSS version 20.0 (Statical Package for Social Sciences) computer program. The statistical analysis methods that are used for this research are frequency analysis, factor analysis, reliability analysis, and regression analysis.
Frequency analysis was applied in order to describe the demographic features and MIHS purpose of the use of the participants.
The rest of the analysis methods were used to understand whether the data that we collected was reliable or not and reveal the correlations between dependent and independent variables so that we can prove if the hypotheses or the proposed research model that mentioned before are proven or not.
4.1 Frequency Analysis for Demographic Features
Descriptive statistics that are used for the survey participants were gender, age, education level and participants’ MIHS purpose of use. The results are shown in Table 2 and Table 3.
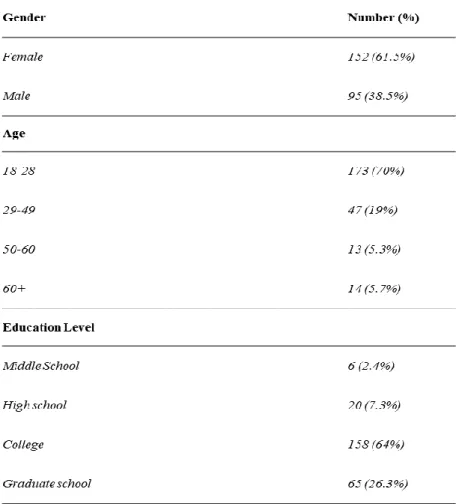
The gender of the participants consists of females and males. In final scores, it is seen that 61.5% (152) of our participants are female whereas 38.5% (95) are male.
The age of the participants is ranged in 4 classes which were 18-28, 29-49, 50-60 and 60+. When we look at the results, most of the participants are between the ages of 18-29 (70%) and the remaining rates are distributed as 29-49 (19%), 50-60 (5.3%) and 50-60+ (5.7%).
The education level of the participants is ranged as Middle School, High School, College, and Graduate School. The majority of the participants with the 158 people have a bachelor’s degree (64%) while 65 people have a postgraduate diploma (26.3%), 20 people have a high school diploma (7.3%) and 6 people have a middle school diploma (2.4%).
25
Table 2: Demographic features of the participants
4.2 Frequency Analysis for MIHS Purpose of Use
Other than demographic questions, we added one more question at the beginning of the questionnaire in order to understand and reveal the most popular function that most of the MIHS system offers.
The question was a multiple-choice question so a participant can choose more than one option since MIHS systems offer multiple functions and advantages. The results are shown in Table 3.
According to the results, it seems like the most popular function that MIHS system offers is the online registration service.
26
211 of our participants are using the MIHS to register online (85.4%) while 121 of our participants are using it in order to access their test results and evaluations (49%), 48 of them are using it for the payment and billing purposes (19.4%), 32 of them are using it to evaluate their experience and the medical staff (13%) and 26 of them are using it for direct interaction with the medical staff (10.5%).
Table 3: Participants’ MIHS Purpose of Use
4.3 Factor and Reliability Analysis
Factor analysis is a useful analysis method to investigate variable relationships. The main purpose is to reduce a large number of variables into a fewer number of factors so that we can analyze our items more easily. Factor analysis helps us to detect the number of variables that are related to each other. In its core, it defines the relationship between the factors. Other analysis methods such as regression and correlation generally focus on the relationship between an independent and a dependent factor yet factor analysis takes things one step ahead at the beginning of the data analysis by allowing us to reveal the hidden patterns and show how those patterns coincide with each other and also allows us to see which characteristics were shown in multiple patterns.
27
Another use of this analysis is that it allows us to observe and set the same variables into different groups according to their similarities which are called factors. The complex data can be simplified by using this method.
The Kaiser-Meyer-Olkin (KMO) and Bartlett's test of sphericity are two measures that show us whether the sample is competence enough to further analysis or not. KMO shows the ratio of the differences in variables and reveals the underlying factors that might cause it. The value ranges between 0 and 1. The more the value is closer to 1 the more the sample’ competency level is high and the value of 0.5 is considered minimum[41]. Bartlett's test shows whether the variables are unrelated or irrelevant so that we can detect the variables that are unsuitable to detect a pattern[41]. The highest level of the p-value is considered 0.05.
In addition to KMO and Bartlett’s test measures, Cronbach’s Alpha measure is also needed in order to check whether the factors are reliable or not. The value should be at least 0.7[42].
28
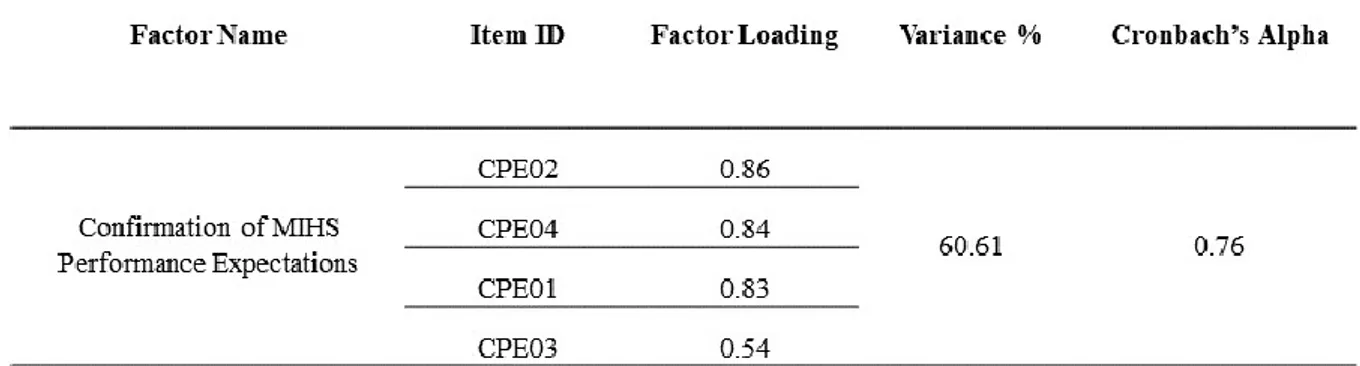
4.3.1 Factor and Reliability Analysis of Confirmation of MIHS Performance Expectation
We obtained the Kaiser-Meyer-Olkin (KMO) and Bartlett's test measures after the factor analysis applied. The results of the tests (KMO=0.636, x2 Bartlett’s test 386.78) were satisfactory. The diagonals of the Anti-image correlation were all over the limit which is 0.50 which means every single item in the factor analysis was suitable to be involved. There was no need to exclude any of them. Additionally, the reliability test was applied and Cronbach's Alpha measure was obtained. The result was 0.76 which means that the factor is reliable since it is higher than the 0.70. The total variance level of the factor is 60.61%.
Table 4: Factor and Reliability Analysis of Confirmation of MIHS Performance
29
4.3.2 Factor and Reliability Analysis of Facilitating Conditions
We obtained the Kaiser-Meyer-Olkin (KMO) and Bartlett's test measures after the factor analysis applied. The results of the tests (KMO=0.683, x2 Bartlett’s test 287.12) were satisfactory. The diagonals of the Anti-image correlation were all over the limit which is 0.50 which means every single item in the factor analysis was suitable to be involved. There was no need to exclude any of them.
Additionally, reliability tests were applied, and Cronbach's Alpha measure was obtained. The result was 0.82 which means that the factor is reliable since it is higher than the 0.70. The total variance level of the factor is 73.64%.
30
4.3.3 Factor and Reliability Analysis of Intention of Continued Use of MIHS
We obtained the Kaiser-Meyer-Olkin (KMO) and Bartlett's test measures after the factor analysis applied. The results of the tests (KMO=0.500, x2 Bartlett’s test 161.00) were satisfactory. The diagonals of the Anti-image correlation were all over the limit which is 0.50 which means every single item in the factor analysis was suitable to be involved.
There was no need to exclude any of them. Additionally, reliability tests were applied and Cronbach's Alpha measure was obtained. The result was 0.82 which means that the factor is reliable since it is higher than the 0.70. The total variance level of the factor is 84.73%.
31
4.3.4 Factor and Reliability Analysis of Perceived Interactivity
We obtained the Kaiser-Meyer-Olkin (KMO) and Bartlett's test measures after the factor analysis applied. The results of the tests (KMO=0.715, x2 Bartlett’s test 237.89) were satisfactory. The diagonals of the Anti-image correlation were all over the limit which is 0.50 which means every single item in the factor analysis was suitable to be involved. There was no need to exclude any of them. Additionally, reliability tests were applied and Cronbach's Alpha measure was obtained. The result was 0.81 which means that the factor is reliable since it is higher than the 0.70. The total variance level of the factor is 72.16%.
32
4.3.5 Factor and Reliability Analysis of Perceived Risk
We obtained the Kaiser-Meyer-Olkin (KMO) and Bartlett's test measures after the factor analysis applied. The results of the tests (KMO=0.719, x2 Bartlett’s test 261.95) were satisfactory. The diagonals of the Anti-image correlation were all over the limit which is 0.50 which means every single item in the factor analysis was suitable to be involved. There was no need to exclude any of them. Additionally, reliability tests were applied and Cronbach's Alpha measure was obtained. The result was 0.82 which means that the factor is reliable since it is higher than the 0.70. The total variance level of the factor is 73.75%.
33
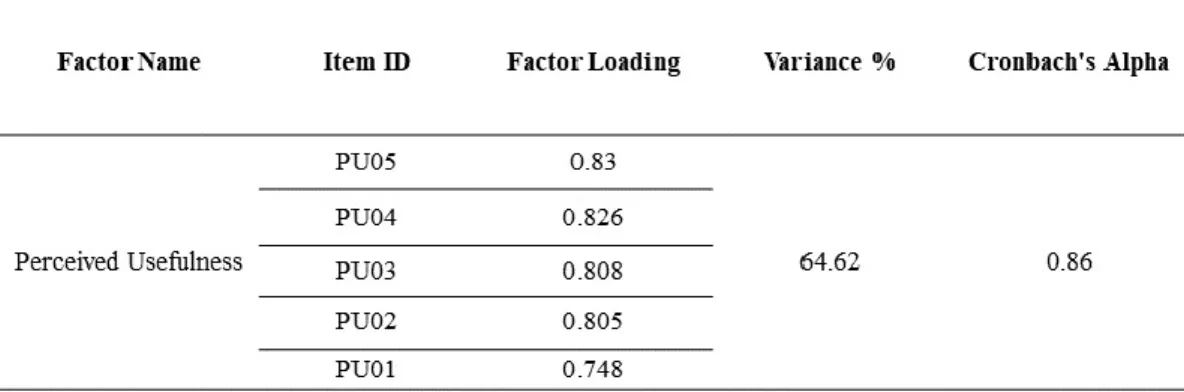
4.3.6 Factor and Reliability Analysis of Perceived Usefulness
We obtained the Kaiser-Meyer-Olkin (KMO) and Bartlett's test measures after the factor analysis applied. The results of the tests (KMO=0.806, x2 Bartlett’s test 581.09) were satisfactory. The diagonals of the Anti-image correlation were all over the limit which is 0.50 which means every single item in the factor analysis was suitable to be involved. There was no need to exclude any of them. Additionally, reliability tests were applied and Cronbach's Alpha measure was obtained. The result was 0.86 which means that the factor is reliable since it is higher than the 0.70. The total variance level of the factor is 64.62%.
34
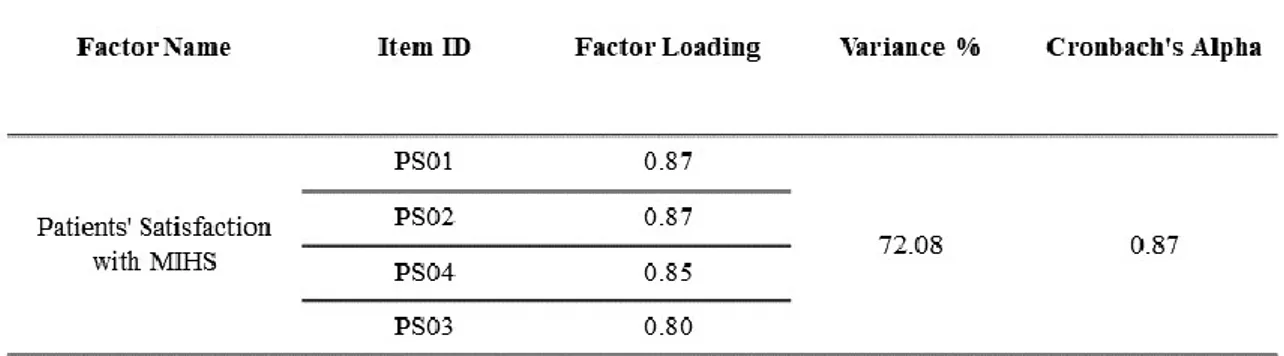
4.3.7 Factor and Reliability Analysis of Patients' Satisfaction with MIHS
We obtained the Kaiser-Meyer-Olkin (KMO) and Bartlett's test measures after the factor analysis applied. The results of the tests (KMO=0.742, x2 Bartlett’s test 559.65) were satisfactory. The diagonals of the Anti-image correlation were all over the limit which is 0.50 which means every single item in the factor analysis was suitable to be involved. There was no need to exclude any of them. Additionally, reliability tests were applied and Cronbach's Alpha measure was obtained. The result was 0.87 which means that the factor is reliable since it is higher than the 0.70. The total variance level of the factor is 72.08%.
35
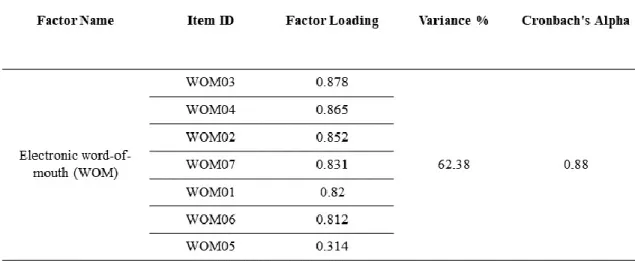
4.3.8 Factor and Reliability Analysis of Electronic word-of-mouth (WOM)
We obtained the Kaiser-Meyer-Olkin (KMO) and Bartlett's test measures after the factor analysis applied. The results of the tests (KMO=0.859, x2 Bartlett’s test 1109.81) were satisfactory. The diagonals of the Anti-image correlation were all over the limit which is 0.50 which means every single item in the factor analysis was suitable to be involved. There was no need to exclude any of them. Additionally, the reliability tests were applied and Cronbach's Alpha measure was obtained. The result was 0.88 which means that the factor is reliable since it is higher than the 0.70. The total variance level of the factor is 62.38%.
36 4.4 Correlation
The point of applying a correlation analysis to your sample is to see the closeness level of the relationships that are between different multiple variables. It is generally used when a researcher tries to detect a possible relation between the variables and it is generally applied before the regression analysis. If a relation is detected between variables than the next step would be applying a regression analysis to see whether the variables are connected with each other.
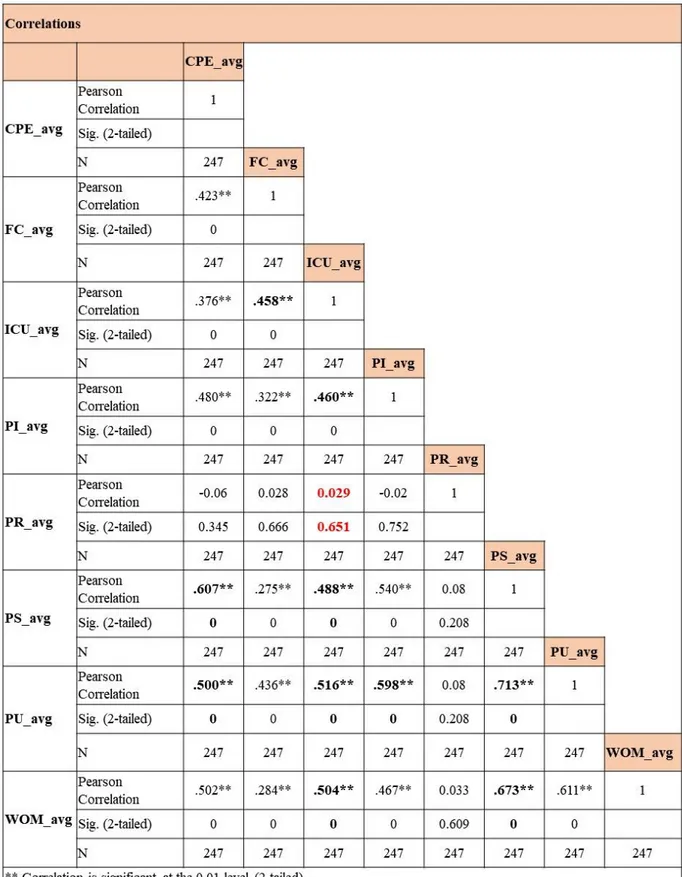
In this case correlation has been applied to all of the variables (Facilitating Conditions, Perceived Risk, Perceived Interactivity, Perceived Usefulness, Continued Use Intention of MIHS, MIHS Performance Expectation Confirmation, Patients’ Satisfaction with MIHS and Electronic Word-of-Mouth) and see if the variables that are mentioned in the hypothesis are correlated or not. The correlations values that we looked for are marked as bold in Table 12 and the results are explained below;
● The correlation between ICU and CPE seems positive with the value of 0.458 (2-tailed=0). With the 2-tailed value being 0 it seems the correlation is significant.
● The correlation between ICU and PI seems positive with the value of 0.460 (2-tailed=0). With the 2-tailed value being 0 it seems the correlation is significant.
● It seems like there is no correlation between PR and ICU with the value of 0.029 (2-tailed=0.651). The 2-tailed value is also high which means the correlation between these two variables is not significant. As a result there is no need to apply the regression process for these two factors.
● The correlation between Ps and CPE seems positive with the value of 0.607 (2-tailed=0). With the 2-tailed value being 0 it seems the correlation is significant.
37
● The correlation between ICU and PS seems positive with the value of 0.488 (2-tailed=0). With the 2-tailed value being 0 it seems the correlation is significant.
● The correlation between PU and CPE seems positive with the value of 0.500 (2-tailed=0). With the 2-tailed value being 0 it seems the correlation is significant.
● The correlation between ICU and PU seems positive with the value of 0.516 (2-tailed=0). With the 2-tailed value being 0 it seems the correlation is significant.
● The correlation between PU and PI seems positive with the value of 0.598 (2-tailed=0). With the 2-tailed value being 0 it seems the correlation is significant.
● The correlation between PU and PS seems positive with the value of 0.713 (2-tailed=0). With the 2-tailed value being 0 it seems the correlation is significant.
● The correlation between WOM and ICU seems positive with the value of 0.504 (2-tailed=0). With the 2-tailed value being 0 it seems the correlation is significant.
● The correlation between WOM and PS seems positive with the value of 0.673 (2-tailed=0). With the 2-tailed value being 0 it seems the correlation is significant.
Except for two of our variables (Perceived risk and Intention of Continued Use), all of our variables seem positively correlated with each other and therefore we can apply regression analysis to them. Because of the value of the PR is so low and 2-tailed value is quite high we don’t need to apply any further analysis such as regression analysis to it since there is no correlation.
38
39 4.5 Regression
The purpose of the regression analysis helps us to understand and define two things in general. Which of the variables affects the outcome in a really significant way and does the variables do a good job when it comes to predicting the outcome. It reveals the answers to the questions such as “Which factors affecting the outcome the most?” and “Does the factors interact with each other and if so how?”.
There are two types of variables that we can talk about when it comes to regression analysis. Independent and dependent variables. Independent variables are the ones that researchers intent to observe and investigate so that they create a hypothesis in order to find their relations with a dependent variable. Dependent variables are the ones that wanted to be examined as an outcome. If there is a relationship between more than one independent variable and one dependent variable, multiple regression analyses had to be applied. If there is a relationship between only one independent variable and one dependent variable at that case linear regression analysis had to be applied.
4.5.1 Multiple Regression Analysis of H1, H2, H4, H5, H6, H8, H9, H10 and H11
Multiple regression analyses were performed in order to find the relationship between Facilitating Conditions, Perceived Risk, Perceived Interactivity, Perceived Usefulness, Continued Use Intention of MIHS, MIHS Performance Expectation Confirmation, Patients’ Satisfaction with MIHS and Electronic Word-of-Mouth. The first one to evaluate the relationship between Facilitative Conditions, Perceived Interaction, Perceived Risk and Continued Use Intention of MIHS (H9, H10, and H11).
40
The second one is to evaluate the relationship between Perceived Interaction, MIHS Performance Expectation Confirmation and Perceived Usefulness (H5 and H8) and the third one is to evaluate the relationship between Perceived Usefulness, MIHS Performance Expectation Confirmation and Perceived Satisfaction (H4 and H6).
Multiple Regression Analysis of H1 and H2
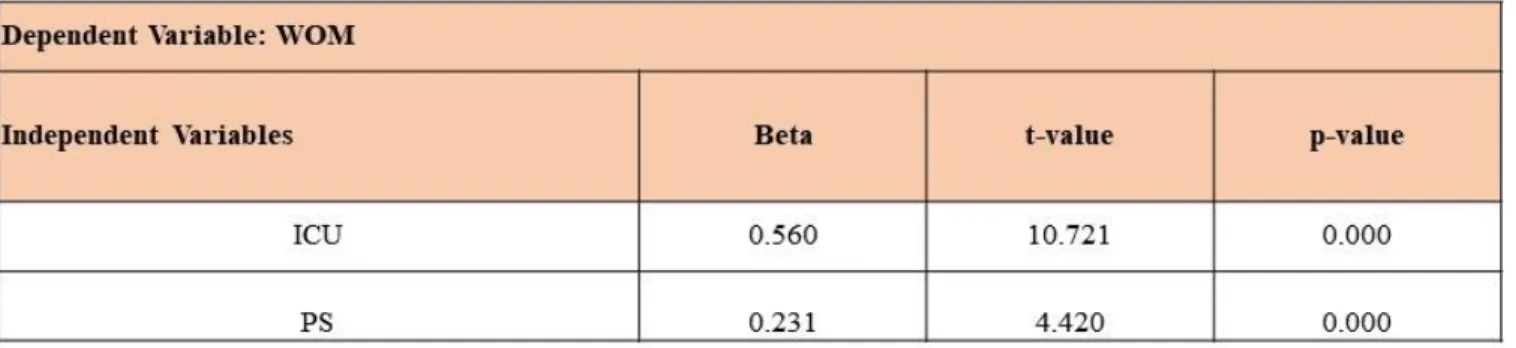
The results are shown in Table 13 Continued Use Intention (ICU) and Perceived Satisfaction (PS) have a relationship with Word-of-Mouth (WOM). The Explanatory power of the model measured 49.3%. (R=0.702, R2=0.493, p=0.000).
Table 13: Multiple Regression of H1 and H2
As it is seen from Table 13, the interaction between ICU and WOM (β=0.560, p=0.000) is way higher than the interaction between PS with WOM (β=0.231, p=0.000).
41
Figure 2: Multiple Regression of H1 and H2
Multiple Regression Analysis of H9, H10, and H11
The results are shown in Table 14, Facilitating Conditions (FC) and Perceived Interaction has a relationship with Continued Use Intention (ICU). However, we can’t say the same thing for Perceived Risk. The Explanatory power of the model measured 31.9%. (R=0.565, R2=0.319, p=0.000).
Table 14: Multiple Regression of H9, H10, and H11
As it is seen from Table 14, the interaction level of FC with ICU (β=0.348, p=0.000) and PI with ICU (β=0.346, p=0.000) are quite similar.
42
As it has been seen in the results of the correlation analysis Table 12 Perceived Risk doesn’t have any interaction with the ICU whatsoever.
Figure 3: Multiple Regression of H9, H10, and H11
Multiple Regression Analysis of H5 and H8
The results are shown in Table 15, Perceived Interaction (PI) and Performance Expectation Confirmation (CPE) have a relationship with Perceived Usefulness (PU). The Explanatory power of the model measured 41.7%. (R=0.646, R2=0.417, p=0.000).
43
As it is seen from Table 15, the interaction between PI and PU (β=0.465, p=0.000) is way higher than the interaction between CPE with PU (β=0.277, p=0.000).
Figure 4: Multiple Regression of H5 and H8
Multiple Regression Analysis of H4 and H6
The results are shown in Table 16, Perceived Usefulness (PU) and Performance Expectation Confirmation (CPE) have a relationship with Perceived Satisfaction (PS). The Explanatory power of the model measured 59.2%. (R=0.770, R2=0.592, p=0.000).
44
As it is seen from Table 16, the interaction between PU and PS (β=0.546, p=0.000) is way higher than the interaction between CPE with PS (β=0.334, p=0.000). But each of the values is quite high and satisfactory.
Figure 5: Multiple Regression of H4 and H6
4.5.2 Linear Regression Analysis of H3
A simple regression analysis was performed in order to find the relationship between Continued Use Intention of MIHS and Patients’ Satisfaction with MIHS. As it is shown in Table 17, Patients’ Satisfaction (PS) and Continued Use Intention (ICU) have a relationship with each other. The Explanatory power of the model measured 23.8%. (R=0.488, R2=0.238, p=0.000).
45
By evaluating the results that can be seen in Table 17, Patients’ Satisfaction and Continued Use Intention has a positive and moderate relation with each other (β=0.488, p=0.000).
Figure 6: Linear Regression of H3
4.5.3 Linear Regression Analysis of H7
A simple regression analysis was performed in order to find the relationship between Continued Use Intention of MIHS and Perceived Usefulness. As it is shown in Table 18, Perceived Usefulness (PU) and Continued Use Intention (ICU) have a relationship with each other. The Explanatory power of the model measured 26.6%. (R=0.516, R2=0.266, p=0.000).
46
By evaluating the results that can be seen in Table 18, Perceived Usefulness and Continued Use Intention has a positive and moderate relation with each other (β=0.516, p=0.000).
47 4.6 Hypothesis Results
In conclusion of several analyses that are mentioned, the hypothesis that are rejected and accepted are shown at the table below;
48 5. CONCLUSION
Purpose of this research was to detect and investigate the factors that will help healthcare organizations to detect the weak spots of their MIHS and increase their service quality by improving these points so that they can make their patients more satisfied which eventually lead them to talk about the high-quality service that they experienced with other potential patients (Word-of-Mouth).
Several factors such as Facilitating Conditions (FC), Perceived Risk (PR), Perceived Interactivity (PI), Perceived Usefulness (PU), Continued Use Intention of MIHS (ICU), MIHS Performance Expectation Confirmation (CPE), Patients’ Satisfaction with MIHS (PS) and Word-of-Mouth were investigated. In some cases, the variables were independent As it can be seen in the Proposed Research Model (Figure 1) several relationships were investigated. Such as;
● Relationship of FC, PR, and PI (as independent variables) with Continued Use Intention (ICU) (as dependent variables).
● Relationship of CPE and PI (as independent variables) with PU (as dependent variables).
● Relationship of PU and CPE (as independent variables) with PS (as dependent variables).
● Relationship of PS and ICU (as independent variables) with WOM (as dependent variables).
● Relationship of PU (as independent variables) with ICU (as dependent variables).
● Relationship of PS (as independent variables) with ICU(as dependent variables).
An online survey was conducted. The sample was collected by using the snowball sampling technique. As a result, 256 different people participated in the survey and their data were collected. 61.5% (152) of our participants were female whereas 38.5% (95) were male.
49
Most of the participants are between the ages of 18-29 (70%) and the remaining rates are distributed as 29-49 (19%), 50-60 (5.3%) and 60+ (5.7%). The education level of the participants was; 158 people have a bachelor’s degree (64%) while 65 people have a postgraduate diploma (26.3%), 20 people have a high school diploma (7.3%) and 6 people have a middle school diploma (2.4%). Results showed that the most popular function that MIHS system offers is the online registration service. 211 of our participants are using the MIHS to register online (85.4%) while 121 of our participants are using it in order to access their test results and evaluations (49%), 48 of them are using it for the payment and billing purposes (19.4%), 32 of them are using it to evaluate their experience and the medical staff (13%) and 26 of them are using it for direct interaction with the medical staff (10.5%).
The SPSS version 20.0 (Statical Package for Social Sciences) computer program was used to analyze our survey date. The statistical analysis methods such as frequency analysis, factor analysis, reliability analysis, and regression analysis were applied and used. In order to detect the number of variables that are related to each other factor analysis was applied and the Kaiser-Meyer-Olkin (KMO) and Bartlett's test of sphericity results were investigated. Additionally, reliability tests ware applied and Cronbach's Alpha measure was obtained.
Factor analysis and reliability analyses were applied for each of the variables. Results were investigated and all of the KMO measurements were above 0.05 and Cronbach's Alpha measure were all higher than the 0.70. All of the items were included, not one of them excluded. Every single item was reliable and suited for further analysis.
Correlation analysis was applied in order to see the closeness level of the relationships that are between different multiple variables. All of the items were included and the result showed that except for two of our variables (Perceived risk and Intention of Continued Use), all of our variables seems positively correlated with each other.