EGE AKADEMİK BAKIŞ / EGE ACADEMIC REVIEW Doi: 10.21121/eab.556344SS. 293 / 300 Başvuru Tarihi: 01.02.2018 • Kabul Tarihi: 21.09.2018
Evaluating the Asymmetric Effects of Production,
Interest Rate and Exchange Rate on the Turkish Stock
Prices
Üretimin, Faiz Oranın ve Döviz Kurunun Türk Hisse Senedi Fiyatlarına
Asimetrik Etkilerinin İncelenmesi
Hüseyin KAYA
1https://orcid.org/0000-0002-2231-9675
Barış SOYBİLGEN
2https://orcid.org/0000-0003-4906-1878
ABSTRACT
The relationship between stock prices and macro variables has been studied exhaustively in the literature. However, most of the studies assume that this relationship is linear. In this paper, we evaluate the asymmetric effects of production, the interest rate and the exchange rate on Turkish stock prices using non-linear autoregressive distributed lags models. We find that there are both long-run and short-run asymmetric relationships between macro variables and Turkish stock prices. Our results indicate that non-linear models can yield more plausible results compare to linear models.
Keywords: Stock Prices, macro variables, interest
rate, asymmetry, exchange rate
JEL Codes: G12, C22
ÖZET
Hisse senedi fiyatları ve makro ekonomik değişkenler arasındaki ilişki yazında etraflıca incelenmiştir. Bununla birlikte çoğu çalışma bu ilişkinin doğrusal olduğunu varsaymıştır. Bu çalışmada üretimin, faiz oranın ve döviz kurunun Türk hisse senedi fiyatlarına asimetrik etkilerini doğrusal olmayan gecikmesi dağıtılmış otoregressif modeller kullanarak değerlendirilmiştir. Çalışmada makro ekonomik değişkenler ile Türk hisse senedi fiyatları arasında hem kısa dönemli hem de uzun dönemli ilişki tespit edilmiştir. Sonuçlar doğrusal olmayan modellerin doğrusal modellere kıyasla daha anlamlı sonuçlar verdiğini göstermiştir.
Anahtar Kelimeler: Hisse senedi fiyatları, makro
değişkenler, faiz oranı, asimetri, döviz kuru
JEL Kodları: G12, C22
İD
İD
1. Introduction
The price of a stock is closely related to firm’s fun-damentals and future perspectives as well as global and domestic macro factors. For example the Arbit-rage Pricing Theory (APT), developed by Ross (1976), states that the return of a security is determined by a number of systematic factors, and the literature shows that macro-economic factors are among them (Chen et. al., 1986; Rapach, 2001; Peiro, 2016).
of the company. In a simple and general setup, these valuation models can be represented as:
where is the price of a security, is expected future dividends (free cash flows or residual income depending on the valuation method) per share conditional on available information at time , and is the discount rate. Future cash flows of a company in a
the risk premium. The monetary policy determines the risk-free rate. The monetary policy is usually specified by an interest rate rule, developed by Taylor (1993) and known as Taylor rule, in which the interest rate (policy rate) is a function of the inflation rate and the output gap. In an emerging market like Turkey, the exchange rate also plays an important role in the monetary pol-icy. For example in the monetary and exchange rate policy document of the Central Bank of Turkey (CBRT), it is clearly stated that “to limit the risks to financial
sta-bility, CBRT does not remain unresponsive to an excessive Turkish Lira appreciation or depreciation” (CBRT, 2016,
p.2). The second component of the discount rate, the risk premium, is also related to macro-economic variables. Mannonen and Oikarinen (2013) show that monetary policy aggregates, the risk-free interest rate, the term structure of interest rates, inflation, and the state of the business cycle influence the risk premium. Studies in the macro-finance literature also document that the variation of the risk premium is responsive to macro economic factors (Ang and Piazzesi, 2003; Gürkaynak and Wright 2012, Rudebush and Wu, 2008).
While plenty of research investigates the rela-tionship between macroeconomic variables and stock prices/returns (inter alia Bodurtha et al., 1989; Cheung and Ng, 1998; Fraser and Groeneworld, 2006; Groeneworld, 2004; Huang and Guo, 2008; Humpe and Mcmillian, 2009; Kwon and Shin, 1999; Lee, 1992; Louis and Eldomiaty 2010; Maysami and Koh, 2000; Muk-herjee and Naka, 1995; Nasseh and Straus, 2000), they assume that this relationship is symmetric. However, recent studies find evidence for the nonlinear relati-onship between stock returns and macroeconomic variables (Bonga-Bonga and Makkalebule, 2010; Gu-idolin et al. 2009). For example, Hiemstra and Kramer (1997) provide empirical evidence for the nonlinear causal relationship between macro factors and stock prices. Guidolin and Ono (2006) and Erdoğan and Tirk-yaki (2018) document non-linearity in the relationship between stock returns and macroeconomic variables. Guidolin et al. (2009) and Bredin, Hyde and O’Reilly (2008) show that considering the nonlinear effect of macro variables on stock returns improves the returns’ predictability. Furthermore, Cuestas and Tang (2015), Bahmani-Oskooee and Saha (2015, 2016, 2018), and
Cheah et al. (2017) document non-linearity between stock prices and the exchange rate for various count-ries.
In this study, we aim to contribute to the existing literature by examining asymmetric effects of a set of widely monitored macroeconomic variables on the Turkish stock price index namely: the industrial pro-duction index, the interest rate and the exchange rate. We employ the nonlinear autoregressive distributed lags (NARDL) model of Shin et al. (2014) which has be-come a major workhorse model for the investigation of nonlinear relationships.
The Borsa Istanbul (BIST) is the only stock exchan-ge operating on the Turkish stock market. With the total trading value, reached 13.02 trillion TL in 2016 (4.3 trillion US dollar), the BIST is one of the biggest emerging stock market. As of November 2017, the market capitalization of listed companies is 218.2 bil-lion USD. Currently, the number of traded companies on the BIST is 410 and the BIST has its own indexes, tracking the performance of top 30 (BIST30), top 50 (BIST50), and top 100 (BIST100) companies1. The rest
of the paper is organized as follows. Section two pro-vides the estimation methodology and data. Section three reports the empirical results and finally, the last section concludes the paper.
2. The Methodology and Data
In order to investigate the effect of output, the interest rate, and the exchange rate on stock prices, we use both linear autoregressive distributed lags (ARDL) models and NARDL models. Studies usually focus on linear/symmetric models to analyze the long-run relationship between macro or financial variables and stock prices. However, the recent literature on nonlinear models shows that omitting nonlinear rela-tionships between variables may cause researchers to derive biased inferences from regressions. Therefore, we adopt NARDL models to analyze the presence of asymmetric relationships between macro variables and stock prices.
First, we use the following linear error-correction model (Model 1) to analyze linear relations:
where is the Borsa Istanbul (BIST) 100 Index, is the Turkish Lira/US Dollar nominal exchange rate,
is the Turkish industrial production index, and is the 2 year benchmark interest rate2 in Turkey.
All variables are monthly and the time span is between 2003:M01 and 2017:M063 and they are obtained from
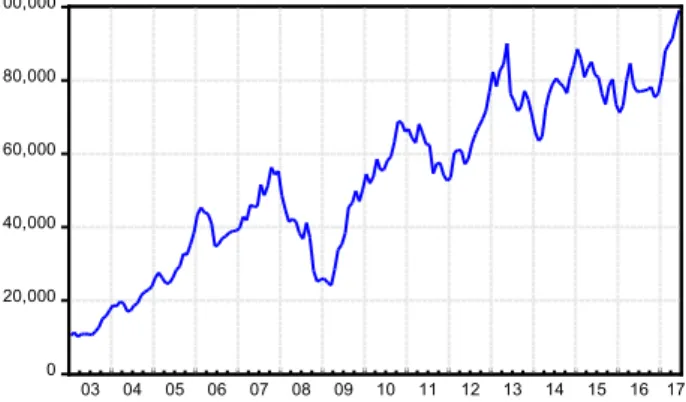
the Turkish Data Monitor (TDM). Figures 1 to 4 show the evaluation of the aforementioned variables over the considered period. Figure 1 and Figure 3 show
a constant upward trend except the decline in the 2008-2009 crisis. Figure 2 shows that the TL/$ nominal exchange rate fluctuates around 1.5 until the end of 2010, then the Turkish Lira began to depreciate rapidly. Figure 4 shows that after Turkey adopted implicit inf-lation targeting, the benchmark interest rate declined to the 10% from 60% gradually and stabilized around 10% from 2010 forward.
Figure 1: BIST100 Index
0 20,000 40,000 60,000 80,000 100,000 03 04 05 06 07 08 09 10 11 12 13 14 15 16 17
Figure 2: TL/$ nominal exchange rate
1.0 1.5 2.0 2.5 3.0 3.5 4.0 03 04 05 06 07 08 09 10 11 12 13 14 15 16 17
Figure 3: Industrial Production Index
60 70 80 90 100 110 120 130 140 03 04 05 06 07 08 09 10 11 12 13 14 15 16 17
Figure 4: Benchmark interest rate (%)
0 10 20 30 40 50 60 70 03 04 05 06 07 08 09 10 11 12 13 14 15 16 17
We use a general to specific approach to determine the lag structure. To determine the existence of co-in-tegration relationships between variables, we use the Pesaran et al. (2001) bound test. Once the cointegra-tion relacointegra-tionship is detected, are used to measure the long-run elasticities of the BIST 100 index
the short-run influence of corresponding variables on stock prices.
Secondly, we modify the Equation 1 to analyze asymmetric effects of the exchange rate on stock prices. To accomplish this task, we calculate negative and positive changes in following Shin et al.
where and are the partial sum of currency appreciations and currency depreciations in TL/$, respectively. Then, our new model (Model
2) which contains asymmetries in is defined as follows:
(2)
Shin et al. (2014) show that the cointegration relati-onship in the Equation 2 can be tested by the Pesaran et al.’s (2001) bound testing approach. In this setup, the coefficients of and and their first differences are used to investigate the existence of the asymmetric relationship between the exchange rate and the BIST 100 index in the long-run and the short-run, respectively. More specifically, shows the long-run elasticity of the BIST 100 with respect
to the exchange rate appreciation and shows the long-run elasticity with respect to the exchange rate deprecation. So, the presence of the long-run asymmetry can be determined by testing the null hypothesis of using the Wald test.
Finally, we analyze asymmetric effects of all exoge-nous variables on stock prices by using the following model (Model 3):
(3)
All the models are estimated by the ordinary least squares. In order to arrive the final specification of the NARDL models, we adopt a general-to-specific procedure as we did in the linear model.
3. Empirical Results
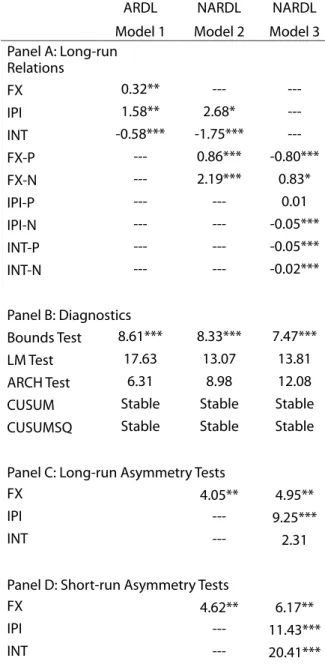
Equations 4, 5 and 6 show the estimates of Models 1, 2, and 3, respectively. Table 1 presents long-run effe-cts of exogenous variables, diagnostic tests, long-run asymmetry tests, and short-run asymmetry tests.
(4)
(5)
Table 1: Estimation Results of Linear and Nonlinear
ARDL Models
ARDL NARDL NARDL
Model 1 Model 2 Model 3
Panel A: Long-run Relations FX 0.32** --- ---IPI 1.58** 2.68* ---INT -0.58*** -1.75*** ---FX-P --- 0.86*** -0.80*** FX-N --- 2.19*** 0.83* IPI-P --- --- 0.01 IPI-N --- --- -0.05*** INT-P --- --- -0.05*** INT-N --- --- -0.02*** Panel B: Diagnostics Bounds Test 8.61*** 8.33*** 7.47*** LM Test 17.63 13.07 13.81 ARCH Test 6.31 8.98 12.08
CUSUM Stable Stable Stable
CUSUMSQ Stable Stable Stable
Panel C: Long-run Asymmetry Tests
FX 4.05** 4.95**
IPI --- 9.25***
INT --- 2.31
Panel D: Short-run Asymmetry Tests
FX 4.62** 6.17**
IPI --- 11.43***
INT --- 20.41***
According to diagnostic tests, all models seem to be specified correctly. They show no sign of serial correlation and heteroscedasticity. CUSUM tests and CUSUM of squares tests show no sign of parameter instability. Bounds tests show that there is a cointeg-ration relationship in all equations. Therefore, we can begin analyzing equations. In the first model, the IPI affects stock prices positively as expected both in the
kish lira affects stock prices negatively in the short-run but in contrast to the general logic, a depreciation in the Turkish lira seems to affect stock prices positively in the long-run. The use of asymmetric relations may improve the results.
In the equation 2, we model the FX asymmetrically. A depreciation in the Turkish Lira still causes stock prices to increase in the long-run. However in line with the expectations, an appreciation in the Turkish Lira also raises stock prices in the long-run and the sign of FX-N is much higher than FX-P. In the short-run, both FX-P and FX-N cause stock prices to decline, and like in the long-run, the sign of FX-N is much higher than FX-P. The Wald test rejects the long-run and the short-run symmetry with respect to FX, indicating that the effects of depreciation and appreciation in exchange rate on stock prices are different. These results give us more insight than linear ARDLs. Furthermore, signs of the IPI coefficient and the INT coefficient are in line with the expectations.
In the equation 3, we model all macro economic variables asymmetrically. This time, signs of the long-run coefficients of FX-P and FX-N are found to be consistent with the expectations. A depreciation in the Turkish Lira causes stock prices to decline and an appreciation in Turkish Lira raises them. However in the short-run, both FX-P and FX-N still lead to a decline in stock prices. Long-run influence of IPI-P and IPI-N are also in line with expectations. On the other hand, both IPI-P and IPI-N cause stock prices to inc-rease in the short-run. Asymmetry tests for long-run and short-run for both the IPI and the FX suggest that they are better be modelled as asymmetrical. On the other hand, long-run asymmetry test for INT indicates that effects of an increase in interest rate and a decre-ase in interest rate on stock prices are not different in magnitude. However, those affects are not same in the short-run. Both INT-P and INT-N have negative signs both in the long-run and the short-run.
4. Conclusion
In this study, we use both symmetric and asym-metric ARDL models to analyze both long-run and short-run effects of production, the interest rate and
interest rate has asymmetric effect in the short-run. Our results show that modelling the exchange rate and the industrial production index symmetrically causes us to derive wrong inferences. Thus, NARDL
emerges as a more suitable model than linear models for investigating the long-run relationship between macro variables and stock prices.
End Notes
1. http://www.borsaistanbul.com/en/data/data/consolidated-data
2. The 2 year benchmark interest rate is one of the most closely watched interest rate in Turkey. As Turkey
was a high inflation country in the 90s and in the early 2000s, bonds with longer maturities such as 5 years and 10 years was not available in Turkey for the most of 2000s. Interest rates with shorter time span are usally more volatile compared to the 2 year benchmark interest rate. Therefore, we use the 2 year benchmark interest rate in our study.
3. We use the time span after 2003 to estimate the model because Turkey adopted implicit inflation targeting
after 2002 and this reduced the inflation rate from 60% to single digit numbers in a few year. Furthermore, a series of economic reforms implemented by Justice and the Development Party after 2003 alter the structure of the economy greatly.
References
Ang, A., & Piazzesi, M. (2003) “A no-arbitrage vector autoregression of term structure dynamics with macroeconomic and latent variables” Journal of
Monetary Economics, 50(4), 745-787.
Bahmani-Oskooee, M., & Saha, S. (2015) “On the relation between stock prices and exchange rates: a review article” Journal of Economic Studies, 42(4), 707-732. Bahmani-Oskooee, M., & Saha, S. (2016) “Do exchange
rate changes have symmetric or asymmetric effects on stock prices?” Global Finance Journal, 31, 57-72. Bahmani-Oskooee, M., & Saha, S. (2018) “On the
rela-tion between exchange rates and stock prices: a non-linear ARDL approach and asymmetry analysis”
Journal of Economics and Finance, 42(1), 112-137.
Bodurtha Jr, J. N., Cho, D. C., & Senbet, L. W. (1989) “Eco-nomic forces and the stock market: An international perspective” Global Finance Journal, 1(1), 21-46. Bonga-Bonga, L., & Makakabule, M. (2010) “Modeling
stock returns in the South African stock exchange: A nonlinear approach” European Journal of Economics,
Finance and Administrative Sciences, 19, 168-177.
Bredin, D., Hyde, S. & O’Reilly, G. (2008) “Regime chang-es in the relationship between stock returns and the macroeconomy” British Accounting Association
Annual Conference, 1-25.
Cheah, S. P., Yiew, T. H., & Ng, C. F. (2017) “A nonlinear ARDL analysis on the relation between stock price and exchange rate in Malaysia” Economics Bulletin,
37(1), 336-346.
Chen, N. F., Roll, R., & Ross, S. A. (1986) “Economic forces and the stock market” Journal of Business, 59 (3), 383-403.
Cheung, Y. W., & Ng, L. K. (1998) “International evidence on the stock market and aggregate economic activ-ity” Journal of Empirical Finance, 5(3), 281-296. Cuestas, J. C., & Tang, B. (2015) “Asymmetric exchange
rate exposure of stock returns: Empirical evidence from Chinese Industries” The Sheffield Economic Research Paper Series No. 2015021.
Erdoğan, L., & Tiryaki, A. (2018) “Asymmetric Effects of Macroeconomic shocks on the Stock Returns of
Groenewold, N. (2004) “Fundamental share prices and aggregate real output” Applied Financial Economics,
14(9), 651-661.
Guidolin, M., Hyde, S., McMillan, D., & Ono, S. (2009) “Non-linear predictability in stock and bond returns: When and where is it exploitable?” International
Journal of Forecasting, 25(2), 373-399.
Guidolin, M., & Ono, S. (2006) “Are the dynamic linkages between the macroeconomy and asset prices time-varying?” Journal of Economics and Business,
58(5), 480-518.
Gürkaynak, R. S., & Wright, J. H. (2012) “Macroeconom-ics and the term structure” Journal of Economic
Literature, 50(2), 331-367.
Hiemstra, C., & Kramer, C. (1997) “Nonlinearity and endogeneity in macro-asset pricing” Studies in
Nonlinear Dynamics & Econometrics, 2(3), 61-76.
Huang, Y., & Guo, F. (2008) “Macro shocks and the Jap-anese stock market” Applied Financial Economics,
18(17), 1391-1400.
Humpe, A., & Macmillan, P. (2009) “Can macroeconomic variables explain long-term stock market move-ments? A comparison of the US and Japan” Applied
Financial Economics, 19(2), 111-119.
Kwon, C. S., & Shin, T. S. (1999) “Cointegration and cau-sality between macroeconomic variables and stock market returns” Global Finance Journal, 10(1), 71-81. Lee, B. S. (1992) “Causal relations among stock returns,
interest rates, real activity, and inflation” The Journal
of Finance, 47(4), 1591-1603.
Louis, R. J., & Eldomiaty, T. (2010) “How do stock prices respond to fundamental shocks in the case of the United States? Evidence from NASDAQ and DJIA”
The Quarterly Review of Economics and Finance, 50(3), 310-322.
Mannonen, P., & Oikarinen, E. (2013) “Risk premium, macroeconomic shocks, and information technol-ogy: an empirical analysis” International Review of
Applied Economics, 27(5), 695-705.
Maysami, R. C., & Koh, T. S. (2000) “A vector error cor-rection model of the Singapore stock
market” Inter-Nasseh, A., & Strauss, J. (2000) “Stock prices and do-mestic and international macroeconomic activity: a cointegration approach” The Quarterly Review of
Economics and Finance, 40(2), 229-245.
Peiró, A. (2016) “Stock prices and macroeconomic fac-tors: Some European evidence” International Review
of Economics & Finance, 41, 287-294.
Pesaran, M. H., Shin, Y., & Smith, R. J. (2001) “Bounds testing approaches to the analysis of level rela-tionships” Journal of applied econometrics, 16(3), 289-326.
Rapach, D. E. (2001) “Macro shocks and real stock pric-es” Journal of Economics and Business, 53(1), 5-26.
Ross, S. A. (1976) “The arbitragetheory of capital asset pricing” Journal of Economic Theory, 13(3), 341–360. Shin, Y., Yu, B., & Greenwood-Nimmo, M. (2014) “Model-ling asymmetric cointegration and dynamic multi-pliers in a nonlinear ARDL framework” In Festschrift
in Honor of Peter Schmidt (pp. 281-314). Springer
New York.
Taylor, J. B. (1993) “Discretion versus policy rules in practice” Carnegie-Rochester Conference Series on
Public Policy, 39, 195-214.
CBRT. (2016) “Monetary and Exchange Rate Policy for 2017” Available from https://goo.gl/rSSBbi