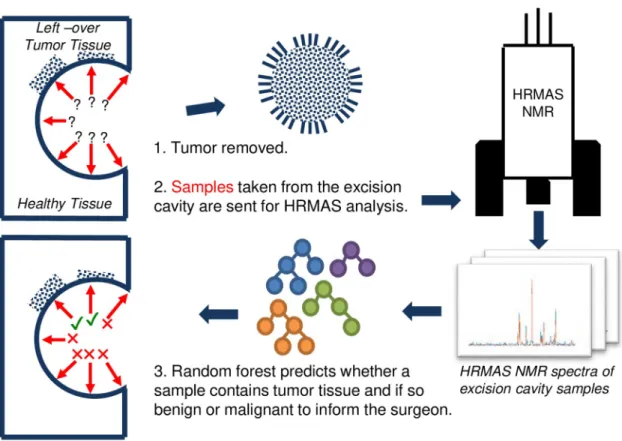
Machine learning assisted intraoperative assessment of brain tumor margins using HRMAS NMR spectroscopy
Tam metin
Şekil
Benzer Belgeler
Ba‘dehû sadran ba‘de sadrin ale’t-tertîb Resûl Bâli Sultan, Mürsel Bâli, Balım Sultan Hacı İskender Dede, Akdede, Sersem Ali Dede, Kara Halil Baba ve Vahdetî Baba,
Ocakları Boratav şu şekilde ifade etmektedir: “…Hasan Dede Ocağı, Narlıdere Ocağı deyimlerinde görüldüğü gibi, Anadolu’daki Alevi-Kızılbaş topluluklarının,
A- radan beşyüz sene geçtikten sonra Serezdeki medfeninden alınarak kemikleri bir torba içinde 1924 de İstanbul’a ge tirilmiş ve nedense Topkapı Sarayı
93 harbinde ailesile İslimiye den hicret etmiş, Göztepenin deniz tara fındaki muhacir mahallesine yerleş miş, Abdi Kâmil beyin (Şemsülma- arif) inden
Bu sözler, iki ay sonraki seçim için cumhurbaş kanlığı adaylığından söz edilen Sayın Turgut ö z a l’ın önceki günkü sözleri?. Cumhurbaşkanlığı
Türkiye’nin en eski ticarethanesi olarak 256 yıldır varlığını sürdüren Hasan paşa Fınnı Türk gastronomisine de hizmet vermiş, birçok ürün ilk kez burada
yüzyıl becerilerinden yaratıcı düşünme, eleştirel düşünme, problem çözme, iletişim ve işbirliği, bilgi okuryazarlığı, esneklik ve uyum, girişimcilik
Kağıtlar suda beş saat bekletilerek suya doyurulmuş, formül 1 ve formül 3 değirmende altmış saat öğütülmüş, sıvı çamur bünye ve kağıt karışımları beş
