Contents lists available atScienceDirect
Magnetic Resonance Imaging
journal homepage:www.elsevier.com/locate/mriOriginal contribution
A new class of cubic SPIONs as a dual-mode T1 and T2 contrast agent for
MRI
Akbar Alipour
a, Zeliha Soran-Erdem
a,1, Mustafa Utkur
a, Vijay Kumar Sharma
a,c, Oktay Algin
a,b,
Emine Ulku Saritas
a,d, Hilmi Volkan Demir
a,c,⁎aDepartment of Electrical and Electronics Engineering-National Magnetic Resonance Research Center (UMRAM), National Nanotechnology Research Center (UNAM),
Department of Physics, Bilkent University, Bilkent, Ankara 06800, Turkey
bDepartment of Radiology, Ankara Atatürk Training and Research Hospital, Ankara 06800, Turkey
cLUMINOUS! Center of Excellence for Semiconductor Lighting and Displays, School of Electrical and Electronic Engineering, School of Mathematical and Physical Sciences,
Nanyang Technological University, Singapore 639798, Singapore
dNeuroscience Program, Sabuncu Brain Research Center, Bilkent University, Ankara 06800, Turkey
A R T I C L E I N F O
Keywords:
Dual-mode MRI contrast agents
Superparamagnetic iron oxide nanoparticles MRI relaxivity
Contrast enhancement
A B S T R A C T
Superparamagnetic iron oxide nanoparticles (SPIONs) are widely used as a robust negative contrast agent on conventional MRI. In this study, we (a) synthesized a new class of cubic SPIONs as a dual-mode contrast agent in MRI and (b) showed the in-vivo feasibility of these nanaoparticles as a simultaneous positive and negative contrast agent. Relaxation properties and contrast enhancement analysis of the synthesized SPIONs with two different shapes (cubic vs. spherical) and three different sizes 7 nm, 11 nm, and 14 nm were investigated to evaluate contrast enhancement in-vitro. In-vivo MRI experiments were performed on a 3T MR scanner, where a healthy anesthetized rat was imaged before, and from 20 to 80 min after intravenous injection of 1 mg/kg of contrast agent. Representative transmission electron microscopy (TEM) images of the synthesized nanoparticles reveal that the particles are well dispersed in a solvent and do not aggregate. The in-vitro relaxivity and contrast enhancement analysis show that, among all six SPIONs tested, 11-nm cubic SPIONs possess optimal molar re-laxivities and contrast enhancement values, which can shorten the spin-lattice and spin-spin relaxation times, simultaneously. No noticeable toxicity is observed during in-vitro cytotoxicity analysis. In-vivo T1-and T2 -weighted acquisitions at 60-min post-injection of 11-nm cubic SPIONs result in 64% and 48% contrast en-hancement on the T1-and T2-weighted images, respectively. By controlling the shape and size of SPIONs, we have introduced a new class of cubic SPIONs as a synergistic (dual-mode) MRI contrast agent. 11-nm cubic SPIONs with smaller size and high positive and negative contrast enhancements were selected as a promising candidate for dual-mode contrast agent. Our proof-of-concept MRI experiments on rat demonstrate the in-vivo dual-mode contrast enhancement feasibility of these nanoparticles.
1. Introduction
Superior soft tissue contrast is a major advantage of magnetic re-sonance imaging (MRI) over alternative medical imaging modalities such as computed tomography (CT) and X-ray[1,2]. The difference of spin-lattice (T1) and spin-spin (T2) relaxation times among tissues, is
the origin of the unique soft tissue contrast in MRI. However, in some applications, difference in relaxation parameters may be insufficient to provide reliable discrimination of tissue structure. In these instances, the use of contrast agents that alter relaxivity can significantly enhance the contrast between target tissues and the background. These contrast
agents are usually in the form of T1or T2contrast agents[3–6]. T1
agents are commonly paramagnetic materials that increase longitudinal relaxivity and thereby yield higher signal levels[7,8]. While super-paramagnetic iron oxide nanoparticles (SPIONs) with ultrasmall size (e.g., around 36 nm diameter) can also be used as T1contrast agents,
currently the Gadolinium species with seven unpaired electrons are the dominant positive contrast agent used in clinical applications[9,10]. On the other hand, T2agents are typically SPIONs that induce magnetic
field perturbations and increase transverse relaxivity, which in turn reduces signal levels[11–13]. However, the difficulty in distinguishing a region of weak signal due to SPIONs from regions that suffer from
https://doi.org/10.1016/j.mri.2017.09.013
Received 19 March 2017; Received in revised form 29 August 2017; Accepted 24 September 2017
⁎Corresponding author at: Department of Electrical and Electronics Engineering, Bilkent University, Bilkent, 06800 Ankara, Turkey. 1This author has equal contribution.
E-mail address:[email protected](H.V. Demir).
0730-725X/ © 2017 Published by Elsevier Inc.
other sources of signal loss (e.g., susceptibility differences among tis-sues, B0 field inhomogeneity) is a drawback of T2 contrast agents [14–16]. One solution to this problem is to utilize SPIONs as dual-modal contrast agents. In MRI, T1-weighted images typically provide
better spatial resolution, while T2-weighted images can provide
en-hanced detection of lesions[17]. Hence, a synergistic combination of T1- and T2-contrast-enhanced imaging can potentially provide more
comprehensive imaging information and lead to higher diagnostic ac-curacy[18].
To date, numerous studies have considered developing methods for synthesizing simultaneous T1and T2contrast agents. For this purpose,
hybrid nanoparticles have recently been developed, where the Gadolinium species integrated with iron oxide nanoparticles in a core-shell format systematically demonstrated the feasibility of such hybrid probes[19]. In another study, Mn-Fe heterodoped ZnSe tetrapod na-nocrystals were proposed to simultaneously enhance contrast in both T1- and T2-weighted MRI[20]. However, the use of hybrid materials as
in these two examples may cause magnetic interactions of nano-particles, which in turn result in the perturbation of the relaxation process[21]. An alternative method for achieving dual-mode contrast agent is to utilize a single material for enabling multiple contrasts. For example, Jung et al. generated both negative and positive image con-trasts by manipulating the pulse sequences together with the use of size-controlled SPIONs[22]. In another study, T1-weighted positive contrast
obtained from SPIONs using ultrashort-echo-time was reported by Kwon et al.[23]. In the clinic, Ferumoxytol (an ultrasmall SPION) can be utilized to obtain regional T1and T2⁎signal enhancement or loss
with conventional pulse sequences [24]. However, SPION's perfor-mance as MRI contrast agents strongly depends on their size and shape. Hence, as dual-mode contrast agents are gaining interest, there is a strong need to investigate both features to reach a high performance synergistic contrast agent.
In this study, by taking advantage of the strong shape and size de-pendence of SPION's performance, we synthesized a new class of cubic SPIONs as a synergistic T1- and T2-contrast-enhancement agent for MRI.
We compared the performance of these cubic SPIONs with their sphe-rical counterparts via measurements of molar relaxivities (r1and r2) on
a 3T MRI scanner. Here, we used silica for surface modification, since previous reports showed negligible toxicity level for nano-sized silica shells. As a feasibility study, both positive and negative contrast effects of 11-nm cubic SPIONs were demonstrated in-vivo on T1- and T2
-weighted spin-echo MRI images obtained before and after intravenous injection of 1 mg/kg contrast agent trough the tail vein of a Sprague-Dawley rat.
2. Materials and methods 2.1. Theory
The magnetic properties of SPIONs are affected by their crystallinity and size, which in turn significantly affects the MR relaxivity properties of the SPIONs. Accordingly, as the particle size increases the corre-sponding saturation magnetization increases, enhancing the T2
(trans-verse) relaxation of the surrounding tissue. On the other hand, as the particle size decreases, both the surface-to-volume ratio and the per-centage of unpaired electrons on the particle surface increases. The interaction of unpaired electrons with the protons of water molecules reduces the T1(longitudinal) relaxation time of the protons and results
in MRI signal enhancement, and this effect is more pronounced for small-sized SPIONs[25]. In addition, the reduced magnetic moments of these smaller particles suppress their T2effect. Moreover, particles with
sharp surfaces (for example cubic particles) possess higher surface-to-volume ratio in comparison with spherical particles, causing them to exhibit improved T1and T2effects. Therefore, the shape anisotropy and
large effective region of magnetic cores in cubic samples can increase their T2-contrast-enhancement capabilities, and large
surface-to-volume ratio and consequently a large number of unpaired electrons on their cubic surface can increase their T1-contrast-enhancement
cap-abilities[26,27].
In the well-known form, T1and T2can be represented in terms of
their corresponding R1and R2relaxation rates, respectively[28]. The
relaxation rates are functions of unenhanced tissue relaxation rates (R10
and R20) in s− 1, longitudinal and transverse Molar relaxivities (r1and
r2) in mM− 1s− 1, and iron concentration (C) in mM. Using the standard
linear relaxivity approximation, the relaxation rate can be written as:
= + R1 R10 r . C1 (1) = + R2 R20 r . C2 (2) where = = R 1 T and R 1 T (x is either 1 or 2) x x x0 x0
In the current study, the MR contrast optimization is conducted with multi-echo spin-echo sequences and inversion recovery sequences for transverse and longitudinal relaxation estimation, respectively. Under these approximations, the T1-weighted and T2-weighted signals can be
estimated by the following equations: For longitudinal relaxation:
= ⎡ ⎣ ⎢ − − + − = ⎡ ⎣ ⎢ − − + + − +
{ }
{ }
I M 1 2 exp TI T1 exp TR T1M 1 2 exp{ TI(R r . C )} exp{ TR(R r . C )} z z0
z 0
10 1 10 1
(3) and for transverse relaxation:
= ⎧ ⎨ ⎩ − ⎫ ⎬ ⎭ = − + I M exp TE T M exp{ TE(R r . C)} xy z0 2 z 0 20 2 (4) Here, TE is the echo time, TI is the inversion time, TR is the re-petition time, and Mz0is the thermal equilibrium value of bulk
mag-netization vector. TE and TI are image acquisition parameters con-trolled by the operator. T1and T2depend on the surrounding medium
and the magneticfield strength.
As the contrast agents shorten the spin-lattice and spin-spin re-laxation times, the ratio of their molar relaxivities (α = r2/r1) is
gen-erally used to describe the dominant contrast agent features and their contrast enhancement efficiency [29]. Accordingly,α is a parameter comparing the effectiveness of T1and T2contrast mechanisms, and this
parameter strongly depends on particle properties, contrast regime, and B0field strength[30].
2.2. Materials
For the synthesis of SPIONs, the following materials were obtained from Sigma-Aldrich Chemical Co. (St. Louis, MO): oleic acid (tech 90%), iron(III) chloride hexahydrate (99.99%), Igepal-CO520 (poly-oxyethylene (5) nonyl phenyl ether), ammonia (28 wt%), tetraethyl orthosilicate (TEOS 99%) and 1-octadecene (tech 90%). Hexane, so-dium hydroxide, cyclohexane, ethanol and other reagents were ob-tained from Alfa Aesar Chemical Co. (Germany). All other chemicals were of analytic grade and used directly without further purification. 2.3. Synthesis of SPIONs
In this work, six different types of SPION samples were synthesized: 7-nm spherical, 7-nm cubic, 11-nm spherical, 11-nm cubic, 14-nm spherical, and 14-nm cubic. For the cubic nanoparticles, nanoparticle size was measured diagonally. For all samples, iron oxide nanoparticles were synthesized using a modified procedure reported by Byung et al. [15]. Briefly, 20 g (25 mL) of 1-octadecene (ODE) solution, oleic acid and freshly synthesized iron-oleate were stirred in a three-neck bottle
flask and degassed at 70 °C for 2-hour under vacuum. Then, the tem-perature of the reaction mixture was increased to 320 °C with constant heating rates of 3.3 °C min− 1, 4.2 °C min− 1 or 5.5 °C min− 1 under argonflow. The growth of the SPIONs was done at 320 °C for 30 min. Following the growth, the solution was cooled down to room tem-perature and SPIONs were cleaned with 2-propanol and acetone for three times. Then, SPIONs were dispersed in 16 mL of hexane and fil-tered using 0.2μm Millipore filter. In this work, we achieved the dif-ferences in the size and shape of SPIONs by varying the oleic acid
amount, heating rate, and iron-oleate amount of the mixture.
2.4. Surface modification
Principally, nanoparticles must possess low toxicity and good col-loidal stability in a biological environment to be suitable for in-vivo applications, which mandates a surface modification of these particles. Formation of biocompatible shells surrounding the nano-particles is a typical method for surface modification. Briefly, 10 mL of
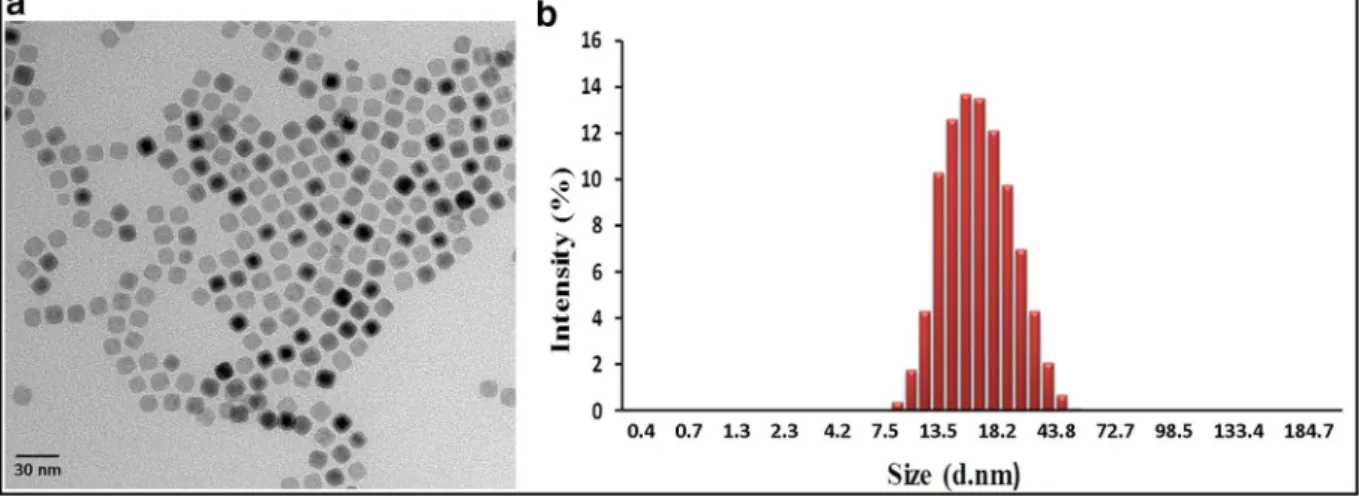
Fig. 1. TEM image of the 11-nm cubic SPIONs reveals a well-defined, monodisperse morphology (a). DLS size distribution result reports the overall nanoparticle hydrodynamic size up to ~ 18 nm (b).
Fig. 2. Representative T1-weighted (TR/TE = 3000/12 ms, TI = 800 ms, and matrix size = 256 × 256, reformatted for display purposes) and T2-weighted (TR/TE = 2000/100 ms, and
matrix size = 256 × 256, reformatted for display purposes) MRI images obtained from vial phantoms with increasing concentration of SPIONs at 3 T (a). Example signal-to-time curves of T1recovery (left) and T2decay (right) of 11-nm cubic SPIONs obtained by inversion recovery and multi-echo spin-echo sequences, respectively. The data points arefitted to
cyclohexane and 1.3 mL of Igepal-CO520 (polyoxyethylene (5) nonyl phenyl ether) were stirred for 15 min to obtain a microemulsion dis-persion. Followed by the addition of 1.5 mg iron oxide nanoparticles (in 1.6 mL of cyclohexane), the mixture was continuously stirred for fur-ther 15 min. Subsequently, 40μL of TEOS was added, and the solution was stirred for 30 min in the dark. Finally, 150μL of ammonium hy-droxide (1.5%) solution was added, and the mixture was stirred for 72 h. For the cleaning of resulting silica-coated iron oxide nano-particles, the solution was centrifuged at 10000 rpm for 20 min. After discarding the supernatant, 10 mL of ethanol was added, and the na-noparticles were dispersed using an ultrasonic bath. This dispersion was centrifuged at 10000 rpm for 40 min, and the same procedure was re-peated one more time. At the end, the supernatant was removed, and
6 mL of autoclaved ddH2O and 24μL of 2 M sodium hydroxide (NaOH)
solution were added.
2.5. Characterization
Morphological structures of the iron oxide nanoparticles were in-vestigated using an FEI Tecnai G2 F30 transmission electron micro-scopy (TEM). Before imaging, 2μL of iron oxide nanoparticle solution in hexane was dropped on a 200 mesh copper grid, and the sample was dried. Dynamic light scattering (DLS) measurement was conducted to study nanoparticles size distributions.
2.6. In-vitro relaxivity measurement
For in-vitro relaxivity analysis, solutions of all six types of SPIONs in varying concentrations were prepared in hexane to measure at 3T MRI scanner (Siemens Magnetron Trio, f0= 123 MHz) using a 32-channel
receive-only head coil (Siemens). The medium containing SPIONs was systematically diluted with hexane over the range of concentrations (0.025–1 mM) in glass vials (10 mm in diameter and 20 mm in height). The vials were placed vertically within the head coil. Experiments were performed at room temperature. T1 values were measured using an
Fig. 3. Measured relaxation rates (r1and r2) of spherical particles with the size of 7-nm, 11-nm, and 14-nm in diameter (a) and cubic particles with the size of 7-nm, 11-nm, and 14-nm in
diagonal (b) at 3 T. Plots show the change in relaxation rates as a function of iron concentration. Lines represent a linearfit for all data points for calculating Molar relaxivities r1and r2
(R01and R02were not included on molar relaxivities calculations). The concentrations of SPIONs were 0.025 mM, 0.05 mM, 0.1 mM, 0.2 mM, 0.3 mM, 0.4 mM, 1 mM for the molar
relaxivities measurement.
Table 1
Molar relaxivities measured at 3 T.
Group A spherical SPION Group B cubic SPION Particle 7 nm 11 nm 14 nm 7 nm 11 nm 14 nm r1(mM− 1s− 1) 0.5 1.2 3.2 1.1 3.4 4.2
r2(mM− 1s− 1) 0.6 9.8 40 3.8 36.8 68.8
inversion recovery sequence: TI = [24, 60, 90, 120, 200, 400, 800, 1250, 1750, 2000, 2500, 2900] ms, TR = 3000 ms, TE = 12 ms. T2
values were measured using a multi-echo spin-echo sequences: with TE = [9, 15, 20, 30, 40, 50, 60, 70, 100, 150] ms, TR = 2000 ms. Other parameters were kept the same for both sequences: slice thick-ness = 3 mm, field-of-view (FOV) = 74 × 149 mm, matrix si-ze = 256 × 256 pixels.
MR data were quantitatively analyzed off-line with the use of an in-house software developed in MATLAB (The MathWorks, Natick, MA). A circular region of interest (ROI) was outlined within each vial. For a given pixel within a ROI, the signal intensities at all TI values were gathered, and the T1relaxation time was determined via a
Levenberg-Marquardt nonlinearfitting of these signal intensities to Eq.(3). This was repeated for all pixels within the ROI, and the mean and standard deviation of T1was computed across all pixels in the ROI. A similar
procedure was performed for T2measurement, this time gathering the
signal intensity for a given pixel at all TE values, and nonlinearfitting these intensities to Eq.(4). The relaxation rates R1, and R2were
cal-culated from the estimated T1and T2values. Finally, Molar relaxivities
r1and r2were quantified by a linear fitting of the R1or R2values to Eqs. (1) and (2), respectively.
2.7. Cytotoxicity
As recommended by ISO 10993-5:2009, we used L929 mouse cell line to investigate the in-vitro cellular toxicity of 11-nm silica-coated cubic SPIONs. The cell line was grown in Dulbecco's modified Eagle's media (DMEM) solution containing 10% fetal bovine serum (FBS). For analysis of cellular visibility, the cell line was cultured in a 96-well plate (n = 3) with different concentrations of 11-nm silica-coated cubic SPIONs. An incubation time of 24 h was utilized [11,12]. After in-cubation, the 200μL of supernatant was transferred into the 96-well plate to mix with Alamar Blue solution. After several repetitions, 10μL of the mixed solution was picked up to count the number of living cells using automated cell counter.
2.8. In-vivo MR imaging
In-vivo MRI experiments were approved by the institutional Animal Ethics Committee and performed by the national standards of animal care. Sprague Dawley rat (250–300 g) was obtained from institutional Animal Laboratory and was maintained in standard laboratory condi-tions. In-vivo MRI studies were conducted with 3T MRI scanner. The rat
Fig. 4. In-vitro contrast enhancement analysis of the syn-thesized SPIONs. SNR and CEnh calculation results show
that 11-nm cubic and 14-nm spherical particles have better dual-mode contrast enhancement behavior. Six different samples with 0.4 mM concentration were utilized for T1
-and T2-weighted MRI imaging. T1-weighted images were
obtained using inversion recovery sequences: TR = 3000 ms, TE = 12 ms, TI = 700 ms. T2-weighted
images were obtained using multi-echo spin-echo se-quences: TR = 2000 ms, TE = 100 ms. Here, the gray scale display windowing was adjusted to better display the dif-ferences between signal levels.
Table 2
Contrast enhancement analysis results of the in vivo experiment.
SNR: signal-to-noise ratio, CNR: contrast-to-noise ratio, CEnh: contrast enhancement.
T1-weighted T2-weighted
Imaging timeline SNR CNR CEnh(%) SNR CNR CEnh(%)
Pre-contrast 34.9 6.3 – 22.2 12.6 – 5 min post-contrast 45.7 17.2 31 18.8 9.2 15 35 min post-contrast 50.6 20.1 45 14.4 4.9 35 70 min post-contrast 57.4 22.3 64 11.4 1.8 48 90 min post-contrast 56.8 21.9 61 11.8 2.0 47 18-hour post-contrast 37.3 9.2 6 20.0 10.6 1
was placed headfirst inside an in-house-developed cylindrical 5-cm-diameter birdcage rat MRI coil. This custom receive coil was used for all of our in-vivo experiments.
Due to their small-size advantage and high T1- and T2
-contrast-en-hancement (see results), 11-nm cubic silica-coated SPIONs were chosen for the in-vivo experiments. MR contrast enhancement simulations were conducted before and after SPION injections at various imaging para-meters (TR, TE, and flip angle). The relationships of the signal en-hancement with respect to the imaging parameters as function of SPION concentration (22, 23) showed that SPION can act as positive and ne-gative contrast agent. With a short TR, short TE, and largeflip angle, the signal intensity increased with the increasing SPION concentration, denoting a T1-enhancement effect. Increasing SPION concentration at a
long TR values, long TE values, and lowflip angles resulted in reduced signal intensity, denoting a T2-enhancement effect.
The aim of the in-vivo experiments was to show the proof-of-concept feasibility of synergistic contrast enhancement feature of the 11-nm cubic SPIONs in-vivo. Our animal experiments did not include an ex-haustive analysis of the effects of these nanoparticles on all anatomical organs. Instead, we focused on the kidney as the ROI due to the rapid accumulation of SPIONs in the kidney.
To observe the synergistic contrast effect, healthy anesthetized rat was imaged before, and 5 min, 35 min, 70 min, 90 min, and 18 h after intravenous injection of 1 mg/kg 11-nm cubic silica-coated SPIONs. A conventional spin-echo sequence (TR/TE = 1000 ms / 11 ms, 2 mm
slice thickness, and 320 × 320 matrix size) was performed to obtain T1
-weighted anatomical scans. T2-weighted spin-echo imaging was
con-ducted with the following parameters: TR/TE = 4000 ms / 90 ms, 2 mm slice thickness, and 320 × 320 matrix size.
2.9. Contrast enhancement analysis
The in-vitro and in-vivo SPION-induced contrast enhancement ana-lysis was performed using calculation of contrast-to-noise ratio (CNR), SNR, and percentage of contrast enhancement (CEnh).
For in-vitro contrast enhancement analysis, 0.4 mM of all six types of SPIONs as well as a reference sample (without contrast material) was prepared on 2 mL vials. We used inversion recovery (TR = 3000 ms, TE = 12 ms and TI = 600 ms) and multi-echo spin-echo (TR = 2000 ms, TE = 100 ms) MRI sequences to analyze the T1- and
T2-contrast-enhancement, respectively. In-vivo contrast enhancement
analysis was performed on the images resulting from the experiments described in theIn-vivo MR imaging sectionabove.
For each image group, SNR analysis was performed to determine the signal variations on the ROI with and without contrast agents. The signal intensities were gathered for all given pixels within a ROI, then mean signal intensity was calculated. The SNR was calculated by di-viding mean signal intensity of ROI by standard deviation of noise.
The CEnhin the phantom and in-vivo were calculated using the
fol-lowing equation:
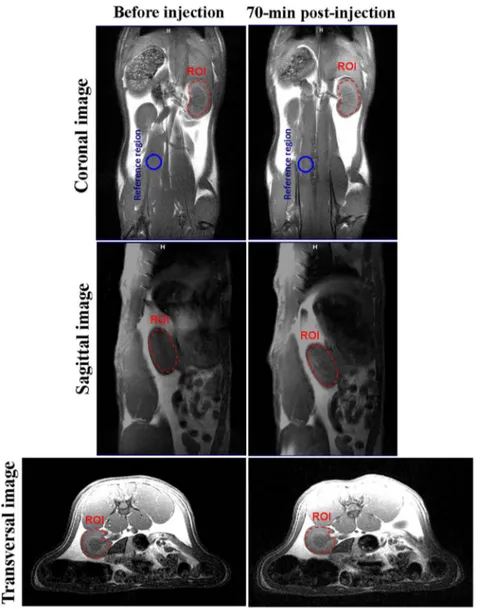
Fig. 5. In-vivo T1-weighted spin-echo MRI images of a healthy rat,
acquired on a 3T MRI scanner. Images were acquired before and 70-min post contrast injection of 11-nm cubic silica-coated SPIONs. A dose of 1 mg/kg of contrast agent was injected via the tail vein. Areas of signal enhancement (after injection) indicate approximately 64% contrast improvement in the kidney (marked with red dashed cir-cles). (For interpretation of the references to colour in thisfigure legend, the reader is referred to the web version of this article.)
= − × C I I I 100 Enh post pre pre (5)
where Ipostand Ipreare the mean signal intensities of the ROI with and
without SPIONs, respectively.
The CNR was calculated using the following equations:
= −
CNR I I
σ ROI REF
N (6)
where IROIand IREFare the mean signal intensities of the ROI and a
reference region, respectively.σNis the standard deviation of noise. For
in-vivo contrast enhancement analysis, we focused on the kidneys as the ROI, and psoas minor muscle was selected as the reference region to calculate SNR, CNR, and CEnh(Fig. 5, 6).
3. Results
3.1. Synthesis of silica-coated SPION and characterization
Spherical and cubic SPIONs with the size of 7 nm, 11 nm, and 14 nm were synthesized using the thermal decomposition method. TEM was utilized for the morphological and structural characterizations of iron oxide nanocrystals. Representative TEM images and a comparison of
core sizes of the synthesized SPIONs reveal that the particles are monodisperse, well separated in a solvent, and do not aggregate. An example TEM image corresponding to the 11-nm cubic SPIONs is shown inFig. 1a. DLS measurements of the same SPIONs are givenFig. 1b, showing a hydrodynamic size of up to ~ 18 nm.
3.2. In-vitro relaxivity analysis of synthesized SPIONs
In-vitro T1and T2relaxation times of all prepared vial phantoms as a
function of the iron concentration were calculated for all samples. The relaxation times were determined by nonlinearfitting of the signal in-tensities (Fig. 2b). An example T1-weighted image shown in Fig. 2a
shows that mean signal intensities of the phantomsfirst go down and then increase with increasing iron concentration, due to inversion re-covery. In the T2-weighted images, by increasing the iron concentration
the mean signal intensities decrease. As expected, the relaxation rates (R1and R2) increase linearly with increasing iron concentration of the
nanoparticles. More importantly, the longitudinal and transverse molar relaxivities, r1and r2, of both the spherical and cubic SPIONs show a
trend of increasing values with increasing particles size (Fig. 3a, b). When compared with spherical SPIONs, the cubic SPIONs show a 1.3- to 2.2-fold increase in longitudinal molar (r1) relaxivity (r1:
0.5 mM− 1s− 1 [7-nm sphere]; 1.2 mM− 1s− 1 [11-nm sphere];
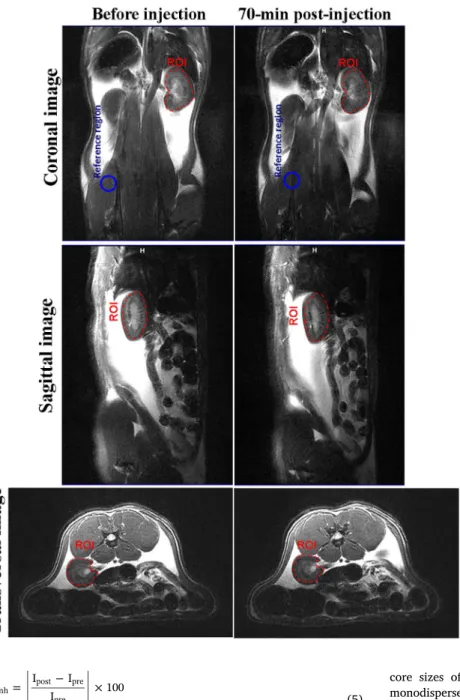
Fig. 6. In-vivo T2-weighted spin-echo MRI images of a healthy rat,
acquired on a 3T MRI scanner. Images were acquired before and 70-min post contrast injection of 11-nm cubic silica-coated SPIONs. A dose of 1 mg/kg of contrast agent was injected via the tail vein. At 70-min post-injection of the contrast agent, the signal in the kidney became noticeably dark and resulted in approximately 48% contrast enhancement (marked with red dashed circles). (For interpretation of the references to colour in thisfigure legend, the reader is referred to the web version of this article.)
3.2 mM− 1s− 1 [14-nm sphere]; 1.1 mM− 1s− 1 [7-nm cubic]; 3.4 mM− 1s− 1[11-nm cubic]; 4.2 mM− 1s− 1[14-nm cubic];Table 1). Likewise, the cubic SPIONs show 1.7- to 6.3-fold increase in transverse molar (r2) relaxivity when compared to the spherical SPIONs (r2:
0.6 mM− 1s− 1 [7-nm sphere]; 9.8 mM− 1s− 1 [11-nm sphere]; 40 mM− 1s− 1 [14-nm sphere]; 3.8 mM− 1s− 1 [7-nm cubic]; 36.8 mM− 1s− 1 [11-nm cubic]; 68.8 mM− 1s− 1 [14-nm cubic]; Table 1). These differences can be explained by the dominant surface-to-volume ratio and spin canting effects of the cubic nanoparticles. In short, cubic samples show better T1- and T2-contrast-enhancement
compared to their spherical counterparts.
Results show thatα = r2/r1ratio increased with increasing
nano-particle size for both spherical and cubic SPIONs (α: 1.2 [7-nm sphere]; 8.2 nm sphere]; 12.5 [14-nm sphere]; 3.4 [7-nm cubic]; 10.8 [11-nm cubic]; 16.4 [14-[11-nm cubic];Table 1). Among these six samples, 14-nm cubic SPIONs have higher molar relaxivities, but a highα value of α = 16.4 at 3 T, which can suffer from T2-related negative signal voids,
especially at high iron concentrations. 11-nm cubic and 14-nm sphere samples possess comparable features (α11 nm (cubic)= 10.8, α14 nm (sphere)= 12.5 at 3 T) with higher possibility to show the dual-mode
contrast effect. To confirm these claims, we have performed T1- and T2
-weighted contrast enhancement analysis, as shown in Fig. 4. Accord-ingly, 11-nm cubic and 14-nm sphere SPIONs show the highest SNR and CEnhvalues on T1-weighted images and lowest SNR and highest CEnh
values on T2-weighted images, demonstrating their dual-mode contrast
effect. It is interesting to note that the 14-nm cubic SPIONs with the highest r1 relaxivity did not yield the highest CEnh for T1-weighted
images. This result was due to the very high r2relaxivity value of these
nanoparticles, which caused a signal reduction even at the relatively short TE of 12 ms for the T1-weighted images. Hence, 11-nm cubic
SPIONs as the smaller particles with higher positive and negative contrast effect are selected as an optimal tracer for synergistic MRI experiment for in-vivo studies performed in this work.
3.3. Cell survival
Cellular toxicity of 11-nm silica-coated cubic SPIONs was examined using the L929 mouse cell line with different iron concentrations in ddH2O. In-vitro visibility of the L929 cell showed that more than 90% of
the cells survived for 24 h even at a very high concentration of 100μg Fe mL− 1, indicating negligible toxicity.
3.4. In-vivo experiments
In-vivo T1- and T2-contrast-enhancement analysis performed on the
selected ROI at six different time points is summarized inTable 2. The rat was injected with 1 mg/kg of contrast agent as described in the Methods section. The analysis on T1-weighted images showed that SNR,
CNR, and CEnhgradually increased as the time progressed, and reached
their maximum values at 70-min post-contrast. No significant changes with respect to maximum value (at 70-min post-contrast) were seen at 90-min post-contrast. On the other hand, the analysis on T2-weighted
images showed that SNR and CNR decreased as time progressed and reached their lowest values at 70-min post-contrast. This reduction in SNR and CNR is expected due to the negative contrast effect of SPIONs in T2-weighted images. Importantly, CEnhgradually increased to reach a
maximum at 70-min post contrast, indicating the T2
-contrast-en-hancement capability of the 11-nm silica-coated cubic SPIONs. For both T1-weighted and T2-weighted images, SNR, CNR, and CEnhmetrics
re-turned back to values close to their pre-contrast levels at 18-hour post-contrast, which indicates a half-life less than 18 h for 11-nm cubic SPIONs.
In-vivo T1- and T2-weighted spin-echo images in rat kidney pre- and
70-min post-injection of the 11-nm silica-coated cubic SPIONs are shown inFigs. 5 and 6, respectively. Thefirst, second, and third rows of thefigures show coronal, sagittal, and transversal images from
spin-echo acquisitions before and after injection of the contrast agent, re-spectively. At 70-min post-injection, the kidney region appears brighter on the T1-weighted spin-echo images, demonstrating the positive
con-trast improvement of the 11-nm cubic SPIONs. The ROI is surrounded by the red dashed circle (Fig. 5). Likewise, abdominal T2-weighted
spin-echo images taken 70 min after injection show that kidney turned to darker, demonstrating the negative contrast-enhancement of the 11-nm cubic SPIONs. The negatively-enhanced region that we focused as ROI is marked by the red dashed circle (Fig. 6).
The analysis of the CEnhand SNR in the kidney region at 70-min
post-injection indicated that contrast is enhanced in the region of in-terest on both the T1- and T2-weighted acquisitions. As given inTable 2,
post-injection CEnhanalysis in the kidney region resulted in 64%
con-trast enhancement on T1-weighted transversal images. Also, CEnhstudy
reported 48% contrast enhancement on T2-weighted transversal
images. These results demonstrate the feasibility of using the 11-nm cubic SPIONs to synergistically enhance the contrast on both T1- and
T2-weighted in-vivo MR imaging.
4. Discussion
The need for a synergistic positive and negative contrast enhancing and safe MRI contrast agent that can be utilized in clinical diagnosis has attracted the interest of many research groups[18,19]. The combina-tion of both T1-contrast-enhanced image with high spatial resolution
and T2-contrast-enhanced image with increased lesion detection
cap-ability allows complementary anatomic and pathologic information [20]. In this study, by controlling the shape and size of the SPIONs, we targeted a new class of synergistic MRI contrast agents. We synthesized two different groups of nanoparticles, in spherical and cubic shapes. Our investigations resulted in two mainfindings: First, experimental analysis on both the spherical and cubic iron oxides showed an increase of r1and r2as the size increases. More importantly, in comparing the
two groups of the synthesized SPIONs, cubic SPIONs showed higher molar relaxivities (r1 and r2) than their spherical counterparts. This
observation can be explained by increased surface-to-volume ratio and spin canting effects in the large surfaces and sharp edges of the cubic samples[26,27]. Also, α = r2/r1ratio was larger for the same-sized
cubic nanoparticles when compared to spherical nanoparticles, because of the relatively large increases in r2. In-vitro contrast enhancement
analysis results showed that 11-nm cubic SPIONs can be an optimal sample as a synergistic contrast agent for in-vivo MRI experiments.
Second, as a proof-of-concept feasibility study, we showed that 11-nm cubic SPIONs are promising candidates as a single agent for sy-nergistic contrast in MRI. The results of the in-vivo experiments were in agreement with the in-vitro relaxivity and contrast enhancement ana-lysis of the 11-nm cubic SPIONs. It should be noted that the in-vivo SNR and CEnhwas lower than the in-vitro case, which could be due to the
reduced in-vivo iron concentration in the kidney, as well as environ-mental differences between the in-vitro and in-vivo cases (such as the T1
and T2of the vitro medium vs. that of the kidney tissue before
in-jection), and differences in pulse sequence parameters.
Gadolinium complexes are the most commonly used T1 contrast
agents in MRI. In contrast to SPIONs, however, gadolinium complexes have short blood half-life. As reported in the literature, MR images show high contrast immediately after injection of gadolinium, but this effect vanishes rapidly. The SPIONs are shown to maintain the en-hancement of contrast at a high value for more than 1 h, while the gadolinium-enhanced contrast drops within 3 min[15]. This rapid re-duction restricts the usage of gadolinium complexes in conjunction with long scan time (e.g., longer than 10 min). The contrast enhancement analysis of the proposed cubic SPIONs also showed that the highest contrast level was maintained at a constant level between 70-min and 90-min after injection, providing a wide window for in-vivo imaging. Furthermore, the free gadolinium ions from various labels of gadoli-nium complexes are known to be very toxic[31,32]. SPIONs, on the
other hand, are known to have increased biocompatibility and can even be used safely for iron therapy in humans[33].
By taking advantage of both positive and negative contrast effect using a single contrast material, the proposed contrast agent may be used as a promising synergistic contrast tracer. It should be noted that the MR signal intensity and contrast effects are dependent on image acquisition parameters, particularly TR, TE andflip angle[22], as well as the magnetic property of contrast materials. This work did not aim to optimize the imaging parameters, but rather focused on optimizing the nanoparticles based on their size and shape characteristics. Accord-ingly, the in-vivo experiments were geared towards showing the feasi-bility of the 11-nm cubic SPIONs as a dual-mode contrast agent. In-vestigating the pharmacodynamics and pharmacokinetic effects of these nanoparticles on different organs using complementary in-vivo MRI experiments remains as important future work.
5. Conclusion
In this study, by controlling the shape and size of SPIONs, we have synthesized a new class of synergistic (dual-mode) MRI contrast agent. The in-vitro contrast enhancement analysis showed that the synthesized 11-nm cubic SPIONs with small size have high dual-contrast effect, suitable for use during in-vivo imaging. Results of the toxicity analysis showed that the antagonistic effects of the 11-nm cubic SPIONs on the L929 line cell were very low even at high concentrations of the contrast agent. The feasibility of the synergistic contrast effect was investigated in-vivo on a 3T MRI scanner, demonstrating high levels of contrast en-hancement 70-min post-injection. These results demonstrate the pro-mising potential of the synthesized 11-nm silica-coated cubic SPIONs as a synergistic MRI contrast agent.
Acknowledgment
We gratefully acknowledge Dr. Gamze Aykut, Department of Molecular Biology and Genetics, Bilkent University, Ankara, Taner Demir and Dr. Volkan Acikel, Bilkent University, Ankara, for their as-sistance in in-vivo experiments, and all UMRAM staff for providing technical support. The authors also gratefully thank scientific discus-sion of Dr. Tolga Cukur. We would like to acknowledge Biomaten (METU) for the cytotoxicity experiments.
References
[1] Hoult DI, Lauterbur PC. The sensitivity of the zeugmatographic experiment invol-ving human samples. J Magn Reson 1979;34:425–33.
[2] Wright GA. Magnetic resonance imaging. IEEE Signal Process Mag 1997;14:56–66. [3] Clarke SE, Weinmann HJ, Dai E, Lucas AR, Rutt BK. Comparison of two blood pool contrast agents for 0.5-T MR angiography: experimental study in rabbits. Radiology 2000;214:787–94.
[4] Thorek DL, Ulmert D, Diop NF, Lupu ME, Doran MG, Huang R, et al. Non-invasive mapping of deep-tissue lymph nodes in live animals using a multimodal PET/MRI nanoparticle. Nat Commun 2014;5:3097.http://dx.doi.org/10.1038/ncomms4097. [5] Klug G, Kampf T, Bloemer S, Bremicker J, Ziener CH, Heymer A, et al. Intracellular
and extracellular T1and T2relaxivities of magneto-optical nanoparticles at
ex-perimental highfields. Magn Reson Med 2010;64(6):1607–15.http://dx.doi.org/ 10.1002/mrm.22557.
[6] Lee S, Kim B, Na B, Hyeon T. Paramagnetic inorganic nanoparticles as T1MRI
contrast agents. WIREs Nanomed Nanobiotechnol 2014;6:196–209.http://dx.doi. org/10.1002/wnan.1243.
[7] Zachary RS, Forrest M, Kievit A, Zhang M. Magnetite nanoparticles for medical MR imaging. Mater Today 2011;14:330–8.http://dx.doi.org/10.1016/S1369-7021(11) 70163-8.
[8] Au-Hui LU, Salabas EL, Schuth F. Magnetic nanoparticles: synthesis, protection, functionalization, and application. Angew Chem 2007;46:1222–44.http://dx.doi. org/10.1002/anie.200602866.
[9] Huber ME, Paetsch I, Schnackenburg B, Bornstedt A, Nagel E, Fleck E, et al.
Performance of a new gadolinium-based intravascular contrast agent in free-breathing inversion-recovery 3D coronary MRA. Magn Reson Med 2003;49:115–21.
http://dx.doi.org/10.1002/mrm.10350.
[10] Kuo PH, Kanal E, Abu-Alfa AK, Cowper SE. Gadolinium-based MR contrast agents and nephrogenic systemicfibrosis. Radiology 2007;242:647–9.http://dx.doi.org/ 10.1148/radiol.2423061640.
[11] Ziener CH, Bauer WR, Jakob PM. Transverse relaxation of cells labeled with mag-netic nanoparticles. Magn Reson Med 2005;54(3):702–6.http://dx.doi.org/10. 1002/mrm.20634.
[12] Yi-Xiang JW, Shouhu X, Marc P, Jean-Marc I. Recent advances in super-paramagnetic iron oxide nanoparticles for cellular imaging and targeted therapy research. Curr Pharm Des 2013;19(37):6575–93.
[13] Sharifi S, Seyednejad H, Laurent S, Atyabi F, Saei A, Mahmoudi M. Superparamagnetic iron oxide nanoparticles for in vivo molecular and cellular imaging. Contrast Media Mol Imaging 2015;10:329–55.http://dx.doi.org/10. 1002/cmmi.1638.
[14] Chris VB, Xiaowei Z, George S, Paula JG, Brian KR. Application of the static de-phasing regime theory to superparamagnetic iron-oxide loaded cells. Magn Reson Med 2002;48:52–61.http://dx.doi.org/10.1002/mrm.10192.
[15] Byung HK, Nohyun L, Hyoungsu K, Hyoungsu K, Kwangjin A, Yong P. Large-scale synthesis of uniform and extremely small-sized iron oxide nanoparticles for high-resolution T1 magnetic resonance imaging contrast agents. J Am Chem Soc 2011;133:12624–31.http://dx.doi.org/10.1021/ja203340u.
[16] Lee N, Choi Y, Lee Y, Park M, Moon WK, Choi SH, et al. Water-dispersible ferri-magnetic iron oxide nanocubes with extremely high r2 relaxivity for highly sensi-tive in vivo MRI of tumors. Nano Lett 2012;12(6):3127–31.http://dx.doi.org/10. 1021/nl3010308.
[17] Lee CM, Jeong HJ, Kim EM, Kim DW, Lim ST, Kim HT, et al. Superparamagnetic iron oxide nanoparticles as a dual imaging probe for targeting hepatocytes in vivo. Magn Reson Med 2009;62(6):1440–6.http://dx.doi.org/10.1002/mrm.22123. [18] Girard OM, Du J, Agemy L, Sugahara KN, Kotamraju VR, Ruoslahti E, et al.
Optimization of iron oxide nanoparticle detection using ultrashort echo time pulse sequences: comparison of T1, T2*, and synergistic T1-T2* contrast mechanisms.
Magn Reson Med 2011;65:1649–60.http://dx.doi.org/10.1002/mrm.22755. [19] Bae KH, Kim YB, Lee Y, Hwang JY, Park HW, Park TG. Bioinspired synthesis and
characterization of gadolinium-labeled magnetite nanoparticles for dual contrast T1-and T2-weighted magnetic resonance imaging. Bioconjug Chem
2010;21(3):505–12.http://dx.doi.org/10.1021/bc900424u.
[20] Sharma VK, Alipour A, Soran-Erdem Z, Kelestemur Y, Aykut ZG, Demir HV. Fluorescent heterodoped nanotetrapods as synergistically enhancing positive and negative MRI contrast agents. ACS Appl Mater Interfaces 2016;8(19):12352–9.
http://dx.doi.org/10.1021/acsami.6b02407.
[21] Zijian Z, Dengtong H, Jianfeng B, Qiaoli C, Gang L, Zhong C, et al. A synergistically enhanced T1–T2dual-modal contrast agent. Adv Mater 2012;24:6223–8.http://dx.
doi.org/10.1002/adma.201203169.
[22] Jung H, Park B, Lee C, Cho J, Suh J, Park J, et al. Dual MRI T1and T2* contrast with
size-controlled iron oxide nanoparticles. Nanomedicine 2014;10:1679–89.http:// dx.doi.org/10.1016/j.nano.2014.05.003.
[23] Kwon H, Shim W, Cho G, Cho HJ, Jung HS, Lee CK, et al. Simultaneous evaluation of vascular morphology, blood volume and transvascular permeability using SPION-based, dual-contrast MRI: imaging optimization and feasibility test. NMR Biomed 2015;28(6):624–32.http://dx.doi.org/10.1002/nbm.3293.
[24] Bhatti ML, Marin D, Nelson R. Emerging applications for ferumoxytol as a contrast agent in MRI. J Magn Reson Imaging 2015;41(4):884–98.http://dx.doi.org/10. 1002/jmri.24691.
[25] Berry CC, Curtis AG. Functionalisation of magnetic nanoparticles for applications in biomedicine. J Phys D Appl Phys 2003;36:198–206.
[26] Batlle X, Labarta A. Finite-size effects in fine particles: magnetic and transport properties. J Phys D Appl Phys 2002;35:15–42.
[27] Zhenghuan Z, Zijian Z, Jianfeng B, Wang Z, Hu J, Chi X, et al. Octapod iron oxide nanoparticles as high performance T2 contrast agents for magnetic resonance imaging. Nat Commun 2013;3266.http://dx.doi.org/10.1038/ncomms3266. [28] Koenig SH, Kellar KE. Theory of 1/T1 and 1/T2 NMRD profiles of solutions of
magnetic nanoparticles. Magn Reson Med 1995;34(2):227–33.
[29] Buxton RB, Edelman RR, Rosen BR, Wismer GL, Brady TJ. Contrast in rapid MR imaging-T1-weighted and T2-weighted imaging. J Comput Assist Tomogr
1987;11:7–16.
[30] Rock A, Muller RN, Gillis P. Thery of proton relaxation induced by super-paramagnetic particles. J Chem Phys 1999;110:5403–11.
[31] Penfield JG, Reilly RF. What nephrologists need to know about gadolinium. Nat Clin Pract Nephrol 2007;3(12):654–68.http://dx.doi.org/10.1038/ncpneph0660. [32] Warsi MF, Adams RW, Duckett SB, Chechik V. Gd-functionalised Au nanoparticles
as targeted contrast agents in MRI: relaxivity enhancement by polyelectrolyte coating. Chem Commun 2010;21;46(3):451–3.http://dx.doi.org/10.1039/ b915223g.
[33] Lu M, Cohen MH, Rieves D, Pazdur R. FDA report: ferumoxytol for intravenous iron therapy in adult patients with chronic kidney disease. Am J Hematol