I
DENTIFICATION
OF
D
AMAGED
W
HEAT
K
ERNELS
AND
C
RACKED-
S
HELL
H
AZELNUTS
WITH
I
MPACT
A
COUSTICS
T
IME-
F
REQUENCY
P
ATTERNS
N. F. Ince, I. Onaran, T. Pearson, A. H. Tewfik, A. E. Cetin, H. Kalkan, Y. Yardimci
ABSTRACT. A new adaptive time-frequency (t-f) analysis and classification procedure is applied to impact acoustic signals for detecting hazelnuts with cracked shells and three types of damaged wheat kernels. Kernels were dropped onto a steel plate, and the resulting impact acoustic signals were recorded with a PC-based data acquisition system. These signals were segmented with a flexible local discriminant bases (F-LDB) procedure in the time-frequency plane to extract discriminative patterns between damaged and undamaged food kernels. The F-LDB procedure requires no prior knowledge of the relevant time or frequency indices of the impact acoustics signals for classification. The method automatically finds all crucial time-frequency indices from the training data by combining local cosine packet analysis and a frequency axis clustering approach, which supports individual time and frequency band adaptation. Discriminant features are extracted from the adaptively segmented acoustic signal, sorted according to a Fisher class separability criterion, post-processed by principal component analysis, and fed to a linear discriminant classifier. Experimental results establish the superior performance of the proposed approach when compared to prior techniques reported in the literature or used in the field. The new approach separated damaged wheat kernels (IDK, pupal, and scab) from undamaged wheat kernels with 96%, 82%, and 94% accuracy, respectively. It also separated cracked-shell hazelnuts from those with undamaged shells with 97.1% accuracy. The adaptation capability of the algorithm to the time-frequency patterns of signals makes it a universal method for food kernel inspection that can resist the impact acoustic variability between different kernel and damage types.
Keywords. Adaptive time-frequency analysis, Food kernel inspection, Impact acoustics, Kernel classification.
ood kernel damage caused by insects, fungi, and mold is a major source of quality degradation. For instance, Fusarium graminearum, a fungus found in wheat, creates “scab” damage and may lead to toxins known to cause cancer (Christensen and Meronuck, 1986). Internal insect infestation degrades the quality and value of wheat and is one of the most difficult kernel defects to detect. This type of kernel damage occurs when an adult female insect chews a small hole in the kernel, deposits an egg, and then seals the egg with a mixture of mucus. The egg plug is the same color as the wheat surface, so it is nearly
Submitted for review in May 2007 as manuscript number IET 7006; approved for publication by the Information & Electrical Technologies Division of ASABE in August 2008. Presented at the 2007 ASABE Annual Meeting as Paper No. 074152.
The authors are Nuri F. Ince, Post-Doctoral Associate, Department of Electrical and Computer Engineering, University of Minnesota, Minneapolis, Minnesota; Ibrahim Onaran, Research Assistant and Doctoral Student, Department of Electrical and Electronics Engineering, Bilkent University, Ankara, Turkey; Tom C. Pearson, ASABE Member Engineer, Agricultural Engineer, USDA Agricultural Research Service, Manhattan, Kansas; Ahmed H. Tewfik, Professor, Department of Electrical and Computer Engineering, University of Minnesota, Minneapolis, Minnesota; A. Enis Cetin, Professor, Department of Electrical and Electronics Engineering, Bilkent University, Ankara, Turkey; Habil Kalkan, Research Assistant, Doctoral Student, and Yasemin Yardimci, Professor, Informatics Institute, Middle East Technical University, Ankara, Turkey. Corresponding author: Nuri F. Ince, Department of Electrical and Computer Engineering, 4-147C EE/CSCI Building, 200 Union St. SE, University of Minnesota, Minneapolis, MN 55455; phone: 612-625-5006; fax: 612-625-4583; e-mail: [email protected].
impossible to detect by visual inspection. When the egg hatches, the insect larvae feeds on the kernel endosperm and then exits the kernel by chewing an exit tunnel and forming what is called an “insect-damaged kernel” (IDK). Insect infestations cause grain loss by consumption, nutritional losses, and degradation in the end-use quality of flour (Pederson, 1992). Separation of damaged from undamaged wheat kernels is crucial for quality and proper grading of wheat loads. Therefore, the percentage of insect-damaged kernels in the production/market is controlled by the USDA and industry standards. For example, in the U.S., U.S. No. 1 to U.S. No. 5 grades only allow up to 31 damaged wheat samples per 100 g. Damaged samples exceeding this number are graded as U.S. Sample grade (USDA, 2008).
A similar problem occurs in hazelnut production. Environmental conditions and processing procedures may decrease nut quality by causing cracks on the shell. Damage to the shell of the nut kernel increases the likelihood of fungi infecting the kernels, since the mold spores have unabated access to the kernel. Fungal infestation can cause aflatoxin formation, which is a type of mycotoxin that is linked to various health problems including liver cancer (Dichter, 1984). Therefore, it is crucial to detect hazelnuts with damaged shells and separate them from undamaged nuts.
In this study, two important food inspection problems are addressed using a novel adaptive time frequency segmentation technique:
S Detection of damaged wheat kernels. S Detection of hazelnuts with cracked shell.
I
MPACTA
COUSTICS FORF
OODI
NSPECTIONBecause the proportion of damaged kernels is small compared to the total number of undamaged wheat kernels, a low false positive error rate (identification of an undamaged kernel as damaged) is crucial for an economically feasible detection system. Several methods have been studied to tackle the problem of detecting insect-damaged wheat kernels, including x-ray imaging (Karunakkaran et al., 2003), NIR spectroscopy (Maghirang et al., 2003; Dowell et al., 1998), and carbon dioxide measurements (Bruce et al,. 1982). However, these methods are slow, expensive, and do not provide the required accuracy in classification. Hence, these types of wheat kernel inspection methods have not found widespread application in industry.
In hazelnut production, farmers separate the empty hazelnuts from fully developed ones before selling the nuts. A mechanical device using an air fan is utilized for this purpose. The air fan removes immature or empty hazelnuts with lower weight, and the remaining hazelnuts are accepted as fully developed. This system is unable to remove the nuts with cracked shells because hazelnuts with cracked shells have weights and densities that are very similar to hazelnuts with undamaged shells.
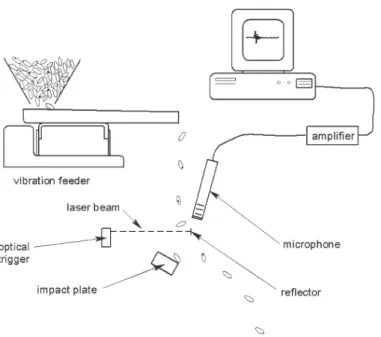
The drawback of these methods of wheat and hazelnut inspection led researchers to explore new techniques. Recently, impact acoustic emission has been proposed to separate pistachios with closed shells from those with split shells (Pearson, 2001). In this system, as depicted in figure 1, the nuts are projected onto a steel plate and the resulting acoustic signals are analyzed. With this method, the classification accuracy was approximately 97% with a throughput of 40 nuts per second. This same strategy was applied to wheat inspection, and successful results were obtained for detection of IDK from undamaged kernels (Pearson et al., 2005). Although the mechanical structure was similar, Pearson et al. (2005) reported that the signal features used for pistachio classification, such as the integrated
absolute value of microphone output signal and the gradient of the signal at manually selected time intervals, did not work well in wheat inspection. They improved the system by including a combination of time and frequency domain features individually. To be more specific, variances and maximum values extracted from short time windows were used as time features. In addition, signal modeling was performed with a three-step transformation. As an initial step, the signal was rectified by computing its absolute value at all time points. Then a non-linear filter replaced the center data point with the maximum value in a seven-point window. Finally, a non-linear estimation of the four parameters of the Weibull function was implemented. These parameters were used as features for classification. The frequency domain features were: the frequency index corresponding to the peak DFT magnitude of the signal, 30 normalized DFT magnitudes centered about the peak DFT, the entire set of 128 DFT magnitudes, and the 32 magnitudes of the differential spectrum. The reader is referred to Pearson et al. (2005) for details. Although these feature combinations provided good results for IDK separation, the authors also reported poor results on other types of kernel damage, such as scab and infested kernels at the pupal stage, where the insect was still inside the kernel. The same impact acoustics based system was also recently extended to separate cracked hazelnut shells from undamaged ones (Kalkan and Yardimci, 2006) and immature hazelnuts from fully developed hazelnuts (Onaran et al., 2006). Specifically, Kalkan and Yardimci (2006) reported a classification accuracy of 91.8% in cracked and healthy hazelnut shell separation by using the energy in the frequency subbands of impact acoustics.
The results of Pearson et al. (2005), Kalkan and Yardimci (2006), and Onaran et al. (2006) emphasized the importance of signal processing methods for the impact acoustic signal to achieve higher accuracies in food kernel inspection. These improvements were obtained by extracting frequency and time domain features separately. Generally, a subset of these
Figure 1. Schematic of food kernel sorter based on acoustic emissions. This system was used for sorting pistachios and wheat kernels by Pearson (2001) and Pearson et al. (2005).
features was selected using traditional stepwise discriminant analysis for classification. In the presence of variability of acoustic waveforms due to different kernel damages, it is cumbersome to extract relevant features and adapt them to changing conditions.
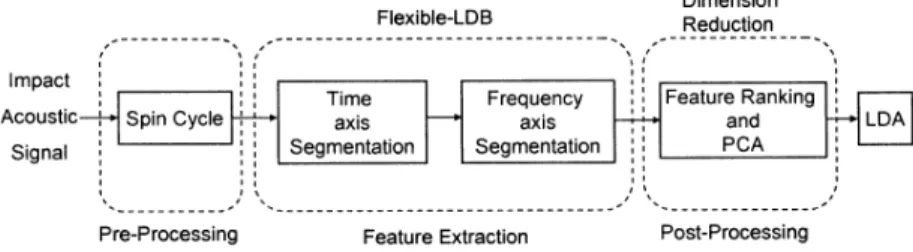
The objective of this study was to investigate a detection method for cracked hazelnuts and wheat kernel damage based on an adaptive time-frequency (t-f) analysis of the impact acoustic signals emitted by wheat kernels or hazelnut shells when dropped from a fixed height onto a steel plate. The proposed approach requires no prior knowledge of the relevant time or frequency indices of the impact acoustics signals. It implements an arbitrary time and frequency tiling with a flexible local discriminant bases algorithm (Ince et al., 2006) to find the most relevant indices automatically. This algorithm is obtained by combining local cosine packet (LCP) analysis (Mallat, 1999; Wickerhauser, 1994) with a frequency axis clustering approach that supports individual time and frequency band adaptation. The time and frequency segmentation steps produce too many features. Furthermore, these features are generally correlated. Therefore, the adaptively extracted t-f features are processed by principal component analysis to reduce the number of features and combine correlated features. Finally, the PCA post-processed feature set was classified with linear discriminant analysis.
M
ATERIAL ANDM
ETHODSA schematic diagram describing the overall signal processing and classification system is shown in figure 2. As indicated previously, the time-frequency features extracted from impact acoustic signals are used for the identification of damaged wheat kernels and hazelnuts with cracked shells. The time-frequency features are computed by windowing the acoustic signal in adapted time segments and then applying a spectral analysis to estimate the frequency spectrum. After computing the features, they are sorted with Fisher’s discriminative criterion to select the most parsimonious ones and post-processed by PCA. Finally, linear discriminant analysis is used to identify damaged food kernel acoustics. The next sections provide a detailed description of the data acquisition system used to record the impact acoustics and perform the signal processing steps.
IMPACT ACOUSTICS DATA ACQUISITION
The same experimental setup of Pearson et al. (2005) was used to record the impact acoustics. A schematic of the experimental apparatus for singling wheat kernels and hazelnuts, which consisted of dropping the nuts/kernels onto the impact plate and then collecting the acoustic signals from the impact, is shown in figure 1. A vibration feeder (F-TO-C,
FMC-Syntron, Homer City, Pa.) was used to transform the wheat kernels into a single-file stream, which consisted of a vibrating bulk hopper and a V-shaped steel trough. The wheat kernels were impacted onto a polished stainless steel plate with dimensions of approximately 75 × 50 × 100 mm. The drop distance from the feeder to the impact plate was 400 mm, and the plate was inclined at 30° above the horizontal. This angle was determined by trial and error in order to prevent bounces. Flatter angles of incline produced a stronger signal, but the kernels tended to bounce twice before falling off of the plate. This was not conducive to high-speed sorting.
A microphone (4939 L with 2669 L pre-amp, Bruel and Kjaer North America, Norcross, Ga.), sensitive to frequencies up to 100 kHz, was used to capture audible and ultrasonic acoustic emissions from the impact of the wheat kernels with the steel plate. The end of the microphone was placed 25 mm from the point where kernels impacted the plate. The microphone output was further amplified (2690 NEXAS, Bruel and Kjaer North America, Norcross, Ga.) at 1 V/Pa to ensure that the system had the required dynamic range to capture the acoustic emissions. Microphone signals were digitized using a sound card (Waveterminal 192X, Ego Sys, Seoul, South Korea) at a sampling frequency of 192 kHz with 16-bit resolution. This sound card does not have the 20 kHz low-pass filter that most consumer sound cards use. The data acquisition was triggered using an optical sensor (QS30LLPC, Banner Engineering Corp., Minneapolis, Minn.). In the wheat kernel experiment, 600 undamaged (UD), 600 IDK, 600 pupal, and 400 scab kernels were used. To evaluate the performance of the proposed algorithm in discrimination of cracked shell hazelnuts from undamaged ones, the dataset of Kalkan and Yardimci (2006) was used. A setup similar to that used for the wheat experiment was constructed to record the hazelnut impact acoustic signals with undamaged and cracked shells. A stainless steel plate with dimensions of 75 × 150 × 20 mm was used as the impact plate. The impact plate was fixed to the ground at a 120° angle to prevent nuts from making multiple impacts. A microphone (AT9100, Audio-Technica U.S., Inc., Stow, Ohio), sensitive to frequencies up to 20 kHz, was placed 50 mm from the impact plate. The impact acoustic signal was sampled at 44.1 kHz with a standard sound card attached to the computer. ‘Levant’ type hazelnuts, which were collected from an orchard in Akcakoca, Turkey, in August 2003, were used in this study. The weights of the hazelnuts were measured, and those less than 0.9 g were taken as empty or undeveloped nuts. Hazelnuts with weights over 0.9 g were accepted as fully developed. This value was found empirically by inspecting the weight of several empty, underdeveloped, and fully developed hazelnuts. The hazelnut shells were visually inspected and were further
(a) Undamaged
(b) IDK (c) Scab
(d) Pupal
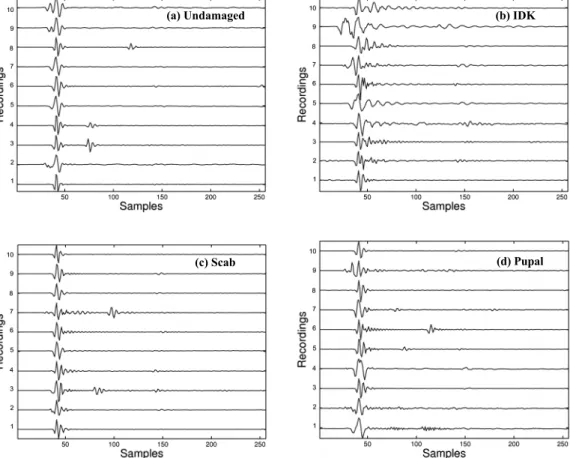
Figure 3. Sample waveforms of wheat kernel impact acoustics for the types studied in this article (N = 10): (a) undamaged kernels, (b) insect-damaged kernels (IDK) with exit holes, (c) fungi damage (scab), and (d) kernels with hidden damage at the pupal stage where the insect is still in the kernel.
classified into nuts with regular shell and nuts with cracked shell. For each undamaged and cracked class, 180 signals were recorded. Representative impact acoustic signals of wheat and hazelnut kernels recorded with these systems are presented in figures 3 and 4, respectively.
SIGNAL PROCESSING
Transient features in a signal may carry significant information for classification. Such features are sometimes omitted due to their low energy or improper analysis that ignores temporal information. As shown in figures 3 and 4, the impact acoustic signals also contain transient waveforms that may carry information for discrimination. In order to
extract such localized information, time-frequency methods are widely used (Mallat, 1999; Vetterli, 2001). A time-frequency analysis explores the time-varying characteristic of a signal by windowing it in consecutive time segments, generally overlapping, and then applying a spectral analysis to estimate energy distribution of the signal in the frequency domain. The width of the time window determines the resolution of the spectral analysis. While longer windows provide higher spectral resolution, they provide poor time localization, vice versa. Therefore, it is desirable to adjust the time windows to adapt to the time-varying characteristic of the signal. In this study, the flexible local discriminant bases (F-LDB) algorithm of Ince
(a) Undamaged
(b) Cracked
et al. (2006) was used to adaptively segment the time-frequency plane and extract relevant features from the impact acoustic signal for classification. The adaptive time-frequency plane feature extraction procedures and pre-and post-processing steps are discussed below.
Adaptive Time-Frequency Segmentation
The F-LDB algorithm expands the signal into orthonormal bases using cosine packets, a local trigonometric transform, in consecutive time segments, and finds those segments with a merge/divide strategy, where the distance between the spectra of different classes is maximum. This iterative procedure adjusts the width of time windows to increase the distance between signals. Once the signals are segmented along the time axis, they are represented by local cosine transform. In the next step, the merge/divide strategy is repeated along the frequency axis to group consequent discriminative frequency indices. Here, consecutive frequency indices were merged only if their union had larger discrimination power than that of the individual indices treated separately. The procedure described above is basically a clustering approach by cost function maximizaï tion and produces adaptive frequency segmentation suitable for discrimination in each time segment. The reader is referred to Ince et al. (2006) for detailed description of the algorithm.
Although the acoustic recordings were triggered with optical sensors, temporal variability exists in the observed signals due to different travel time of the food kernels from the feeder to the impact plate. Since the cosine packet transform is not shift invariant, this temporal variability may cause variance in the extracted features for classification. For instance, small shifts of the signal in the time axis cause abrupt changes in local cosine packet coefficients. In order to deal with this problem, the ”spin cycle” procedure of Ince et al. (2006) and Saito et al. (2002) was applied to the training and test data, as indicated in figure 2, prior to the time and frequency segmentation step. The spin cycle procedure generates several copies of a signal by shifting it to the left and right for a number of given samples. In this study, a one-sample spin cycle procedure was implemented, and as a result three copies of each record were created: the original signal, and one-sample left and right shifted copies of it. This expands the dataset with several instances of each record to simulate the temporal variability in the time axis. Each of these records is processed separately by the time-frequency analysis method for feature extraction and used in the final classification. By using this procedure, the overall algorithm becomes more robust against the temporal variability in the recorded signals. The reader is referred to Saito et al. (2002) and Ince et al. (2006) for further details.
There are various choices for distance measures to be used in constructing the time segmentation. This study used the Euclidean distance between the cumulative probability distributions of each expansion coefficient under class 1 and class 2, respectively, estimated via a histogram.
Dimension Reduction and Classification
Once the t-f segmentation was completed, the Fisher class separability criterion was used for sorting the features:
(
)
2 2 2 1 2 2 1 F s + s m − m = (1)where μ and σ are the mean and standard deviation, respectively, of the feature they correspond to. This step is referred to as class separability criterion based sorting (CS). This enabled us to filter out features that have small discrimination power and use those with higher discrimination information for the final decision.
Although the CS step eliminates most of the irrelevant features, there is still need to compact the top rank of the feature set to remove the correlations between features and reduce the dimensionality. As a last step, principal component analysis (PCA) was implemented on the top discriminant feature set returned from the CS step. The PCA-processed top feature set was input to a linear discriminant analysis (LDA) function.
Since the one-sample spin cycle procedure was used in the pre-processing stage, there were three multiple instances of a particular signal, i.e., shifted to the left and right by one sample along with the original recording with no shifts. In the classification stage, these multiple instances of the signal were classified separately, and a majority voter scheme was implemented for the final decision. For example, when an impact signal was recorded, it was first shifted by one sample to the left and one sample to the right. Then, for each of these instances, the features were calculated for the learned t-f segments and fed to the classifier. Finally, a majority voter post-processed the classification outputs for all shifts. The majority voter simply counted the classification outputs (votes) for each shift for a particular signal and assigned the signal to the class with the maximum number of votes.
As indicated in the previous sections, the F-LDB procedure creates t-f segmentation for two-class problems. Since there are four classes (UD vs. IDK, pupal, and scab) in the wheat kernel inspection problem, the following strategy was used:
S All damaged wheat kernel types are classified versus UD in a single step.
S Each damaged wheat kernel type is classified versus UD in a pairwise manner.
The impact acoustic signals corresponding to wheat kernels (UD, IDK, scab, and pupal) were 1024 samples long, while those corresponding to cracked and healthy hazelnut shells were 960 samples long. The minimum window size used for the time axis segmentation with the F-LDB procedure was selected to be 16 samples for wheat and 32 samples for hazelnuts. After a visual inspection, it was observed that the impact acoustics patterns for wheat records have very short living transients compared to hazelnut records (figs. 3 and 4). Therefore, shorter windows were selected in the analysis of wheat signals. The smooth overlapping part of the windows was set to half of the minimum window size. A one-sample spin cycle procedure was used before processing the signals. After completing the time-frequency segmentation with F-LDB, the features were converted to log scale, normalized, and sorted by the F criterion. The top 128 features were processed by PCA and sorted according to the corresponding eigenvalues in descending order. A 2×2-fold cross-validation was implemented to estimate the classification error. First, the dataset was randomly distributed. Half of the record set was used in the training stage to find most the discriminant t-f features, PCA and LDA weights. The remaining set was used to test the performance of the learned parameters. This
experiment was repeated twice. In order to compare the efficiency of the proposed algorithm, the features used by Pearson et al. (2005) were also extracted and referred to as the reference approach (RA). These features were extracted from the short time variances of signal segments, maximum signal amplitudes, spectral peak locations, and the parameters of a Weibull function approximation of the envelope of the impact signal parameters. The same features were used in the wheat and hazelnut experiments for comparison purposes.
In order to asses the efficiency of extraction time-frequency features with adaptive tilings in the classification of impact acoustic signals, experiments with fixed time-frequency tilings were conducted. In particular, the time-frequency features were computed by segmenting the signals into fixed-width time windows (W) with 32 or 64 sample lengths and then calculating 4 or 8 subband (SB) features in each time window with equal bandwidth. The extracted feature set was post-processed with PCA and fed to LDA for final decision, as in the previous experiments.
R
ESULTS ANDD
ISCUSSIONWHEAT CLASSIFICATION
Table 1 shows the classification results when undamaged (UD) wheat kernels were classified against all IDK, scab, and pupal damaged kernels with a one-against-all strategy. In particular, single time-frequency plane segmentation and a single LDA classifier were constructed to discriminate between undamaged and all damaged wheat kernels. The algorithm yielded high accuracy for IDK (95.9%) and scab types (91.2%). However, it resulted in poor classification accuracy (61%) for pupal damaged kernels. Based on these results, time-frequency segmentations and classifiers were designed to discriminate between undamaged kernels vs. IDK, undamaged kernels vs. scab, and undamaged kernels vs. pupal. In this scheme, the final classification can be done in a cascaded classification strategy. In particular, a new observed acoustic signal can be tested for IDK damage, then scab damage, and finally for pupal damage.
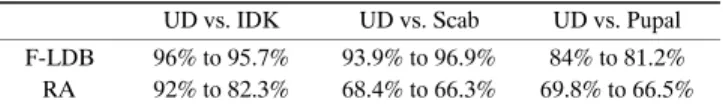
As indicated previously, paired discrimination is recognized as a one-against-other classification strategy (Hastie et al., 2001; Alpaydin, 2004). The results of using such a technique are presented in table 2. The pairwise approach provided improvements in classification of pupal damaged kernels. In particular, using the paired classification strategy, the classification accuracy rate for pupal damaged kernel improved from 62% to 81%. Note that the classification accuracies of undamaged and scab types are slightly higher in the paired classification strategy. Also note that time-frequency plane feature extraction and the classification algorithm outperformed the reference approach (RA), especially for the scab and pupal damaged kernels. The paired classifier using adaptively segmented time-frequency plane features significantly outperformed the RA in all UD vs. IDK, UD vs. scab, and UD vs. pupal discriminations (p = 2.3 × 10⁻⁷, p = 2.7 × 10⁻⁸, p = 8.5× 10⁻⁷,
t-test, respectively).
The results discussed above suggest that the pupal class has features distinct from the IDK and scab classes. To understand why the F-LDB approach yields better results than the RA approach with the paired classification
Table 1. Classification accuracies obtained with F-LDB in separating undamaged kernels (UD) from damaged kernels in a single step.
UD IDK Scab Pupal
F-LDB 90% 95.9% 91.2% 61%
Table 2. Classification accuracies obtained with F-LDB and reference approach (RA) in separating undamaged kernels (UD) from damaged kernels. The results belong to paired classifications.
UD vs. IDK UD vs. Scab UD vs. Pupal F-LDB 96% to 95.7% 93.9% to 96.9% 84% to 81.2% RA 92% to 82.3% 68.4% to 66.3% 69.8% to 66.5%
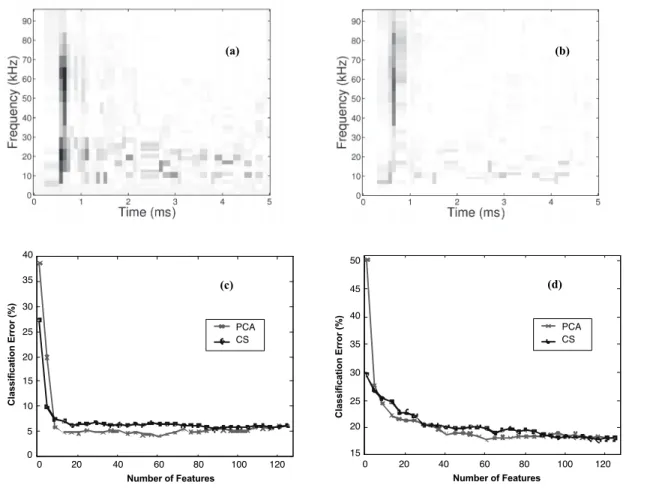
technique, the scab and pupal damaged data were studied in more detail. Consider the time-frequency locations/features selected by the F-LDB method shown in figure 5 for UD vs. scab and UD vs. pupal kernel classification. Interestingly, the moment of impact where maximum signal amplitude was observed and several time-frequency locations on the tail of the signal were selected by the algorithm. These post-impact features appeared to be the most discriminative features and resulted in a lower error rate. It is possible that the features on the tail of the signal might be related to the vibration of the metal plate or turbulence in the air. Note that different time-frequency segmentations were constructed in the impact and post-impact regions. The time windows were quite short in the early impact region, while wider windows and narrow frequency indices were selected in the post-impact region. Furthermore, the time-frequency maps partly explain the degradation in performance in the one-against-all classification strategy. As seen in figures 5a and 5b, the time-frequency locations selected for pupal and scab damaged kernels are different. A rapid transition from lower to higher bands in scab features was observed. Contrary to pupal kernel discrimination, mostly higher bands were utilized by the algorithm. The capability of the algorithm to adjust the time-frequency segmentations for a given damage type can be critical for obtaining good results. Also note that, for both scab and pupal kernel classification, post-processing with PCA resulted in lower error rates, as indicated in figures 5c and 5d. Recall that the CS ordered features are post-processed with PCA for dimension reduction and decorrelation of the top rank. This final signal processing step slightly improved the final classification accuracy.
These results indicate that using the one-against-other strategy provides higher recognition accuracies for damaged wheat kernels. To preserve the high classification accuracy for all types, a cascaded discrimination strategy, as indicated in figure 6a, could therefore be used in practice. The cascaded classification engine integrates three paired classifiers (UD vs. IDK, UD vs. scab, and UD vs. pupal). Specifically, when a new impact acoustic signal is observed, the system first tests for IDK damage. If the system decides that no IDK damage is present, it tests for scab damage. If no scab damage is detected, it finally checks for pupal damage. In the current system, the least accurate classifier is the one that detects pupal damaged kernels. A receiver operating characteristic (ROC) curve for the UD vs. pupal damaged classifier is plotted in figure 6b. The current operating point is shown with a solid arrow. In order to improve the true positive rate to 95%, a high false positive rate (dashed arrow) must be tolerated as well.
(a) (b)
Number of Features 0 20 40 60 80 100 Classification Error (%) 40 35 30 25 20 15 10 5 0 (c) 120 PCA CS
Number of Features 0 20 40 60 80 100 Classification Error (%) 40 35 30 25 20 15 (d) 120 PCA CS 50 45
Figure 5. The t-f features selected for (a) UD vs. scab and (b) UD vs. pupal classification. The darker features have more discrimination power. Both graphs are visualized with the same scale to emphasize the difference in the discrimination power of extracted features. The bottom row shows the classification error versus the number of features that were sorted by a class separability criteria (CS = F) and PCA. The error curves belong to (c) UD vs. scab and (d) UD vs. pupal. Note the lower error rates for PCA with a smaller number of features.
HAZELNUT CLASSIFICATION
The proposed system achieved 97.1% classification accuracy in separating the undamaged hazelnut shells from cracked shells. In particular, the undamaged and cracked shell hazelnuts were recognized with 99.2% and 95% accuracies, respectively. A classification accuracy of 91.8% was reported by Kalkan and Yardimci (2006) on this same dataset by manually selecting the most discriminative
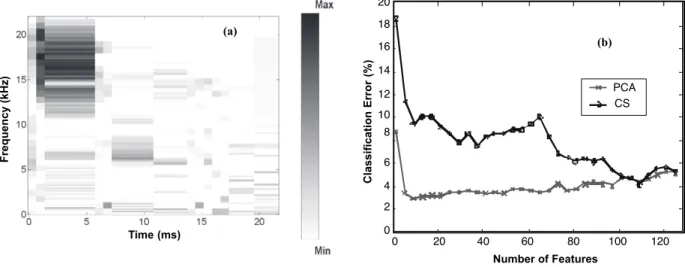
subbands and using their energies for classification. These results suggest that adaptively segmented time-frequency plane features significantly outperformed the results of Kalkan and Yardimci (2006) (p = 0.0061, t-test). The discriminant time-frequency features selected by the algorithm are shown in figure 7a. This figure indicates that the most discriminant features are located in high-frequency bands following impact. Kalkan and Yardimci (2006) also
IDK−UD Classifier 95.7% 96.9% 81.2% 84% 96% 93.9% Time−Frequency Features of
Impact Acoustic Signal
(a) Scab−UD Classifier Pupal−UD Classifier
(b)
False Positive Rate
True Positive Rate
Figure 6. (a) Cascaded classification strategy and (b) ROC curve of UD vs. pupal classifier output. The solid curve was obtained with the spin cycle procedure, and the dashed curve was obtained without the spin cycle. Note that improving the classification accuracy above 90% involves higher false positive rates. Note also that the spin cycle preprocessed classifier has higher accuracy.
(a) Time (ms) Frequency (kHz)
Number of Features 0 20 40 60 80 100 Classification Error (%) 10 8 6 4 2 0 (b) 120 PCA CS 14 12 18 16 20
Figure 7. (a)The t-f features selected for separation of cracked hazelnuts from undamaged nuts. The darker features have more discrimination power. Note that the higher frequency band is primarily selected by the algorithm. (b) The classification error curve obtained with and without PCA post-processing. Note that PCA provides lower error rates with a minimal number of features.
reported higher bands as crucial frequency indices after manually inspecting several subbands with wavelet transform. The algorithm proposed in this article learned these indices automatically from the data.
As in the wheat classification results, the PCA post-processing step improved the classification accuracies. In figure 7b, the classification error curves versus the number of features for PCA and CS are given. Here, the use of PCA improved the classification accuracy from 96% to 97.1% with a small number of features. This shows the importance of post-processing the t-f features sorted by the F criterion, which does not account for the correlation or interaction between extracted features.
EXPERIMENTWITH FIXED RESOLUTION FEATURES
Table 3 shows the classification results for wheat and hazelnuts computed using time-frequency features with fixed resolution. Note that the classification accuracies obtained with fixed resolution were quite poor for wheat kernel classification. For hazelnut classification, the fixed resolution results were slightly lower than adaptive arbitrary tilings. In general, an improvement in classification accuracies was observed when shorter time windows were utilized in wheat kernel classification. Interestingly, it has been observed that the undamaged kernels were better discriminated when longer windows were used in UD vs. scab kernel discrimination. When shorter windows (32 samples) were used with eight subbands, the undamaged kernel recognition accuracy dropped to 82.4% from 87.6%. In contrast, the scab kernel recognition accuracy was improved from 75.5% to 79.1%. Similar results were observed for pupal kernel classification. When the number of
subbands increased from 4 to 8 with 32 sample long time windows, the undamaged kernel recognition accuracy dropped from 76.4% to 74.7%. In contrast, the pupal kernel recognition accuracy slightly increased.
For the hazelnuts, the classification accuracies obtained with arbitrary and fixed time-frequency tilings were similar. The arbitrary tilings provided slightly better results (97.1%) than fixed tilings (96.5%). Note that the adaptive time-frequency plane tilings for hazelnuts were not as complex as for wheat kernels (figs. 6 and 7). Therefore, nearly the same discriminant information can be captured with fixed tilings. Note also that larger windows provided better results, and the number of subbands did not have much effect on the recognition accuracy.
The results obtained indicate that different kernels can be discriminated with distinct time-frequency segmentations. Furthermore, when the segmentations are adapted to the problem, the classification accuracies dramatically increase.
COMPUTATIONAL COMPLEXITY
The t-f segmentation steps are completed off-line. After learning the most discriminative segments in an off-line manner, it is only necessary to process the impact acoustics data at the selected time-frequency locations in real time. The processing includes calculating the expansion coefficients in the learned time segments, merging the coefficients in the frequency domain, projecting the resulting features onto the principal components, and feeding the results into LDA.
The spin cycle procedure, which is used to eliminate the lack of translation invariance of local cosine packets, adds additional complexity to the proposed system, since it entails estimating the expansion coefficients for several shifts of the
Table 3. Classification accuracies obtained with fixed resolution time-frequency patterns for wheat kernels and hazelnuts (W = length of time windows in number of samples, and SB = number of subbands computed in each time windows).
Wheat Hazelnut
UD - IDK UD - Scab UD - Pupal UD - Cracked
W = 64, SB = 4 87.2% - 83.0% 73.4% - 67.5% 71.2% - 72.6% 98.7% - 93.1% W = 64, SB = 8 88.2% - 87.1% 87.6% - 75.5% 74.4% - 73.8% 98.9% - 93.6% W = 32, SB = 4 90.9% - 86.5% 76.9% - 73.5%. 76.4% - 74.0% 97.8% - 93.1% W = 32, SB = 8 89.5% - 89.5% 82.4% - 79.1% 74.7% - 74.5% 98.9% - 92.3%
recorded data. For real-time applications, the average of expansion coefficients for consecutive shifts might be used instead. Another solution could be using transformations that satisfy the translation invariance condition. Although the system can classify wheat samples with higher accuracies, the need to recalculate features in the paired hierarchical classification strategy can be a drawback. This may boost the computations required by the system, resulting in lower processing speeds. In order to evaluate the processing speed of the proposed approach, the speed of the algorithm was tested on a desktop PC equipped with 1.8 GHz processor and 512 MB of memory. Processing of a single wheat sample took approximately 0.027 s. This corresponds to a processing speed of nearly 37 samples per second on the top node of the classification system. Since at least three steps are required for UD wheat kernel recognition, they cannot be processed with a speed of more than 12 kernels per second. The processing speed for hazelnuts was 77 kernels per second. Since the classification was implemented in a single step and minimal error was achieved with small number of features, the processing speed was quite fast for cracked hazelnut separation.
C
ONCLUSIONIn this article, an adaptive time-frequency plane feature extraction and classification technique to discriminate between damaged and undamaged food kernels by analyzing related impact acoustics signals was investigated. In particular, the study focused on the problems of detecting damaged wheat kernels and hazelnuts with cracked shells. The procedure requires no prior knowledge of the relevant time-frequency indices of the impact acoustics signals for classification. The method automatically learns all crucial time-frequency indices from the training data by implementing individual time and frequency band adaptation. Discriminant features were extracted from the adaptively segmented acoustic signal, sorted according to a Fisher class separability criterion, post-processed by principal component analysis, and fed to linear discriminant classifier for final decision. The approach achieved classification accuracies in paired separation of undamaged wheat kernels from insect-damaged kernels with exit holes, kernels with hidden damage at the pupal stage, and scab damaged kernels of 96%, 82%, and 94%, respectively. For the cracked shell vs. undamaged hazelnut separation, the overall accuracy was 97.1%. The results indicate that adaptive time-frequency features extracted from impact acoustic signals provide improved accuracies in damaged food kernel inspection when compared to baseline methods, which used features from the time or frequency domain with fixed resolution. The adaptation capability of the algorithm to both the time and frequency content of signals makes it a universal method for food kernel inspection that can resist the impact acoustic variability between different kernels and damage types, even though in certain cases it may have a relatively high computational complexity.
ACKNOWLEDGMENT
This work was supported by the scientific and technological research council of Turkey (TUBITAK) under the grant 106E057.
R
EFERENCESAlpaydin E. 2004. Introduction to Machine Learning. Cambridge, Mass.: MIT Press.
Bruce, W. A., W. M. Street, R. C. Semper, and D. Fulk. 1982. Detection of hidden insect infestations in wheat by infrared carbon dioxide gas analysis. ARS Bulletin AAT S-26. Washington, D.C.: USDA-ARS.
Christensen, C. M., and R. A. Meronuck. 1986. Quality
Maintenance in Stored Grains and Seeds. Minneapolis, Minn.:
University of Minnesota Press.
Dichter, C. R. 1984. Risk estimates of liver cancer due to aflatoxin exposure from peanuts and peanut products. Food Chemistry
and Toxicology. 22(6): 431-437.
Dowell, F. E., J. E. Throne, and J. E. Baker. 1998. Automated nondestructive detection of internal insect infestation of wheat kernels by using near-infrared reflectance spectroscopy. J. Econ.
Entomol. 91(4): 899-904.
Hastie, T., R. Tibshirani, and J. Friedman. 2001. The Elements of
Statistical Learning. New York, N.Y.: Springer.
Ince, N. F., S. Arica, and A. H. Tewfik. 2006. Classification of single trial motor imagery EEG recordings by using subject adapted non-dyadic arbitrary time-frequency tilings. J. Neural
Eng. 3(3): 235-244.
Kalkan, H., and Y. Yardimci. 2006. Classification of hazelnuts by impact acoustics. In Proc. IEEE Machine Learning for Signal
Processing Congress. Piscataway, N.J.: IEEE.
Karunakkaran, C., D. S. Jayas, and N. D. G. White. 2003. Soft x-ray inspection of wheat kernels infested by Sitophilusoryzae.
Trans. ASAE 46(3): 739-745.
Maghirang, E. B., F. E. Dowell, J. E. Baker, and J. E. Throne. 2003. Automated detection of single wheat kernels containing live or dead insects using near-infrared reflectance spectroscopy. Trans.
ASAE 46(4): 1277-1282.
Mallat, S. 1999. A Wavelet Tour of Signal Processing. 2nd ed. San Diego, Cal.: Academic Press.
Onaran, I., T. C. Pearson, Y. Yardimci, and A. E. Cetin. 2006. Detection of underdeveloped hazelnuts from fully developed nuts by impact acoustics. Trans. ASABE 49(6): 1971-1976. Pearson, T. C. 2001. Detection of pistachio nuts with closed shells
using impact acoustics. Applied Eng. in Agric. 17(2): 249-253. Pearson T., A. E. Cetin, A. H. Tewfik, and R. P. Haff. 2005.
Feasibility of impact-acoustic emissions for detection of damaged wheat kernels. Digital Signal Proc. 17(3): 617-633. Pederson, J. 1992. Insects: Identification, damage, and detection. In
Storage of Cereal Grains and Their Products. D. B. Sauer, ed.
St. Paul, Minn.: American Association of Cereal Chemists. Saito, N., R. R. Coifman, F. B. Geshwind, and F. Warner. 2002.
Discriminant feature extraction using empirical probability density and a local basis library. Pattern Recog. 35(12): 1842-1852.
USDA. 2008. Official U.S. standards for grain. Washington, D.C.: USDA-GIPSA. Available at:
www.gipsa.usda.gov/GIPSA/webapp?area=home&subject=grpi &topic=sq-ous.
Vetterli, M. 2001. Wavelets, approximation, and compression. IEEE
Signal Proc. Magazine (Sept.): 59-73.
Wickerhauser, M. V. 1994. Adapted Wavelet Analysis from Theory