Effects of season and altitude on biological active certain phenolic
compounds levels and partial standardization of propolis
Hasan Hüseyin ORUÇ
1, Ali SORUCU
2,
Hasan Hüseyin ÜNAL
3, Levent AYDIN
41 Uludag University, Faculty of Veterinary Medicine, Department of Pharmacology and Toxicology; 2Institute of Healthy Science, Bursa; 3 Pendik Veterinary Control and Research Institute, Toxicology Section, İstanbul; 4 Uludag University, Faculty of Veterinary
Medicine, Department of Parasitology, Bursa, Turkey.
Summary: Propolis has antibacterial, antiviral, antifungal, anti-inflammatory, antitumoral, antioxidant, immunomodulatory, tissue regeneration, anti-ulcer, analgesic, local anaesthetic, and antiseptic effects related to its chemical components. The aim of the present study was to determine certain biological active phenolic compounds and their levels in propolis collected from Bursa province, and to evaluate propolis quality and effects of altitude and season. Propolis samples were collected using propolis traps from 15 different constant apiaries at varying altitudes (between 50 and 1000 m) located in Bursa province Turkey, during the spring, summer and autumn of 2012. Fourteen flavonoid and phenolic acids in ethanolic extracts were investigated by liquid chromatography tandem-mass spectrometry (LC-MS/MS). Galangin, naringenin, pinocembrin, caffeic acid and caffeic acid phenylethyl ester were detected in all samples (45 samples) for all seasons and altitudes. Significant differences were determined for certain phenolic compounds levels across altitudes and seasons. In the present study results showed that qualitative and quantitative analysis of propolis for useful phenolic compounds may provide partial standardization of propolis depend on altitude and season.
Keywords: Altitude, phenolic compounds, propolis, season.
Mevsim ve rakımın propolisteki biyolojik olarak aktif belirli fenolik bileşiklerin düzeylerine etkisi ve
propolisin kısmi standardizasyonu
Özet: Propolis kimyasal içeriğine bağlı olarak antibakteriyel, antiviral, antifungal, anti-inflamatuar, antitumoral, antioksidan, immunmodulator, doku yenileyici, antiülser, analjezik, lokal anastezik ve antiseptik etkilere sahiptir. Bu çalışmanın amacı, Bursa ilinden toplanan propolislerde biyolojik olarak etkisi bulunan fenolik bileşiklerin nitel ve nicel olarak saptanması, kalitesinin belirlenmesi ve bunda yükseklik ve mevsimin etkisinin değerlendirilmesidir. Propolis numuneleri, 2012 yılında ilkbahar, yaz, sonbahar mevsimlerinde, Bursa ilinde değişen rakımlarda bulunan (50-1000 m arası), 15 sabit aralıktan, propolis tuzakları kullanılarak toplandı. Propolislerde, 14 flavanoid ve fenolik asit sıvı kromatografi kütle/kütle spektrometresi (LC-MS/MS) ile analiz edildi. Galangin, naringenin, pinosembrin, kafeik asit ve kafeik asit feniletil ester tüm numunelerde (45 numune), tüm mevsim ve rakımlarda tespit edildi. Bazı fenolik bileşiklerin miktarlarında rakım ve mevsime bağlı olarak anlamlı değişiklikler tespit edilmiş olup, bu bulguların propolisin kısmi standardizasyonun yapılmasına yardımcı olabilecek nitelikte olduğu sonucuna varıldı.
Anahtar sözcükler: Fenolik bileşikler, mevsim, propolis, rakım.
Introduction
Propolis (bee glue) is a product of the honeybee such as bee venom, honey, pollen, royal jelly, propolis, and beeswax. It is a resinous material collected by honeybees from buds and cracks in the bark of certain plants, typically from poplar, beech, horse chestnut, birch and conifer trees. Bees mix this substance with beeswax and bee enzymes (β-glycosidase) that they secrete during propolis collection. Honeybees use propolis to smooth out the internal walls of the hive as well as to protect the colony from diseases and to cover the carcasses of intruders who died inside the hive, thus preventing their decomposition (12). Propolis contains a wide variety of phenolic compounds, typically phenolic acids and
flavonoids with biological effects. Several pharmacological effects have been attributed to propolis, especially ethanolic propolis extracts, such as antibacterial, antioxidant, antiviral, fungicidal, anti-inflammatory, anticarcinogenic, antiapoptotic, immunomodulatory and gastric protective (antiulcer) effects (4, 6, 13, 24). In veterinary medicine, propolis is reportedly active against fungal otitis (8, 15) and dermatomycosis in dogs (11), and may also use for treatment of bovine dermatophytosis (7). The functional properties of propolis are dependent on its chemical constituents which may vary according to season, geography, and plant sources (13). The influence of seasonality on the chemical composition of propolis extracts has been reported in previous studies (9, 13, 21).
In our knowledge, there is no comprehensive report about influence of season and especially altitude on the chemical constituents and levels of propolis. In addition, there are limited reports (1, 12) on phenolic compounds levels with biological effects of propolis in Turkey. Recently, propolis has also been extensively used in the food industry as an additive for health foods, beverages and nutritional supplements to improve health and prevent diseases (4). For these reasons, the aim of this study was to measure 14 biological active phenolic compounds (flavonoids and phenolic acids) to determine the seasonal and altitudinal differences. Therefore, to provide useful data for the partial standardization of propolis and to compare the detected levels with the results of similar previous reports.
Materials and Methods
Chemicals and solvents: Galangin, quercetin (hydrate), kaempferol, gallic acid, naringenin (±), pinocembrin, apigenin, cinnamic acid (trans), luteolin, p-coumaric acid, caffeic acid, caffeic acid phenylethyl ester, ferulic acid (trans) and rutin (trihydrate) were purchased from Sigma–Aldrich (St Louis, MO, USA). HPLC-grade methanol, acetonitrile and analytical grade ethanol and formic acid were purchased from Merck (Darmstadt, Germany). Water was purified using an ELGA LabWater, Purelab flex (Marlow, Buckinghamshire, UK) system.
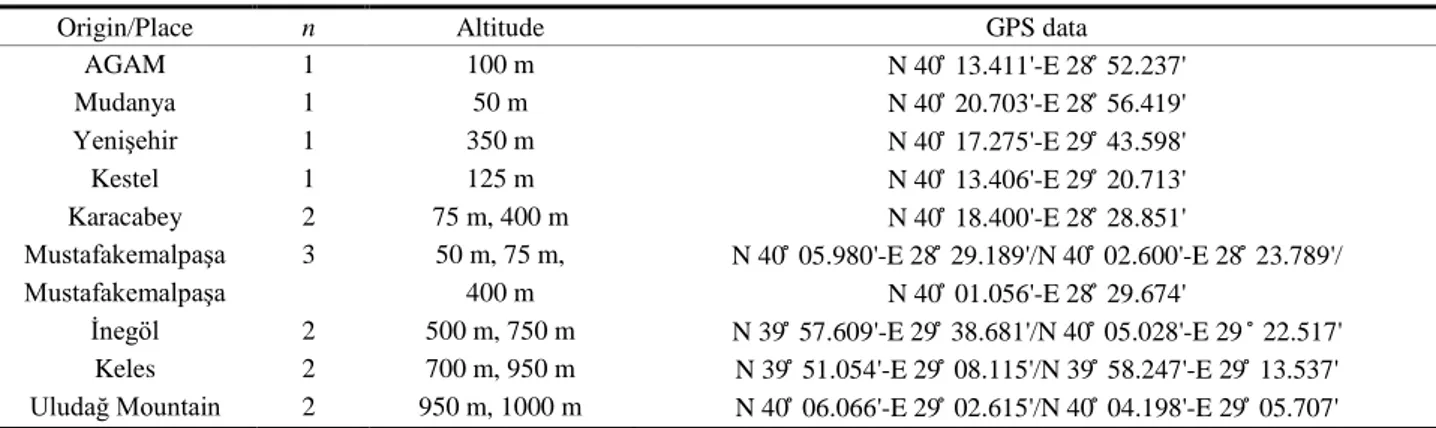
Samples: In this study, 15 constant apiaries were selected by Uludag University, Beekeeping Development and Research Centre (AGAM) and Uludag Beekeeping Union in Bursa. Propolis samples (50-350 g) were collected in the spring, summer and autumn (totalling 45 samples) of 2012. The samples were collected from different altitudes that ranged between 50 and 1000 m, including 30 samples from 10 apiaries from altitudes below 600 m and 15 samples from 5 apiaries from altitudes above 600 m, using propolis traps (Civan Incorporation, Bursa, Turkey). The location, number, altitude and GPS (Garmin e Trex Legend H, Kansas, USA) data of the apiaries are presented
in Table 1. The most common plants which are the possible sources of propolis around the apiaries were Salix spp., Populus spp., Quercus spp., Pinus spp., Tilia spp., Juglans spp. and Castanea spp.
Extraction of phenolic compounds from raw propolis: The extraction step was essentially performed as described in Erdogan et al. (12) and Trusheva et al. (23). In brief, the steps were as follows: the frozen sample of raw propolis (30-50 g) was cut into small pieces and finely powdered using a coffee grinder (DeLonghi KG 49). During the extraction, the applied sample-to-solvent ratio was 1:10 (w/v). The method was based on a weighed amount of propolis sample (2.00 g) with 20 mL of 70% EtOH stirred at ambient temperature for 1 h, after which the sample subjected to ultrasonication for 15 min (Bandelin, Sonorex, RK 100). After ultrasonication, the propolis solution was filtered by Whatman filter paper (No: 1). The hydroalcoholic solvent filtrates were evaporated using a vacuum centrifuge (Jouan, RC 10-10) until a dried propolis ethanolic extract (DPEE) was obtained. The DPEE was dissolved in absolute methanol (1:60, w/v) for LC analysis and filtered through a polyvinyl difluoride (PVDF) syringe filter (Millipore Millex-HV, 0.45 µm), and 5 μL injected in the LC-MS/MS system (Zivak Technologies, Istanbul, Turkey). The analyses were performed in duplicate.
LC-MS/MS conditions, quantification and statistical analysis: The analysis was essentially performed according to Pellati et al. (17). The chromatographic system consisted of a Zivak HPLC and Zivak Tandem Gold Triple quadrupole mass spectrometry, equipped with a C18 column (150x2.1 mm ID, 3 μm particle size, Phenomenex, Germany) at a flow rate of 1.2 mL/min. The separation was performed by means of linear gradient elution (eluent A, 0.1% formic acid in water; eluent B, acetonitrile 0.1% formic acid in acetonitrile). The gradient elution was applied from minutes 0 to 5 for solvent B from 20% to 30%, between minutes 5 and 6.18 for solvent B from 30% to 45%, between minutes 6.18 and 10 for solvent B from
Table 1. Origin, altitude and GPS data for the 15 sampling locations in Bursa, Turkey. Tablo 1. Bursa’da numune toplanan 15 yer, yükseklik ve koordinat bilgileri.
Origin/Place n Altitude GPS data
AGAM 1 100 m N 40 ̊ 13.411'-E 28 ̊ 52.237'
Mudanya 1 50 m N 40 ̊ 20.703'-E 28 ̊ 56.419'
Yenişehir 1 350 m N 40 ̊ 17.275'-E 29 ̊ 43.598'
Kestel 1 125 m N 40 ̊ 13.406'-E 29 ̊ 20.713'
Karacabey 2 75 m, 400 m N 40 ̊ 18.400'-E 28 ̊ 28.851'
Mustafakemalpaşa 3 50 m, 75 m, N 40 ̊ 05.980'-E 28 ̊ 29.189'/N 40 ̊ 02.600'-E 28 ̊ 23.789'/
Mustafakemalpaşa 400 m N 40 ̊ 01.056'-E 28 ̊ 29.674'
İnegöl 2 500 m, 750 m N 39 ̊ 57.609'-E 29 ̊ 38.681'/N 40 ̊ 05.028'-E 29 ̊ 22.517' Keles 2 700 m, 950 m N 39 ̊ 51.054'-E 29 ̊ 08.115'/N 39 ̊ 58.247'-E 29 ̊ 13.537' Uludağ Mountain 2 950 m, 1000 m N 40 ̊ 06.066'-E 29 ̊ 02.615'/N 40 ̊ 04.198'-E 29 ̊ 05.707' AGAM: Uludag University, Beekeeping Development and Research Centre.
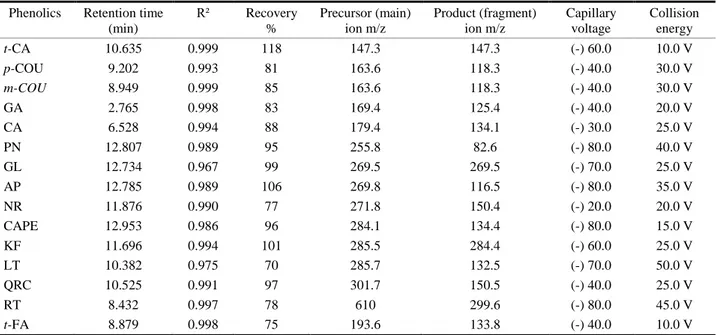
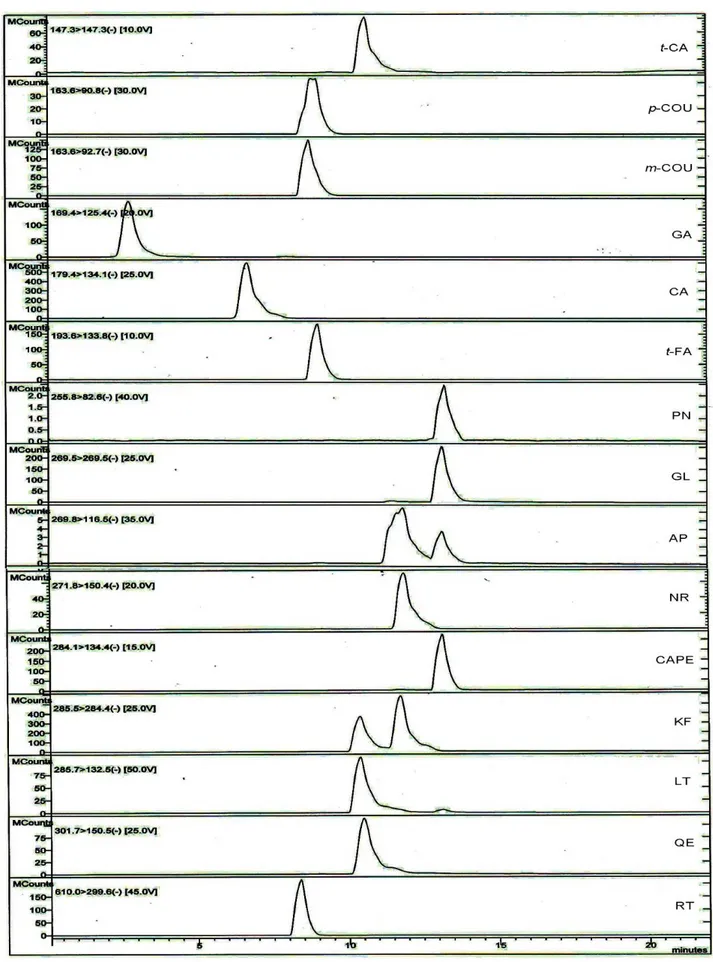
45% to 50%, between minutes 10 and 11.59 for solvent B from 50% to 83%, between minutes 11.59 and 17.29 from 83% to 100%, between minutes 17.29 and 19 for solvent B from 100% to 20% and between minutes 19 and 25 for solvent B from 20%. The stock standard solution of the phenolic compounds was prepared with methanol (1 mg/mL). The calibration curve was generated using five data points (3, 6, 12, 24, 48 µg/mL). The LOD and LOQ of the method have been determined in the range of 0.21-0.84 μg/mL to 0.63-2.52 μg/mL, respectively. Four different propolis samples were separated and homogenized propolis samples were weighed 2g for two groups for recovery calculation. Mix phenolic compounds standard solution were added 40, 20, 10 μg for 2g each propolis samples of group 2. Propolis samples in group 1 were used as control. The extraction method was exactly performed for two groups samples. All the samples analysed by LC-MS/MS system. Mean levels of results were used and rates of recoveries were calculated. Details of the retention times, correlation coefficients (R²), recovery, collision energy, capillary voltage, precursor (main) ion and product (fragment) ion of phenolic compounds are also shown in Table 2, and the spectra of phenolic compounds are shown in Figure 1.
Statistical analysis: Statistical analysis was performed using SPSS 13.0 software for Windows and Smart Viewer (SPSS Inc., Chicago, IL, USA). The independent samples t-test was used for altitudes, one-way ANOVA was used for seasonal differences, and Tukey HSD was used as a post-hoc test.
Results
In total, 14 target phenolic compounds were identified and quantified by LC-MS/MS. The mean phenolic compound concentrations in the propolis samples for each season and altitude are presented in Table 3 and Table 4, respectively.
Discussion and Conclusion
In the present study, 14 target phenolic compounds were widely detected in the propolis samples for all altitudes and seasons. The flavonoids galangin, naringenin, and pinocembrin and the phenolic acids and esters caffeic acid and CAPE were among the most abundant compounds (detected in all samples 100%) present in the propolis samples collected from Bursa region for all seasons and altitudes. The other phenolic compounds, including apigenin, quercetin, kaempferol, luteolin, rutin, gallic acid, cinnamic acid, p-coumaric acid, and ferulic acid, were also detected at high ratios (71-99%) in the propolis samples. Bud exudates of different poplar buds are the main source of propolis, and the main phenolics including flavonoid aglycones such as pinocembrin, naringenin, quercetin, galangin, kaempferol and including hydroxycinnamic acids and their esters such as caffeic acid, CAPE, m-coumaric acid, p-coumaric acid and ferulic acid are predominant in propolis samples in Europe, Asia and North America (3, 24). Our results were also in agreement with the data as Populus spp. (poplar) was one of the main propolis sources determined in this study as well.
Table 2. The retention time, correlation coefficients, recovery, MS and MS/MS characteristics of phenolic compounds. Tablo 2. Fenolik bileşiklerin geliş süreleri, doğrusallık, geri kazanım, MS ve MS/MS bilgileri.
Phenolics Retention time (min) R² Recovery % Precursor (main) ion m/z Product (fragment) ion m/z Capillary voltage Collision energy t-CA 10.635 0.999 118 147.3 147.3 (-) 60.0 10.0 V p-COU 9.202 0.993 81 163.6 118.3 (-) 40.0 30.0 V m-COU 8.949 0.999 85 163.6 118.3 (-) 40.0 30.0 V GA 2.765 0.998 83 169.4 125.4 (-) 40.0 20.0 V CA 6.528 0.994 88 179.4 134.1 (-) 30.0 25.0 V PN 12.807 0.989 95 255.8 82.6 (-) 80.0 40.0 V GL 12.734 0.967 99 269.5 269.5 (-) 70.0 25.0 V AP 12.785 0.989 106 269.8 116.5 (-) 80.0 35.0 V NR 11.876 0.990 77 271.8 150.4 (-) 20.0 20.0 V CAPE 12.953 0.986 96 284.1 134.4 (-) 80.0 15.0 V KF 11.696 0.994 101 285.5 284.4 (-) 60.0 25.0 V LT 10.382 0.975 70 285.7 132.5 (-) 70.0 50.0 V QRC 10.525 0.991 97 301.7 150.5 (-) 40.0 25.0 V RT 8.432 0.997 78 610 299.6 (-) 80.0 45.0 V t-FA 8.879 0.998 75 193.6 133.8 (-) 40.0 10.0 V
“t-CA”: trans-Cinnamic acid, “p-COU”: p-Coumaric acid, “m-COU”: m-Coumaric acid “GA”: Gallic acid, “CA”: Cafeic acid, “PN”: Pinocembrin, “GL”: Galangin, “AP”: Apigenin, “NR”: Naringenin, “CAPE”: Cafeic acid phenylethyl ester, “KF”: Kaempferol, “LT”: Luteolin, “QRC”: Quercetin, “RT”: Rutin, , “t- FR”: trans- Ferulic acid.
“t-CA”: trans-Cinnamic acid, “p-COU”: p-Coumaric acid, “m-COU”: m-Coumaric acid “GA”: Gallic acid, “CA”: Cafeic acid, “PN”: Pinocembrin, “GL”: Galangin, “AP”: Apigenin, “NR”: Naringenin, “CAPE”: Cafeic acid phenylethyl ester, “KF”: Kaempferol,
“LT”: Luteolin, “QRC”: Quercetin, “RT”: Rutin, , “t- FR”: trans- Ferulic acid. Figure 1. LC-MS/MS chromatograms of phenolic compounds.
T ab le 3 . M ea n lev els o f targ et ph en oli c co m po un ds a cc or din g to se aso ns (µg /g DP EE ). T ab lo 3 . A na li zi ya pıl an f en oli k bil eşik lerin m ev si m e ba ğlı o rtala m a dü ze yleri (µ g/g DP EE ). n GL PN AP NR QRC KF LT RT CA CA P E t-FR t-CA GA p -COU S p rin g 15 42 32 ±3 73 57 46 ±4 99 29 80 ±4 59 10 51 ±7 8 28 07 ±3 83 39 ±1 13 40 2± 10 8 41 ±2 4 50 60 ±5 83 29 10 ±2 13 23 11 ±3 91 21 98 ±2 72 97 ±3 9 20 65 ±3 12 S u m m er 15 42 10 ±5 66 46 74 ±4 84 23 26 ±4 75 99 5± 10 9 27 46 ±3 16 36 0± 12 6 46 7± 12 9 20 ±5 50 14 ±7 67 a26 23 ±2 88 18 28 ±3 17 18 35 ±2 73 99 ±2 8 13 00 ±2 48 A u tu m n 15 55 50 ±9 30 46 50 ±4 41 34 99 ±3 36 12 88 ±8 6 31 12 ±3 42 46 6± 10 3 57 6± 10 2 20 ±8 45 84 ±4 71 b36 87 ±3 66 27 23 ±2 09 21 45 ±6 08 20 7± 80 18 52 ±3 13 “ GL ”: G alan gin , “ P N” : P in oc em brin , “ A P ”: A pig en in , “ NR” : Na rin ge nin , “ QRC” : Qu erc eti n, “ KF”: Ka em pfe ro l, “ L T ”: L uteo li n, “ R T ”: Ru ti n, “ CA ”: Ca fe ic ac id , “ CA P E”: Ca fe ic a cid ph en yleth yl este r, “ F R” : tra n F eru li c ac id , “ t-CA ”: tra n s-Ci nn am ic ac id , “ GA ”: Ga ll ic ac id , “p -CO U” : p -Co um aric ac id , “ ±" : S tan da rd e rro r, sig nif ica nt dif fe re nc es b etw ee n m ea n lev els w it h a a n d b a t sa m e co lu m n (b etw e en a a n d b , p < 0 .0 5 ). T ab le 4 . M in im u m , ma x im u m a n d m ea n lev els o f an al yse d ph en oli c co m po un ds a cc or din g to a lt itu de f or all se aso ns (µg /g DP EE ). T ab lo 4 . A na li zi ya pıl an f en oli k bil eşik lerin y ük se kli ğe b ağ lı (tü m m ev si m le r için ) m in im um , m ak si m um v e ortala m a dü ze yleri (µg /g DPE E ). A lt it u d e n GL PN AP NR QRC KF LT RT CA CA P E t-FR t-CA GA p -COU M in -m ax M ea n M in -m ax M ea n M in -m ax M ea n M in -m ax M ea n M in -m ax M ea n M in -m ax M ea n M in -m ax M ea n M in -m ax M ea n M in -m ax M ea n M in -m ax M ea n M in -m ax M ea n M in -m ax M ea n M in -m ax M ea n M in -m ax M ea n 6 0 0 m b elo w *30 1 1 8 4 -1 2 0 4 8 a54 16 ±5 18 856 -9 6 3 3 52 35 ±3 77 nd -6 1 4 6 27 58 ±3 58 86 -1 8 4 7 a12 15 ±7 1 nd -6 2 2 7 28 64 ±2 60 nd -2 0 0 1 44 9± 87 nd -2 1 1 8 53 1± 89 nd -1 7 9 32 ±1 2 301 -1 0 5 6 8 52 81 ±4 70 565 -5 6 1 3 32 27 ±2 24 nd -4 7 7 1 22 97 ±2 58 nd -3 4 4 2 a17 23 ±1 96 nd -9 4 1 12 2± 41 nd -4 4 8 9 a20 91 ±2 25 6 0 0 m ab o v e **15 767 -3 9 0 2 b31 58 ±2 30 616 -6 1 2 1 46 01 ±3 53 1 0 2 8 -4 7 0 1 32 89 ±2 29 455 -1 2 0 6 b90 5±5 5 858 -5 9 8 3 29 36 ±2 96 nd -1 3 9 0 32 3± 86 60 -1 3 2 1 38 5± 78 nd -3 4 9 18 ±7 423 -6 2 9 6 40 97 ±4 22 499 -5 7 2 4 27 67 ±2 96 74 -3 2 5 7 22 67 ±2 24 152 -1 0 2 2 9 b27 32 ±5 62 nd -7 4 1 15 9± 46 95 -2 2 8 7 b10 36 ± 12 8 “GL” : Ga lan gin , “ P N” : P in oc em brin , “ A P ”: A pig en in , “ NR” : Na rin ge nin , “ QRC” : Qu erc eti n, “ KF”: Ka em pf ero l, “ L T”: L uteo li n, “ R T ”: Ru ti n, “ CA ”: Ca fe ic ac id , “ CA P E”: Ca fe ic a cid ph en yleth yl este r, “ F R” : tra n F eru li c ac id , “ t-CA ”: tra n s-Ci nn am ic ac id , “ GA ”: Ga ll ic ac id , “p -CO U” : p -Co um aric ac id , “ ±" : S tan da rd e rro r, sig nif ica nt dif fe re nc es b etw ee n m ea n lev els w it h a a n d b a t sa m e co lu m n (b etw e en a a n d b , p < 0 .0 5 ). *S am p les w er e co ll ec ted f ro m 1 0 c o n sta n t ap iar ies f o r sp rin g , su m m er an d a u tu m n (n = 1 0 x 3 ). ** S am p les we re c o ll ec ted f ro m 5 c o n sta n t ap iarie s f o r sp rin g , su m m er an d a u tu m n (n = 5 x 3 ).
Differences in the mean level of the target phenolic compounds were observed according to the season and altitude. The CAPE mean level in autumn was significantly higher than in summer (p<0.05) (Table 3). For altitude, the mean levels below 600 m were generally higher than those found above 600 m; these results are in agreement with those reported by Popova et al. (18) for poplar type propolis. The mean galangin, naringenin and p-coumaric acid levels below 600 m were significantly higher (p<0.05) than those above 600 m. In contrast, the mean cinnamic acid level below 600 m was lower than that above 600 m, and this difference was also significant (p<0.05) (Table 4). These differences may be related to the changing of vegetation periods depending on seasons and altitude, and to the differences in climate conditions. These differences may also be related with propolis sources where the hives/apiaries are located but in the present study the locations of hives/apiaries did not change during the course of the study.
The present study results and the similar previous study results were shown in Table 5 for comparison of the results. The flavonoid galangin was detected in all samples as a major compound. The mean levels of galangin were higher than the detected levels in Italy, Macedonia, Ukraine, Argentina and China (16) and also in Argentina (10). The galangin results were lower than those determined in Serbia (25) and Croatia (5), and were similar found in Macedonia (5). Pinocembrin is typical chemical constituent of poplar-type propolis (24). Pinocembrin may be a novel therapy to reduce cerebral ischemia injury due potentially to its antioxidative and antiapoptotic effects (14). Although the pinocembrin levels measured in our study were higher than the reported levels in Italy, Macedonia, Ukraine, Argentina, China (16), Serbia (25), Bosnia and Herzegovina (5) and Finland (20), the mean pinocembrin levels were lower than the maximum reported pinocembrin levels in Croatia (5) and Argentina (10). The apigenin levels were higher when compared with the levels reported in Finland (20), Croatia, Bosnia and Herzegovina and Macedonia (5), and in Italy, Macedonia, Ukraine, Argentina and China (16). The results were similar to those measured in Serbia (25), whereas the results extremely low than maximum level in Argentina (10). Naringenin is also a typical chemical constituent of poplar-type propolis (24). The levels of naringenin were higher when compared with the results found in Finland (20), and similar to those determined in Serbia (25). However, the quercetin levels were lower than the reported maximum concentration in Argentina (10), were higher than the levels found in Italy, Macedonia, Ukraine, Argentina and China (16). The quercetin levels were similar to the levels observed in Serbia (25). Although kaempferol was widely detected, its mean levels were generally lower than those of other phenolic compounds in the present study. The mean levels of
kaempferol were lower than those determined in Serbia (25) and Argentina (10), and were slightly higher found in Croatia (5). The mean levels of luteolin were higher than those reported in Turkey (12), and lower than the level determined in Serbia (25). In this study, rutin exhibited the lowest detected levels (Table 3 and 4).
For phenolic acids and esters, although caffeic acid levels were higher than reported levels in Turkey (12) and Argentina (10), the levels were slightly lower than the levels measured in Serbia (25). The mean CAPE levels were higher than the levels found in Italy, Macedonia, Ukraine, Argentina and China (16) and Finland (20), but were lower than levels measured in Serbia (25). On the other hand the ferulic acid levels were higher than levels reported in Finland (20), Croatia, Bosnia and Herzegovina (5), and slightly lower than levels measured in Serbia (25), and lower than the maximum level found in Argentina (10). The levels of cinnamic acid were higher than the levels reported in Finland (20) and Argentina (10). Raina et al. (19) reported that gallic acid could be a useful agent for prostate cancer prevention and intervention. The mean levels of gallic acid were generally lower than the other compounds in this study, but were higher than levels reported in Turkey (12), and lower than determined levels in Argentina (10). The levels of p-coumaric acid were higher than those reported in Turkey (12) and in Croatia, Bosnia and Herzegovina (5), but were lower than determined levels in Serbia (25) and the maximum level measured in Argentina (10).
As a conclusion, 14 target phenolic compounds were determined to be widespread in this study from Bursa's propolis for all seasons and altitudes. Target phenolic compounds levels determined in Bursa propolis were generally higher than those reported in previous studies. In the present study, although altitude was a significant variable in the concentrations of certain phenolic compounds, particularly galangin, naringenin and p-coumaric acid, the mean CAPE level in autumn was significantly higher than levels detected in summer. Reliable criteria for chemical standardization of different propolis types are needed but there still isn’t available a certified system of quality control of propolis and products. Propolis can be characterized by the following parameters: total flavone and flavonol content, total flavanone and dihydroflavonol content, and total phenolics content. These parameters correlate better with the biological activity (2, 22). In addition, the quantification of individual components such as galangin, naringenin, pinocembrin, caffeic acid, caffeic acid phenylethyl ester, quercetin, kaempferol, luteolin, rutin, gallic acid, p-coumaric acid, ferulic acid and cinnamic acid which had biological effects may be supplied additional data. As a result, these findings showed that qualitative and quantitative analysis of propolis for useful phenolic compounds may provide partial standardization of propolis.
T ab le 5 . P he no lic c om po un ds and th eir le ve ls/ra ng es in p ro po lis i n th e p re se nt st ud y and in th e lit era tu re s (µg /g D P EE ). T ab lo 5 . B u ve d iğ er ça lı şm al ard a an ali zi ya pıl an f en oli k bil eşik ler v e dü ze yleri (µg /g DP EE ). P h en o li cs ** n Bu rsa T u rk e y T u rk e y Italy M ac ed o n ia S erb ia Cro ati a Bo sn ia an d He rz e g o v in a Uk ra in e F in lan d A rg en ti n a Ch in a GL 45 *3 1 5 8 -5 5 5 0 - 7 0 ( 1 6 ) 9 0 3 (1 6 ) 3 5 7 7 ( 5 ) 1 2 6 9 7 -3 5 5 8 6 ( 2 5 ) nd -4 7 4 8 7 (5 ) nd (5 ) 9 5 2 (1 6 ) - 2 2 5 3 ( 1 6 ) 100 -1 4 0 0 (1 0 ) 1 4 0 0 (1 6 ) PN 45 4 6 0 1 -5 7 4 6 - 7 6 9 (1 6 ) 2 1 1 2 ( 2 6 ) nd (5 ) 2 4 6 9 -4 6 5 8 ( 2 5 ) nd -7 6 6 5 (5 ) 702 -1 4 4 6 (5 ) 1 1 9 6 ( 1 6 ) 0 -1 ( 2 0 ) 3 3 6 2 ( 1 6 ) 1 0 0 -1 0 2 3 0 0 ( 1 0 ) - AP 45 2 3 2 6 -3 4 9 9 - 1 3 2 (1 6 ) 2 3 6 (1 6 ) 1 (5 ) 2 4 6 9 -4 6 5 8 ( 2 5 ) nd -1 8 ( 5 ) nd -8 (5 ) 1 7 7 (1 6 ) 0 -1 ( 2 0 ) 3 3 6 (1 6 ) 300 -2 7 3 0 0 ( 1 0 ) 1 7 8 (1 6 ) NR 45 905 -1 2 8 8 - - - 928 -1 6 6 8 (2 5 ) - - - 0 -2 ( 2 0 ) - - QRC 45 2 7 4 6 -3 1 1 2 - 1 5 3 (1 6 ) 1 1 8 (1 6 ) 1 6 9 6 -3 4 5 7 ( 2 5 ) - - 2 8 ( 1 6 ) - n d ( 1 6 ) 8 0 0 -8 6 8 0 0 (1 0 ) 7 0 ( 1 6 ) KF 45 323 -4 6 6 - - nd (5 ) 2 4 4 5 -4 6 3 6 ( 2 5 ) nd -2 9 3 (5 ) nd (5 ) - - 100 -2 0 3 0 0 ( 1 0 ) - LT 45 385 -5 7 6 31 -79 (1 2 ) - - 667 - 9 2 2 (2 5 ) - - - - - - RT 45 18 -41 32 -5 5 0 (1 ) - - - - - - - - - CA 45 4 0 9 7 -5 2 8 1 284 -5 4 6 ( 1 2 ) 1 4 4 6 -4 6 5 8 (1 ) - - 3 3 7 2 -8 9 3 1 ( 2 5 ) - - - - 100 -2 7 0 0 (1 0 ) - CA P E 45 2 6 2 3 -3 6 8 7 - 1 7 4 5 ( 1 6 ) 1 2 6 3 ( 2 6 ) 6 0 5 3 -8 2 0 9 ( 2 5 ) - - 1 1 4 5 ( 1 6 ) 10 -3 0 ( 2 0 ) 1 1 1 1 ( 1 6 ) 2 5 2 5 (1 6 ) t-FR 45 1 8 2 8 -2 7 2 3 - - nd (5 ) 2 2 0 9 -7 5 8 4 ( 2 5 ) nd -9 5 9 (5 ) 216 -3 0 1 ( 5 ) - 4 -1 0 (2 0 ) 100 -1 3 0 0 0 ( 1 0 ) - t-CA 45 1 7 2 3 -2 7 3 2 - - - - - - - 0 -1 ( 2 0 ) 100 -8 0 0 ( 1 0 ) - GA 45 97 -2 0 7 13 -35 (1 2 ) 8 -7 0 (1 ) - - - - - - - 1 6 0 0 -4 8 0 0 ( 1 0 ) - p -COU 45 1 0 3 6 -2 0 9 1 17 -88 (1 2 ) 381 -4 5 7 9 (1 ) - nd (5 ) 3 5 1 5 -4 6 4 9 ( 2 5 ) nd -1 5 6 (5 ) 19 -28 (5 ) - - 100 -1 2 3 0 0 ( 1 0 ) - “G L” : G ala ng in , “P N ”: P in oc em brin , “A P ”: A pig en in , “N R” : N arin ge nin , “Q RC ”: Q ue rc etin , “K F”: K ae m pf ero l, “ LT ”: L ute olin , “RT ”: Ru tin , “CA ”: Ca fe ic a ci d, “CA P E” : Ca fe ic a cid ph en yleth yl este r, “ F R” : tra n F eru li c ac id , “ t-CA ”: tra n s-Cin n a m ic ac id , “ GA ”: Ga ll ic ac id , “p -COU ”: p -Co u m aric ac id ,, “n d” : n o t d etec tab le. *M in im u m a n d m ax im u m m e an re su lt s o f p re se n t stu d y . **Nu m b er o f p re se n t stu d y sa m p les . T h e re su lt s w er e g iv en a s w h o le n u m b er, a n d e x p re ss ed a s µg /g p ro po li s. L it era tu r (1 2 ) an d ( 2 5 ), a n d p re se n t st u d y re su lt s w ere e x p re ss ed in DP EE a n d o th ers w ere e x p re ss ed in ra w p ro p o li s.
Acknowledgements
The project was supported by The Commission of Scientific Research Project of Uludag University (UAP-(V) 2012-12 and partially by TÜBİTAK (Project No: 112O017).
References
1. Aliyazıcıoglu R, Sahin S, Erturk O, et al. (2013): Properties of phenolic composition and biological activity of propolis from Turkey. Int J Food Prop, 16, 277-287. 2. Bankova V (2005): Chemical diversity of propolis and the
problem of standardization. J Ethnopharmacol, 100, 114-117. 3. Bankova VS, De Castro SL, Marcucci MC (2000): Propolis: Recent advances in chemistry and plant origin. Apidologie, 31, 3-15.
4. Banskota AH, Tezuka Y, Kadota S (2001): Recent progress in pharmacological research of propolis. Phytother Res, 15, 561-571.
5. Barbarić M, Mišković K, Bojić M, et al. (2011): Chemical composition of the ethanolic propolis extracts and its effect on HeLa cells. J Ethnopharmacol, 135, 772-778.
6. Barros MP, Lemos M, Maistro EL, et al. (2008): Evaluation of antiulcer activity of the main phenolic acids found in Brazilian green propolis. J Ethnopharmacol, 120, 372-377.
7. Cam Y, Koç AN, Silici S, et al. (2009): Treatment of dermatophytosis in young cattle with propolis and Whitfield’s ointment. Veterinary Record, 165, 57-58. 8. Cardoso RL, Maboni F, Machado G, et al. (2010):
Antimicrobial activity of propolis extract against Staphylococcus coagulase positive and Malassezia pachydermatis of canine otitis. Vet Microbiol, 142, 432-434. 9. Castro ML, Cury JA, Rosalen PL, et al. (2007): Propolis from southeastern and northeastern of Brazil: The influence of seasonality in antibacterial activity and phenolic composition. Quim Nova, 30, 1512-1516.
10. Chaillou LL, Nazareno AM (2009): Chemical variability in propolis from Santiago del Estero, Argentina, related to the arboreal environment as the sources of resins. J Sci Food Agric, 89, 978-983.
11. Cruz Sánchez TA, García PAE, Zamora CIL, et al. (2014): Use of propolis for topical treatment of dermatophytosis in dog. OJVM, 4, 239-245.
12. Erdogan S, Ates B, Durmaz G, et al. (2011): Pressurized liquid extraction of phenolic compounds from Anatolia propolis and their radical scavenging capacities. Food Chem Toxicol, 49, 1592-1597.
13. Isla MI, Zampini IC, Ordóñez RM, et al. (2009): Effect of seasonal variations and collection form on antioxidant activity of propolis from San Juan, Argentina. J Med Food, 12, 1334-1342.
14. Liu R, Gao M, Yang ZH, et al. (2008): Pinocembrin protects rat brain against oxidation and apoptosis induced by ischemia-reperfusion both in vivo and in vitro. Brain Res, 24, 104-115.
15. Lozina LA, Peichoto ME, Boehringer SI, et al. (2010): Efficacy of Argentine propolis formulation for topical treatment of canine otitis extern. Arq Bras Med Vet Zootec, 62, 1359-1366.
16. Medana C, Carbone F, Aigotti R, et al. (2008): Selective analysis of phenolic compounds in propolis by HPLC-MS/MS. Phytochem Anal, 19, 32-39.
17. Pellati F, Orlandini G, Pinetti D, et al. (2011): HPLC-DAD and HPLC-ESI-MS/MS methods for metabolite profiling of propolis extracts. J Pharm Biomed Anal, 55, 934-48.
18. Popova MP, Bankova VS, Bogdanov S, et al. (2007): Chemical characteristics of poplar type propolis of different geographic origin. Apidologie, 38, 306-311.
19. Raina K, Rajamanickam S, Deep G, et al. (2008): Chemo preventive effects of oral gallic acid feeding on tumor growth and progression in TRAMP mice. Mol Cancer Ther,
7, 1258-1267.
20. Salonen A, Saarnio S, Julkunen-Tiitto R (2012): Phenolic compounds of propolis from the boreal coniferous zone. J Apic Sci, 56, 13-22.
21. Sforcin JM, Fernandes JA, Lopes CA, et al. (2000): Seasonal effect on Brazilian propolis antibacterial activity. J Ethnopharmacol, 73, 243-249.
22. Stan L, Mărghitaş LA, Dezmirean D (2011): Quality criteria for propolis standardization. J Anim Sci Biotechnol, 44, 137-140.
23. Trusheva B, Trunkova D, Bankova V (2007): Different extraction methods of biologically active components from propolis: A preliminary study. Chem Cen J, 7, 1-13. 24. Velazquez C, Navarro M, Acosta A, et al. (2007):
Antibacterial and free-radical scavenging activities of Sonoran propolis. J Appl Microbiol, 103, 1747-1756. 25. Žižić JB, Vuković NL, Jadranin MB, et al. (2013):
Chemical composition, cytotoxic and antioxidative activities of ethanolic extracts of propolis on HCT-116 cell line. J Sci Food Agric, 93, 3001-3009.
Geliş tarihi: 27.07.2015/ Kabul tarihi: 07.04.2016 Address for correspondence:
Prof. Dr. Hasan Hüseyin Oruç
Uludag University, Faculty of Veterinary Medicine, Department of Pharmacology and Toxicology, 16059 Nilüfer, Bursa, Turkey.