Partly presented in 42nd National Physiology Congress, 05-08 September 2016, Düzce, Turkey, with the title “The Role of Finger Tapping Task in the Assessment of Central
Fatigue” and the abstract published in Acta Physiologica, 2016;218(Suppl. 709):76-76.
Accepted as oral presentation for 17th IEEE International Conference on BioInformatics and BioEngineering (BIBE 2017), 23-25 October 2017, Washington DC, USA with the
title is “Central Origin of Muscle Fatigue Distinguished Solely in Finger Tapping Performance?”
Address for Correspondence / Yazışma Adresi: Leyla Aydın, MD, PhD, Eskişehir yolu 20.km, Baglica Kampusu, 06810 Baglica, Ankara, Turkey E-mail: [email protected] ©Telif Hakkı 2018 Gazi Üniversitesi Tıp Fakültesi - Makale metnine http://medicaljournal.gazi.edu.tr/ web adresinden ulaşılabilir.
©Copyright 2018 by Gazi University Medical Faculty - Available on-line at web site http://medicaljournal.gazi.edu.tr/ doi:http://dx.doi.org/10.12996/gmj.2018.11
The Impacts of Central Fatigue on the Polyphasic Nature of Tapping Performance
Santral Yorgunluğun Parmak Vuru Performansının Polifazik Doğası Üzerine Etkisi
Leyla Aydın
1, Erhan Kızıltan
1, Ersin Öğüş
2, Bahadır Azizağaoğlu
3, Arda Büyükkaraman
3, Selen Doğan
3, Gizem Ertürk
3Cansel Kuş
31 Baskent University Faculty of Medicine, Department of Physiology, Ankara, Turkey 2 Baskent University Faculty of Medicine, Department of Biostatistics, Ankara, Turkey 3 Baskent University Faculty of Medicine, Undergraduate Student, Ankara, Turkey
ABSTRACT
Objective: As a non-specific symptom muscle fatigue mostly accompanies neuromuscular diseases and also occurs frequently in healthy individuals. Fatigue phenomenon is considered to be multidimensional symptom. There have been still discussions on the origin whether it depends primarily on the intrinsic properties of muscle itself (peripheral mechanisms) or the nervous system that controls muscle (central mechanisms). This study aimed to investigate the effects of central fatigue on the performance of maximal voluntary repetitive movement and discusses the specificity of finger tapping task test as a simple diagnostic tool for fatigue.
Methods: For this purpose, 27 healthy, male, right-handed volunteer performed the 20-s of finger tapping task test for four times. The one was for control and the other three were performed right after induction of three different central fatigue models. Temporal behavior of tapping performances were evaluated based on inter-tap intervals and the statistical comparison were made by regression analysis.
Results: The results showed that the partial evaluation of the task in time domain instead of complete test period yielded with statistically significant differences between control and fatigue models (p<0.001) and even in between the fatigue models.
Conclusion: Approximately the first 5-s of a finger tapping task consists of both motor learning processes and dynamics of energy consumption from anaerobic sources. However, it reflects dominantly the central components of fatigue. We may conclude that the temporal behavior of tapping performance following the induction of specific fatigue model may help making further discrimination for the origin of fatigue.
Key Words: Central fatigue, peripheral fatigue, fatigue model, repetitive movements, tapping performance, temporal behavior
Received: 10.06.2017 Accepted: 10.23.2017
ÖZET
Amaç: Non spesifik bir semptom olarak nöromüsküler hastalıklarla birlikte seyreden kas yorgunluğu, sıklıkla sağlıklı insanlarda da görülebilmektedir. Kas yorgunluğunun kaynağının primer olarak kasın kendisinden mi (periferal mekanizmalar) yoksa kası kontrol eden sinir sisteminden mi (santral mekanizmalar) olduğu hala tartışmalı bir konudur. Bu çalışmada santral yorgunluğun maksimal istemli tekrarlayan hareketler üzerindeki etkisinin araştırılması hedeflenmiş ve yorgunluk değerlendirilmesinde, basit bir yöntem olan parmak vuru görevinin özgünlüğü tartışılmıştır.
Yöntem: Bu amaçla, sağlıklı, sağ el tercihli, 27 erkek gönüllüye 20 sn süreyle, 1 kez kontrol ve 3 farklı santral yorgunluk modelini takiben de birer kez parmak vuru görevi yaptırılmıştır. Parmak vuru performansının temporal davranışı vurular arası süre değişimleri baz alınarak değerlendirilmiştir. Veriler regresyon analizi ile karşılaştırılmıştır.
Bulgular: Çalışma, parmak vuru performansın tamamının değil de, görevin zaman tabanında parçalara bölünerek değerlendirilmeleri durumunda, kontrol ve yorgunluk modelleri sonrasında ve hatta yorgunluk modelleri arasında da istatistiksel olarak anlamlı farklılıklar olduğunu ortaya koymuştur.
Sonuç: Parmak vuru görevinin yaklaşık olarak ilk 5 saniyelik bölümü motor öğrenme süreçleri ve anaerobik enerji tüketim dinamiklerini içermektedir. Ancak, yorgunluğun santral bileşenini daha baskın olarak yansıtmaktadır. Sonuç olarak spesifik yorgunluk modellerini takiben yapılan parmak vuru performansının temporal davranışı, yorgunluğun kaynağı ile ilgili daha detaylı bilgilere ulaşabilmemize yardımcı olabilir.
Anahtar Sözcükler: Santral yorgunluk, periferal yorgunluk, yorgunluk modeli, tekrarlayan hareketler, parmak vuru performansı, temporal davranış
Geliş Tarihi: 06.10.2017 Kabul Tarihi: 23.10.2017
INTRODUCTION
Muscle fatigue is a non-specific symptom and mostly accompanies neuromuscular diseases such as Parkinson (1), multiple sclerosis (2), muscular dystrophy (3) and cancer (4). It also occurs frequently in healthy individuals. Fatigue phenomenon which has been of interest by the researchers in different fields of science, is now considered to be both multidimensional symptom and syndrome (5). Therefore, we have inherently various definitions for fatigue depending on the researcher’s point of view (6). Although some degree of overlap is unavoidable, the studies point out to view the fatigue phenomenon from different perspectives such as peripheral versus central, cognitive versus motor, physiological versus psychological, subjective versus objective (5). This diversity, in fact, reflects the complexity of underlying mechanisms of fatigue. This study deals only with the concept of peripheral versus central fatigue.
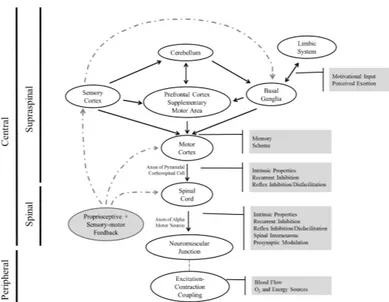
The anatomical structures and mechanisms known to play role in fatigue phenomenon were put together schematically in Figure 1.
There have been several multidisciplinary studies in the literature investigating the central and peripheral aspects of fatigue phenomenon. These studies, in general, make use of wide range of technological systems (12-14) and fatiguing models (1). In principle, relatively simple and lower technology yet with higher specificity and accuracy methods always attract scientists and have always ranked in priority at least in routine use.
Our earlier studies (15, 16) employing a lower technology method of finger-tapping (FT) task test suggest that the performance of maximal voluntary repetitive movements (MVRM) has polyphasic nature and the temporal analysis may reflect the dynamics and/or energetic states of the muscle involved in the movement (Figure 2). It may be hypothesized that under induced fatigue condition the MVRM may also mimic the dynamics of fatigue and therefore, may be used in evaluating the origin of fatigue phenomenon. This study aimed to investigate the effects of central fatigue on FT performance and the specificity of FT task test to the fatigue states.
Figure 1. Schematic presentation of neuromuscular structures and mechanisms which are known to be responsible for fatigue phenomenon. Schema groups the anatomical structures in a hierarchical order such as central vs peripheral, and also points out the interactions between them (adopted after the studies of 6-11).
Figure 2. Boundary lines and the given names for the subdivisions of a typical MVRM in time domain (middle). Graphic on top of the figure represents a typical tapping performance as ITI changes. The lower graphic represents changes in energy and/or power output. Arbitrary units were used in both graphics. The given names relate the dynamics and/or energetic state of the system. “A1.0” bounds rapid adaptation phase. “FA4.0” is the time at which phosphogen system fails. PC6.0 is the time at which anaerobic glycolytic systems’ output reaches its maximum. “HGx.x” represents the onset time (x.x) of “Ha gayret phenomenon (adopted after the studies of 13, 15-19).
METHODS
This study was approved by the Baskent University Institutional Review Board and Ethics Committee (Project no. KA16/26) and supported by the Baskent University Research Fund. Each participant performed FT task tests before and after applying the three different central fatiguing models previously defined in the literature (11, 12, 20).
Participants
Seventy healthy, male, right-handed volunteers attended to the study; all were students of Baskent University. Before each test session the exclusion criteria which include smoking or alcohol consumption, less than 5 hours of sleep the night before the test, consuming more than one cup of coffee and/or two cups of tea and exercising within 30 min before the test (16), were applied. A total of 27 volunteers completed the study. The participants’ demographic characteristics are presented in Table 1. The participants showed a homogenous distribution.
Table 1. Demographic Characteristics of the Participants (n=27)
Subject Properties Mean Std. Dev. Min. Max.
Age (years) 20 1.4 18 23
Height (m) 1.8 0.07 1.6 1.9
Body Weight (kg) 77.9 11.86 55 100
Body Mass Index 24.2 3.22 16.7 30.9
Determination of Dominant Hand
The Oldfield Inventory validated Turkish version was used to determine the dominant hand. The scale includes questions concerning the hand preferred for writing, drawing pictures, throwing a stone or ball, using scissors, using a toothbrush, using a knife without a fork, using a fork, striking a match, and opening the lid of a bottle. The results were evaluated according to the Geschwind score (16, 21).
Test Protocols
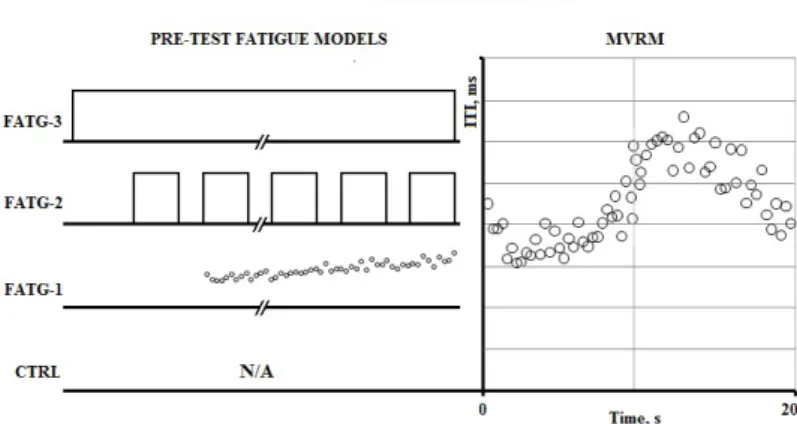
Each participant performed 4 FT task tests of 20-s, each on at least two days apart in order to avoid the learning effect (22). The test protocols were given in Figure 3, schematically. On the first test day, the control FT task test data (CTRL) without applying any fatiguing model were collected and the Maximal Voluntary Contraction (MVC) force was defined for each participant. On the other test days the FT task test data were collected right after one of central fatigue model induced. FATG-1 represents the FT task test after inducing central fatigue model of Short Duration Maximal Voluntary Repeated Movement (sMVRM). Similarly, FATG-2 and FATG-3 represent the tests after inducing central fatigue models of Intermittent Maximal Voluntary Contraction (iMVC) and Continues Maximal Voluntary Contraction (cMVC), respectively. The FT task tests started with a delay of less than a 3-s of mouse clicking time after fatigue model induced.
Figure 3. Test protocols: Induced fatigue was developed just before MVRM (FT test) using different models. Three different fatiguing models (FATG-1, FATG-2, FATG-3), defined in the literature, were used. No fatiguing model was not applied (N/A) to control group (CTRL).
Central Fatigue Models
Three different fatigue models were used in this study. All the models are known to induce central fatigue that originates primarily from the nervous system and are described below in short;
FATG-1 (sMVRM, Short Duration Maximal Voluntary Repeated Movement): The participants were asked to tap their right index finger with a maximal rate for 10-s (12).
FATG-2 (iMVC, Intermittent Maximal Voluntary Contraction): The participants were asked to generate and sustain previously defined Maximal Voluntary Contraction (MVC) force with their right index finger for 15-s and then rest for 5-s, intermittently for 4-min (adopted from 11).
FATG-3 (cMVC, Continuous Maximal Voluntary Contraction): The participants were asked to generate and sustain previously defined MVC force with their right index finger, continuously for 3-min (adopted from 20).
Defining Individual Maximal Voluntary Contraction Force
The participants were asked to press on a force-sensing resistor (Interlink Electronics, Inc., CA, USA) by their index finger to produce maximal isometric force. The MVC force for each participant was defined as the mean of three trials (23) and the participants were asked to sustain this force during the induction of the fatigue model.
Maximal Voluntary Repetitive Movement Test
MVRM for index finger was conducted using the digital FT task test system (15, 16, 24). The system records Inter Tap Intervals (ITI), which is the time difference between consecutive taps, in ms resolution by making use of the time-stamp counter of microprocessor and saves data array on the hard drive of a computer for later analysis. The participants were asked to tap a predetermined key on the keyboard repeatedly at the maximum rate possible for 20-s.
Further detail may be found in our earlier article (16). All of the tests were performed between 8:00 and 9:00 a.m., and the total duration of each test took less than 10 min of the participant. Each participant was seated comfortably in a chair 50 cm from the computer screen, and had a wrist support (16). The participants were asked to tap a predetermined key on the keyboard repeatedly at the maximum rate possible for 20 s.
Analysis of Data
The data saved for further analysis include ITI values measured at evenly spaced discrete points for each participant. As these points intrinsically consist of time, the results can be presented and discussed in a time domain rather than in a tapping order. The Microsoft Office Excel 2007 (Microsoft Corporation, Seattle, WA) and SPSS (Statistical Packages for Windows version 17.0, Chicago, IL, USA – September 2012 license number: 1093910, Baskent University) statistical software packages were used in the analysis of FT performance. A polynomial function, to be used in the behavioral equation (approximating function), either linear or higher order polynomial model, was applied to the complete or predefined time periods of the experimental data. Statistical comparison between the control and the fatigue models were made by regression analysis.
In order to define the distinct time periods we calculated the square of the difference between the linear approximating function and the experimental data at discrete data points and plotted the sum of squared differences on a logarithmic scale (25). The significant change in the slope of this curve was used to indicate a possible boundary that may denote the distinct time period of different behavioral kinetics of FT movement (Figure 4). One-way repeated measures ANOVA was used to compare ITI levels of the dependent control and fatigue groups. In addition, Bonferroni correction was used to adjust multiple comparisons. However, Friedman test was used to compare groups in periods due to the violation of parametric test assumptions.
Figure 4. The change in average ITI values (circle) of CTRL group with respect to elapsed time (n=27). Red line represents the linear regression equation of ITI change. Black line is the logarithmic presentation of sum of squared difference between the CTRL and regression line. Arrows divide movement into three time periods.
RESULTS
The mean tapping rate differences between CTRL and induced fatigue groups (FATG-1, FATG-2 and FATG-3) were evaluated for the complete test periods of 20-s. The tapping rates were presented as the originally recorded data of ITI in ms, throughout this study. Therefore, for the reader’s convenience, it is important to emphasize on the reciprocal relation between tapping rate and ITI. As the ITI decreases the tapping rate increases. The results showed that the mean ITI difference in at least two dependent groups was statistically significant (p=0.02). These groups were identified as CTRL and FATG-1 (p=0.0016).
On the other hand, the application of linear regression difference method that divides data into parts in time domain (PERIODS) provides an opportunity of detailed analysis, statistical (Figure 4). Therefore, CTRL data was divided into three distinct time periods, explicitly by the method described in our previous study (16). As the method directs the logarithmic presentation (black line) of the sum of squared difference between the average ITI value of CTRL group (circle) and the calculated value at the corresponding time point of the linear regression equation (red line) was given in Figure 4. As it was in the previous study, the slope of this curve exhibited different characters at least in three periods with the boundaries marked on the graph with arrows “1” and “2” at 3.5-s and 14-s, respectively.
GMJ
2018; 29: 48-52
Aydin et al.
Central fatigue
The periods were named as “PERIOD-1”, “PERIOD-2” and “PERIOD-3”, respectively, for the reader’s convenience. The mean ITI differences between CTRL and induced fatigue groups were re-evaluated based on the periods defined.
The relatively increasing performance trend at the end of the task, (PERIOD-3 in Figure 4), coincided with deep fluctuations and may reflect mechanisms contributing to MVRM other than energy supply and motor skill differences (16, 26). Therefore, evaluation of PERIOD-3 was left outside the scope of current study.
The results showed that the difference in ITI distributions is not statistically significant in PERIOD-1 (p=0.328). While the results showed no mean ITI difference between PERIOD-1 of any groups, statistically significant difference (p=0,006) occurred again between CTRL and FATG-1 (p=0,006) but in PERIOD-2 in this case.
Linear regression analysis performed on PERIOD-1 and PERIOD-2 further characterized the behavior of the movement. Graphical presentation of the results for PERIOD-1 and PERIOD-2 were given in Figure 5 and Figure 6, respectively.
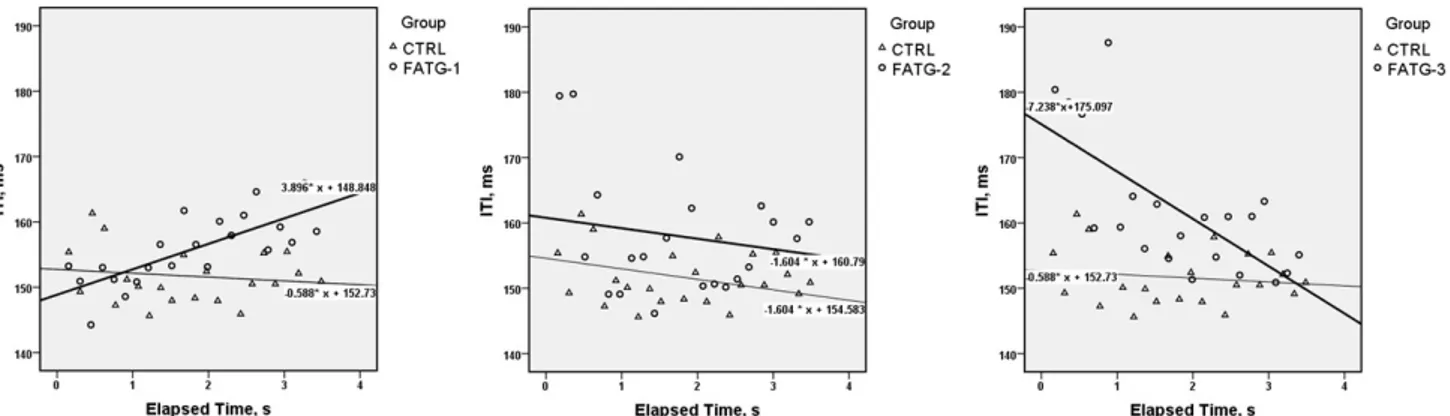
Figure 5. Linear regression lines of FATG-1 (left), FATG-2 (middle) and FATG-3 (right) in comparison with CTRL in PERIOD-1. Regression line equations were given next to each line. CTRL (Triangle), fatigue group (circle), regression line for control (thin line), regression line for fatigue group (thick line). (n=27)
Figure 6. Linear regression lines of FATG-1 (left), FATG-2 (middle) and FATG-3 (right) in comparison with CTRL in PERIOD-2. Regression line equations were given next to each line. CTRL (Triangle), fatigue group (circle), regression line for control (thin line), regression line for fatigue group (thick line). (n=27)
As presented in Figure 5, tapping performance in FATG-1 group had an increasing trend (+3.896) compared to CTRL which showed a slight decrease (-0.588) in the initial phase (PERIOD-1) of the task (p<0.001). Again in the initial phase of the task, FATG-2 group had parallel regression line with CTRL and a higher intercepting point on ITI axis (ITIFATG-2=160.790 ms). The interception points
difference between CTRL (ITICTRL=154.583) and FATG-2 was statistically significant
(p<0.05). FATG-3 group on the other hand had statistically significant (p<0.05) decreasing trend (-7.238) and the task started with a very high intercepting point on ITI axis (ITIFATG-3=175.097 ms) which corresponds to an highly low initial tapping
rate.
Tapping performances of all groups in PERIOD-2 had almost the same and positive trends (Figure 6). FATG-1, FATG-2, FATG-3 groups showed higher intersection points on ITI axis compared to CTRL. ITI differences between fatigue groups and CTRL were calculated as 11.037 ms, 2.556 ms, 4.709 ms, respectively, and they were all statistically significant (p<0.001, p<0.05, p<0.001).
DISCUSSION
In addition to various disorders such as Parkinson’s disease, ataxia, Alzheimer’s disease and acute stroke the FT test is also used in healthy individuals to analyze the motor functions of upper extremities (16). This study investigated the impacts of central fatigue on MVRM in order to find out the specificity of FT task test on the central origin of fatigue.
The results, when fatigue induced tasks were compared with CTRL by means of mean ITI over the complete test period, suggested that FATG-2 and FATG-3 models were not sufficient enough to induce fatigue situation. It was suggested in the lierature that MVRM exhibited a polyphasic behavior in time domain, and had three distinct time periods which may be directly related to muscle dynamics and energy consumption. Therefore, it is likely to have further behavioral differences between groups if partial comparison is made instead of complete test period (Figure3). The borders at which CTRL group was divided into three time periods were consistent with the literature (16).
An unexpected performance increase in the last period (PERIOD-3) of MVRM is consistent with the earlier studies (15-17) where it was named as “Late adaptation pahase”, “Super effort period” and “Ha gayret phenomenon” in (Figure 2). The latter stands for “win or die” circumstances and emphasizes on the impact of internal motivation that may smartly modulates the performance in unexpected situations (Limbic System in Figure 1). The PERIOD-3, which was outside the scope of current study, is possibly controlled by some other mechanisms and its evaluation may provide new insights into MVRM. Therefore, the discussion in this study was focused on the first two periods of the movement.
Initiation of the Task
Following the induction of fatigue models, initial tapping rates of the tasks differed from CTRL in a ranking order. The fastest movement initiation, even slightly faster than CTRL, was occurred in FATG-1, then FATG-2 and the slowest initiation was in FATG-3
This order possibly reflects the dynamics of fatigue models. The mechanisms underlying this ranking order may be (i) schema theory, (ii) energetic system and (iii) recovery period.
(i) Schema theory (27) suggests that rapid, discrete movements were controlled by a two-state memory process. The first one is the “generalized motor program” and is responsible for ordering the sequence. The other memory process, “recall schema”, provides the details for instantiating a particular instance of the motor program. Since the fatiguing movement of 10-s of MVRM in FATG-1 group (13) was identical to the FT task, the generalized motor program for the task was already in the memory. Therefore, FATG-1 group had a fast initial tapping rate since the motor program was ready and the only time spent for initiating the task was recalling time from memory. Isometric MVCs were cyclic and continuous in FATG-2 and FATG-3 groups, respectively. Therefore, advanced preparation and/or storage of the program in to the memory, namely motor learning, was either incomplete or lost in these groups yielding slower initial tapping rates, respectively.
(ii) Energetic system, which is known to be the peripheral component of a movement, describes the metabolic changes as responsible for a decreased muscle response to the repetitive neural stimulation. (iii) The last mechanism responsible for ranking order, the tapping rate, is the time interruptions in the fatiguing movement (seen in FATG1 and FATG-2) during which the necessary energy for the next movement is recovered.
PERIOD-1
This period of MVRM was defined as “early adaptation phase” (15), “early stage of learning” or “cognitive stage” (18) in the literature (Figure 2). As the names imply this period consists of environmental adaptation, development of schema with practice and integration of sensory information. Additionally, the impacts of the peripheral aspects of a movement such as consumption of stored energy occur also in this period (16). Tapping performance increase in FATG-2 and FATG-3 groups are consistent with the literature and the difference between the slopes of corresponding regression lines suggests that optimal schema is reached within 5-s of the task independent of the level of induced fatigue (Figure 5). Since the recall schema was in immediate action right after FATG-1, the task started with the highest performance, and then decreased over the time. Therefore, while having maximal central effect on the initial performance, the gradual decrease in the performance by the time may be attributed to the development of peripheral fatigue.
PERIOD-2
Tapping performances in this period showed similar behavior in all groups indicating that all induced fatigue models were under the same mechanism of slowing effect as in CTRL (Figure 6). While the slopes of the regression lines were almost the same the intersection points on ITI axis of fatigue groups were significantly higher than CTRL. This result suggests that the central fatigue models will also end up with a peripheral fatigue affecting PERIOD-2, dominantly. This is consistent with the literatures matching this period (early fatigue phase) with aerobic oxidative system as the effective source of energy supply (15, 16). As a conclusion, FT task test is a simple and important tool and may lead us gain an insight into the function of the movement circuit. Although there are several limitations of this study including the small number of participants and matching/confirming data further with different fatiguing models, by incorporating our earlier experiences we may conclude the following points;
1. Polyphasic behavioral pattern of maximal repetitive movements is composed of central and peripheral components of the movement and the time based analysis of FT task test data may lead us to identify the origin of a fatigue state.
2. When evaluation is made based on mean ITI, the only fatiguing model used in FATG-1 group is determinative in identifying the existence of fatigue state. 3. Partial evaluation of temporal behavior of tapping performance may help
making further discrimination for the origin of fatigue.
4. Approximately the first 5-s of FT task (PERIOD-1) consists of motor learning processes and the dynamics of energy consumption from anaerobic sources therefore, reflects the central components of fatigue, dominantly,
5. Central fatigue models (FATG-1, FATG-2, FATG-3) used in this study also induce peripheral fatigue and its findings are conspicuous in approximately 5 to 14-s of FT task (PERIOD-2).
Acknowledgements: We thank for all of Baskent University Medical Faculty students who participated in this study.
Conflict of interest
REFERENCES
1. Wurster C.D, Graf H, Ackermann H, Groth K, Kassubek J, Riecker A.Neural correlates of rate-dependent finger-tapping in Parkinson’s disease. Brain Struct Funct. 2015; 220: 1637–48.
2. Morgante F, Dattola V, Crupi D, Russo M, Rizzo V, Ghilardi M.F, Terranova C, Girlanda P. Quartarone A. Is central fatigue in multiple sclerosis a disorder of movement preparation? J Neurol. 2011; 258: 263–72.
3. Angelini C and Tasca E. Fatigue in muscular dystrophies. Neuromuscular Disorders 2012;22: S214–20.
4. Berger A.M, Gerber L.H, Mayer D.K.Cancer-Related Fatigue. Cancer. 2012; 118(8 suppl): 2261-9.
5. Leavitt V.M, DeLuca J. Central fatigue: issues related to cognition, mood and behavior, and psychiatric diagnoses. PM R. 2010; 2: 332-7.
6. Gandevia S.C. Spinal and supraspinal factors in human muscle fatigue. Physiol Rev 2001; 81:1725–89.
7. Ghosh VE., Gilboa A. What is a memory schema? A historical perspective on current neuroscience literatüre. Neuropsychologia. 2014:53;104–14. 8. Ranieri F, Di Lazzaro V. The role of motor neuron drive in muscle fatigue.
Neuromuscular Disorders. Neuromuscul Disord. 2012; 22(Suppl 3): S157-61. 9. Chakravarthy VS, Joseph D, Bapi RS. What do the basal ganglia do? A
modeling perspective. Biol Cybern. 2010;103:237-53.
10. Chaudhuri A and Behan P.O. Fatigue and basal ganglia. Journal of the Neurological Sciences. 2000;179: 34–42.
11. Taylor J.L, Allen G.M, Butler J.E, Gandevia S.C. Supraspinal Fatigue During İntermittent Maximal Voluntary Contractions of The Human Elbow Flexors. J Appl Physiol. 2000; 89: 305–13.
12. Arias P, Robles-Garcia V, Corral-Bergantinos Y, Madrid A, Espinosa N, Valls-Sole J, Grieve K.L, Oliviero A, Cudeiro J. Central Fatigue Induced by Short-Lasting Finger Tapping and Isometric Tasks: A Study of Silent Periods Evoked at Spinal and Supraspinal Levels. Neuroscience. 2015; 305; 316–27. 13. Bishop D.J. Fatigue during intermittent−sprint exercise. Clin Exp Pharmacol
Physiol. 2012; 39: 836–41.
14. Berchicci M, Menotti F, Macaluso A, Di Russo F. The neurophysiology of central and peripheral fatigue during sub-maximal lower limb isometric contractions. Front Hum Neurosci. 2013; 7 (article 135): 1-10.
15. Barut, C, Kiziltan, E, Gelir, E, & Kokturk, F. Advanced analysis of finger-tapping performance: A preliminary study. Balkan Medical Journal, 2013; 30: 167–71. 16. Aydin L, Kiziltan E, Gundogan N.U. Polyphasic Temporal Behavior of Finger-Tapping Performance: A Measure of Motor Skills and Fatigue. Journal of Motor Behavior. 2016; 48: 72-8.
17. Kızıltan E, Aydın L. Internal motivation modulates voluntary repetitive movements: “Ha gayret” energy. Acta Physiologica, 2017; 221(S714):81-81. 18. Andrieux M, Boutin A, Thon B. Self-Control of Task Difficulty During Early
Practice Promotes Motor Skill Learning, Journal of Motor Behavior. 2016: 48: 1, 57-65.
19. Wells GD, Selvadurai H, Tein I. Bioenergetic provision of energy for muscular activity. Paediatric Respiratory Reviews. 2009; 10, 83–90.
20. Bilodeau M. Central Fatigue in Continuous and Intermittent Contractions of Triceps Brachii. Muscle Nerve. 2006; 34: 205–13.
21. Tan U. The distribution of hand preference in normal men and women. Int. J. Neurosci. 1988;41:35-55.
22. Hotermans C, Peigneux P, Maertens de Noordhout A, Moonen G, Maquet P. Early boost and slow consolidation in motor skill learning. Learn Mem. 2006; 13: 580-3.
23. Tan H, Pogosyan A, Ashkan K, Cheeran B, FitzGerald J.J, Green A, Aziz T, Foltynie T, Limousin P, Zrinzo L, Brown P. Subthalamic nucleus local field potential activity helps encode motor effort rather than force in parkinsonism. J Neurosci. 2015;35:5941-9.
24. Kiziltan E, Barut C, Gelir E. A high-precision, low cost system for evaluating finger-tapping tasks. Int J Neurosci 2006; 116: 1471-80.
25. Hornbeck, R. W. Least squares curve fitting and functional approximation. In R. W. Hornbeck (Ed.), Numerical methods 1975; (pp. 121–129). New York, NY: Quantum.
26. Loiselle D.S, Walmsley B. Cost Of Force Development As A Function Of Stimulus Rate In Rat Soleus Muscle. Am J Physiol. 1982; 243: C242-6. 27. Schmidt, R.A. A schema theory of discrete motor skill learning. Psychological
review. 1975; 82: 225-60.
No conflict of interest was declared by the authors.