doi:10.1006/jhec.2002.0313
Homeownership and FHA Mortgage Activity in
Neighborhoods and Metropolitan Areas
Zeynep O¨ nder1
Faculty of Business Administration, Bilkent University, Bilkent, Ankara 06533, Turkey E-mail: [email protected]
Received December 4, 2001
This paper examines the impact of Federal Housing Administration (FHA) mortgage insurance activity on homeownership at two levels: census tract and metropolitan area. The 1990 Home Mortgage Disclosure Act dataset combined with the 1980 and 1990 U.S. Censuses is used in the analysis. This study extends the previous studies of FHA activity by having broader coverage, a better measure of relative FHA activity and better control of other factors that affect homeownership and mortgage activity. The empirical results indicate that the FHA mortgage insurance program has significant positive effects on homeownership in predominantly white and/or moderate to high-income MSAs and pre-dominantly minority and/or moderate- to high-income census tracts. However, the esti-mated coefficients associated with the relative FHA activity are found to be relatively small in magnitude. Overall, results suggest that FHA programs are of limited effect in the achievement of homeownership, but may be of greater assistance to whites relative to blacks. 䉷 2002 Elsevier Science (USA)
Key Words: homeownership; FHA activity.
The Federal Housing Administration (FHA) was established after the Great Depression to improve housing standards and conditions, to provide an adequate home financing system through insurance of mortgages, and to stabilize the mortgage market. Its current mission includes contributing to the building and preservation of healthy neighborhoods and communities, maintaining and ex-panding homeownership opportunities, and stabilizing credit markets in times of economic disruption.2 In order to achieve these objectives, the FHA insures lenders that extend credit to the borrowers who do not have sufficient
down-1I thank Robert B. Avery, Kerry D. Vandell, Nuray Gu¨ner, an anonymous referee, and Henry O.
Pollakowski, the Editor, for their comments and suggestions. This research is based on part of my dissertation, which was completed at Cornell University, supported by a U.S. Department of Housing and Urban Development Dissertation Grant.
2Source: http://www.hud.gov/offices/hsg/hsgabout.cfm.
152 1051-1377/02 $35.00
䉷 2002 Elsevier Science (USA) All rights reserved.
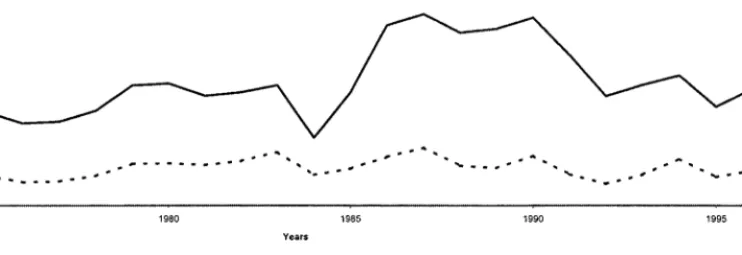
FHA MORTGAGE INSURANCE ACTIVITY 153 payments required by conventional lenders in order to purchase a house.3 Ac-cording to the U.S. General Accounting Office (GAO) report (1998), its single-family program has insured more than 24 million home mortgages since its inception. The U.S. homeownership rate has increased from 40 to 68% during the life of the FHA. There has, however, been recent discussion about the future of FHA mortgage insurance programs. As can be seen from Fig. 1, although the FHA had a 68.9% share in the mortgage insurance market in 1970, its market share has been declining during the last decade. In the 1990s, FHA-insured loans constituted 9.2% of the total dollar volume of mortgages originated and 34.5% of the total volume of the insured loans. Furthermore, the development of a secondary mortgage market and the revitalization of private mortgage insurance industry jeopardize the continuity of the FHA’s mortgage insurance programs.4 In the evaluation of the FHA’s mortgage insurance programs, one of the key questions raised is whether FHA programs have been successful in terms of increasing homeownership. In spite of the importance of this question, there is no empirical research examining the impact of FHA mortgage insurance programs on homeownership at the census tract and MSA levels. This paper attempts to fill that gap. It examines the relationship between FHA-insured mortgage activity and the homeownership rate in neighborhoods approximated using census tracts and metropolitan statistical areas (MSAs), controlling for all other factors that might affect homeownership. The goal is to provide some insights into whether these programs have achieved their purpose and whether current programs should be maintained or revised.
The analysis of the impact of FHA activity on homeownership is a difficult problem for several reasons. First, in order to examine the association between FHA activity and homeownership, there is a need to control for all other factors that might affect homeownership, such as wealth, default risk, age and size of household, housing price, income level, and the existing housing stock. Second,
3If the loan-to-value (LTV) ratio is above 80% borrowers are required to get mortgage insurance.
With mortgage insurance, lenders are protected in case of the default of a borrower. Even though private mortgage insurance (PMI) companies provide similar insurance, the FHA has more lenient requirements than PMI companies have. For example, PMI companies usually do not insure mortgages if the downpayment is less than 5% of house value (the LTV ratio was raised to 97% in 1994). In addition, they require that the monthly payment for mortgage principal, interest, taxes, and insurance must be less than 28% of the mortgagor’s monthly gross income (front-end ratio). Moreover, if a household does not have a good credit history or has a high amount of consumer debt, they may not be allowed to apply for or may be rejected for conventional loans. Although the FHA has less rigorous downpayment requirements, it restricts the loan amount that an individual can borrow. The maximum loan amount was $124,875 in high-cost areas in 1990. For a more detailed list of the FHA and PMI requirements, see Goodman and Nichols (1997) and the U.S. GAO report (1996).
4Vandell (1995) lists the causes of FHA’s recent decline in the mortgage market, including focusing
more on high-risk and low-equity loans, competition from private mortgage insurers, other government agencies, and other housing finance institutions, and organizational and managerial problems.
ZEYNEP
O ¨
NDER
FIG. 1. Market share of FHA insured loans in dollar volume of mortgage originations, 1–4 family units. Source: Author’s calculations based on HUD U.S. Housing Market Conditions.
FHA MORTGAGE INSURANCE ACTIVITY 155 it is difficult to measure FHA activity. Gross FHA activity may not be appropriate because census tracts and MSAs differ in terms of mortgage activities, housing, and economic and demographic characteristics. The best measure may be FHA-insured mortgage lending activity relative to total home mortgage lending. How-ever, although aggregate FHA data have been available at census tract and MSA levels for a long time, the other mortgage originations, such as conventional loans and mortgages originated by mortgage bankers, were not available until the 1990s. Third, there is debate concerning the appropriate unit of observation. Neighborhood or census tract level analysis is important since lenders make their choices based on neighborhood characteristics. Those critical of the FHA argue that FHA mortgage insurance programs have resulted in abandoned and deteriorat-ing neighborhoods because of fraud and misconduct in FHA mortgage origina-tions. However, the analysis at the neighborhood level does not provide the appropriate overall picture because individuals might change their neighborhoods in becoming homeowners. Since tenure choice and mobility decisions are made simultaneously (Zorn, 1988), households do not necessarily stay in the same neighborhood when they become homeowners. Hence, MSA level analysis may be more appropriate since the mobility of individuals among neighborhoods in the MSA can be taken into consideration. In addition, FHA loan limits are set generally at the MSA level. Ideally, both MSA and neighborhood levels should be examined. However, detailed neighborhood data were not available until recently. This paper examines the relationship between FHA lending and homeown-ership by attempting to solve some of the problems mentioned in the previous paragraph. First, a broader coverage is obtained by combining 1980 and 1990 U.S. Census datasets. This permits variables such as changes in neighborhood characteristics to be used. Second, FHA activity is measured relative to all mortgage activity, providing a proper control for other mortgage activity. The availability of the Home Mortgage Disclosure Act (HMDA) dataset at the census tract level enables us to obtain not only FHA lending but also other mortgage originations by mortgage bankers and depository institutions. Third, analyses are performed at both census tract and MSA levels. Census tracts are taken as approximations for neighborhoods. The analysis at census tract level assumes that households stay in the same census tract when they become homeowners. On the other hand, the analysis at the MSA level assumes that households can move other census tracts when they get a mortgage.
It is hypothesized that areas with higher FHA activity as a percent of total mortgage originations tend to have higher homeownership rates, controlling for all other characteristics of census tracts and MSAs. According to the U.S. GAO report (1996) that examines the 1994 HMDA dataset, the FHA market share for home purchase loans made to the first-time homeowners is 21%. These loans correspond to 67% of FHA-insured home purchase loans. Furthermore, about two-thirds of FHA’s 1995 home purchase borrowers would not qualify for private mortgage insurance on the loans they received. Similarly, Bunce et al. (1995),
using American Housing Survey data for 1983 through 1992, calculate that on average 57% of FHA-insured loans are obtained by the first-time homebuyers with the loan-to-value (LTV) ratio greater than 95%. In 1996, 74% of the FHA loans are originated for the first-time homebuyers (GAO, 1998). These figures suggest that FHA has an important role in providing mortgage for the first-time homebuyers and those households that do not qualify for the requirements of the private mortgage insurance companies. It can be argued that although FHA-insured loans are generally more expensive than conventional loans, first-time homebuyers and those with low downpayments prefer them.5Hence, FHA activity may increase the homeownership rate. In order to see whether the impact of FHA activity on the homeownership rate differs for whites and blacks, the models are estimated for them separately. In addition, census tracts and MSAs are compared based on their minority population and relative income level.
The empirical results indicate that the FHA mortgage insurance program has significant positive effects on homeownership in predominantly white and/or moderate to high-income MSAs and predominantly minority and/or moderate-to high-income census tracts. However, the estimated coefficients associated with the relative FHA activity are found to be relatively small in magnitude. Overall, the results suggest that FHA programs are of limited effect in the achievement of homeownership, but may be of greater assistance to whites relative to blacks. The paper is organized as follows. The next section summarizes the results of several studies examining FHA activity. The third and fourth sections present, respectively, the empirical model and data used in the analysis. Results for census tract and MSA level estimations are presented in the fifth section. Policy implications of the findings are discussed in the sixth section. The seventh section concludes the paper.
BACKGROUND
The results of several studies have suggested that FHA-insured mortgage programs might benefit individuals and households that could not become home-owners with conventional loans due to high downpayments and low mortgage payment-to-income ratio constraints. For example, Linneman and Wachter (1989) find that downpayment or loan-to-value (LTV) ratio requirements restrict some individuals from becoming homeowners. These constraints are found to reduce the probability of homeownership of young adults by 10 to 20% (Haurin et al.,
5The FHA used to be the last resort for becoming homeowner. However, the availability of subprime
mortgage loans and risk-based pricing of mortgage credit has changed this status of the FHA-insured loans. Subprime loans are those made by lenders who target borrowers that are judged to be higher risk. In some cases, subprime lending can involve not only higher interest rates but also some “predatory” practices.
FHA MORTGAGE INSURANCE ACTIVITY 157 1997). In addition, Zorn’s results (1993) suggest that approximately 46% of U.S. households, both first-time homebuyers and renters, are constrained by downpayment and mortgage payment-to-income ratio requirements. Similarly, Philips and VanderHoff (1994) show that the elimination of the LTV constraint increases housing demand by 6.2% and the elimination of the mortgage payment-to-income constraint increases housing demand by another 6%. These findings imply that FHA programs might increase homeownership by providing mortgages to those households that are on the margin of eligibility for conventional loans. However, Goodman and Nichols (1997) show that households that are eligible for FHA loans become eligible for conventional loans within few years. Hence, households might wait to become homeowners if they are not qualified for the conventional loans, reducing the impact of FHA on homeownership.
Several studies have found that blacks are more likely to use FHA-insured mortgages (Canner et al., 1991; Gabriel and Rosenthal, 1991; O¨ nder, 1998), and that they are more likely to be exposed to FHA loans than whites (Yinger, 1991). In addition, blacks have different homeownership behavior from their white counterparts (Wachter and Megbolugbe, 1992; Buist et al., 1994), and their homeownership rate is lower than that of whites. Megbolugbe and Linneman (1993) group the reasons for low homeownership rate of minorities into three categories. First, some factors that determine tenure, such as income and wealth, are highly correlated with minority status. Second, minorities may face discrimi-nation in purchasing a house. Third, they may have a distinct type of housing demand function. When the demand function of minorities is combined with market supply idiosyncrasies, they might prefer renting to owning. The first two reasons suggest that FHA-insured loans might help blacks more in becoming home owners than whites because a large downpayment is not required for insured loans and because blacks are more likely to be exposed to FHA-insured loans.
The literature on homeownership is very rich.6In general, the aggregate home-ownership rate is taken as an aggregation of individual tenure choice decisions. Hence, the factors that affect an individual’s tenure choice will also affect the aggregate homeownership rate. The level and the variation of homeownership rates are empirically explained by financial, demographic and institutional factors (Buist et al., 1994). For example, the wealth and income of households and the cost of owning relative to renting are important in explaining not only homeownership rates but also racial and ethnic variation in homeownership rates
6There are several factors that might affect homeownership rate. For example, age, income, race,
family structure, house values, property taxes, availability of housing units for renting and owning and geographical region are some of the factors that will affect an individual’s homeownership decision. For the review of tenure choice literature and the summary of factors affecting homeown-ership rate, see Megbolugbe and Linneman (1993).
(Wachter and Megbolugbe, 1992). Moreover, there is geographic variation in homeownership rates.7The homeownership rate is low in young, minority-popu-lated, and low-income areas. In addition, the availability of mortgage alternatives might affect the homeownership rate. For example, if there is monopoly in the lending market, mortgage interest rates will be higher (Aspinwall, 1970), re-stricting the ability to become a homeowner. This suggests that the availability of FHA loans in these areas might increase homeownership.
There are variations among census tracts and MSAs in terms of minority population and income level, both of which might affect homeownership and mortgage activity. The supporters of FHA mortgage programs argue that those living in low-income and minority neighborhoods would be less likely to become homeowners without FHA mortgage insurance programs because these neighbor-hoods are considered to be underserved by conventional mortgage lenders. Empir-ically, it has been found that minority households (Gabriel and Rosenthal, 1991), borrowers with high default risk (Canner et al., 1991), and those living in central cities, or in neighborhoods with a high unemployment rate, high minority popula-tion, or low median family income (MacRae et al., 1982; Megbolugbe et al., 1994; O¨ nder, 1998) are more likely to use FHA loans. However, there is a shortage of studies examining whether the FHA achieves its purpose in terms of increasing homeownership rate at the macro level and whether there is a difference in the impact of FHA activity on homeownership in the underserved areas. The next section presents the empirical model used in the analysis to answer these questions.
EMPIRICAL MODEL
In the analysis of the impact of FHA activity on homeownership, all other factors that might affect homeownership have to be taken into consideration. Given the results of previous studies, these factors are grouped into four categories in the model: demographic, economic, housing, and lender market characteristics in the area.8
Analysis at Census Tract Level
The basic model used for the census tract level estimations can be expressed as
7For example, Haurin et al. (1988) find that aggregate homeownership rates vary from 49 to 72%
in the 34 large metropolitan areas covered by the 1974–1975 and 1977–1978 Annual Housing Surveys.
8Although individual factors are also important in homeownership decision, the unavailability of
FHA MORTGAGE INSURANCE ACTIVITY 159
OWNn⫽0⫹
兺
M
m⫽1␦mMSAmn⫹1FHAn⫹2INCOMEn
⫹3DEMOGRAPHICn⫹4HOUSINGn (1)
⫹5LENDER MARKETn⫹ n,
where OWNn is the ratio of owner-occupied households to total number of
households in the census tract n.9MSA
mnrepresents a vector of dummy variables
(fixed effects) taking a value of 1 if the census tract n is located in the MSA m and taking a value of 0 otherwise. These dummy variables are included in the model in order to control for the impact of MSA characteristics on homeownership in census tracts. Hence, this model can be considered as an intra-MSA model, comparing the census tracts located in the same MSA. FHAnshows the percentage
of FHA-insured loans among the newly originated home purchase loans in the census tract n. INCOMEn represents a vector of economic variables including median family income in the census tract, the change in median family income in the census tract over the last decade and dummy variables showing the income level of the census tract n relative to the income in the corresponding MSA. Median family income splines are also included in the model in order to identify any nonlinear relationship between income and homeownership.
DEMO-GRAPHICn represents a vector of demographic variables including minority
percentage, average household size, age distribution of head of household, popula-tion, change in overall populapopula-tion, and change in minority population over the last decade in the census tract n. Housing market characteristics are represented by HOUSINGn. It includes the distribution of housing units according to the
1990 U.S. Census. LENDER MARKETnrepresents a vector of variables
charac-terizing the lender market in the census tract n. The Herfindhal index, as a measure of concentration in mortgage market, and the ratio of mortgage bankers-to-depository institutions are included as lender market characteristics.
In the model specified in Eq. (1), the effect of FHA-insured mortgage activity on the homeownership rate is assumed to be similar regardless of minority share or relative income level in the census tract. Previous studies find that FHA activity is higher in high minority-populated and low-income neighborhoods, but homeownership rates are lower in these neighborhoods (for example, MacRae
et al., 1982; Megbolugbe et al., 1994). In order to examine the impact of FHA
activity on homeownership in these areas, two different models are also estimated. The first model tests whether the impact of FHA activity on homeownership differs depending on the minority population in the census tract. Census tracts
9The homeownership rate was also defined as the ratio of owner-occupied housing units to total
available housing units. However, the results did not change with respect to the definition of homeown-ership rate.
are grouped into four categories depending on their minority10share: predomi-nantly white (less than 10% minority share), moderately white (between 10 and 25%), moderately minority (between 25 and 50%), and predominantly minority (more than 50%). The second model tests whether the impact of FHA activity on the homeownership rate differs in census tracts depending on their relative income level. Census tracts are grouped into five categories according to their median family income relative to the median family income in the corresponding MSA: distressed (less than 50% of MSA median family income), low income (between 50 and 80%), low-to-moderate income (between 80 and 100%), high-to-moderate income (between 100 and 120%), and high-income (more than 120%).11Two sets of dummy variables are created for each minority share and relative income group and included in the model. The interaction variables be-tween FHA-insured mortgage activity and the dummy variables representing minority share or relative income level are also incorporated. Since FHA programs aim at increasing homeownership in underserved areas, such as predominantly minority-populated and low- and moderate-income neighborhoods, it is hypothe-sized that the impact of FHA activity on the homeownership rate is positive and significant in these census tracts.
Analysis at MSA Level
The estimation at the MSA level employs a two-step procedure, as used in Avery, Beeson and Sniderman (1999).12This procedure eliminates the impact of neighborhood characteristics on homeownership rate at MSA level analysis.13In the first step, the homeownership rate in the census tract is regressed against other census tract characteristics that might affect homeownership in census tract. The MSA dummy variables (fixed effects) are also included in the model.
10Minority population is defined as nonwhite population. It includes blacks, Hispanics, Native
Americans, Asians, and others.
11Neighborhoods are classified similarly in the Report to the Congress. Neighborhoods classified
based on their income relative to the MSA median income are called distressed (less than 50%), low-income (between 50 and 80%), moderate-income (between 80 and 120%), and high-income (more than 120%) neighborhoods. In the same report, neighborhoods are classified based on their minority share as predominantly white (less than 10% minority share), moderately minority (between 10 and 50%), and predominantly minority (more than 50%) neighborhoods (Board of Governors of the Federal Reserve System, 1993).
12For more information about the two-step procedure, see Avery et al. (1994; 1999).
13Although MSA level analysis can be done using aggregated homeownership rate and aggregated
FHA activity, this procedure will mask the impact of census tract characteristics at the MSA level. MSAs with heterogeneous census tracts are different from the MSAs with homogeneous census tracts, even though these MSAs have similar characteristics at the aggregate level. Hence, the distribution of census tracts is also important and the neighborhood factors should be controlled in MSA level analysis in addition to the MSA characteristics.
FHA MORTGAGE INSURANCE ACTIVITY 161 In the first step, the following model is estimated:
OWNn⫽0⫹
兺
M m⫽1m
MSAmn⫹2INCOMEn⫹3DEMOGRAPHICn (2)
⫹4HOUSINGn⫹5LENDERn⫹ n.
This model is similar to the first model estimated at the census tract level, specified in Eq. (1). However, FHA activity at the census tract level is not included in the first step estimation since the aim is to examine the impact of FHA on homeownership at the MSA level.14
In the second step, the impact of FHA activity at the MSA level is examined controlling for MSA characteristics in addition to census tract characteristics. The following model is estimated in the second step,
OWNm⫽␥0⫹␥1FHAm⫹␥2INCOMEm⫹␥3DEMOGRAPHICm (3)
⫹␥4LENDERm⫹ m,
where
OWNm⫽
兺
Nmn⫽1(OWNn⫺ (ˆ0⫹ˆ2INCOMEn (4)⫹ˆ
3DEMOGRAPHICn⫹ˆ4HOUSINGn⫹ˆ5LENDERn))⫽ˆm.
The dependent variable in this step is the estimated coefficient on the dummy variable for each MSA at the census tract level,ˆm. This coefficient represents
the homeownership rate in the MSA that is not explained by census tract character-istics. This procedure picks up any census tract effect incorporated in FHA activity as well as its impact on homeownership. FHA activity at this level,
FHAm, is obtained by aggregating FHA activity from census tracts located in
the same MSA. In other words, it is the share of FHA-insured loans among all home-purchase loans originated in the MSA m during the period analyzed.
Nmis the number of census tracts in the MSA m. Control variables at the MSA
level are similar to those used at the census tract level. INCOMEm includes
dummy variables representing the median family income level in the MSA relative to the national median family income, median family income in 1990, growth in median family income between 1980 and 1990, share of households with income less than $50,000 and unemployment rate. DEMOGRAPHICmrepresents a vector of variables including growth in population between 1980 and 1990,
14When census tract level FHA activity is included in the model in addition to other census tract
characteristics, the results show that FHA activity does not affect homeownership significantly at the MSA level.
change in minority share over the same decade, dummy variables for minority share, percentage of young population, average household size, and dummy variables for population. LENDERmrepresents lender market characteristics—the
Herfindahl index for mortgage market concentration and the mortgage bank-to-deposit institutions ratio. In addition, dummy variables representing the regions in the country are included in the model.
Similar to the census tract classifications, MSAs are grouped into four catego-ries based on their minority share: predominantly white, moderately white, moder-ately minority, and predominantly minority. Similarly, they are grouped into four categories based on their median family income relative to the national median family income:15low-income (less than 80%), low-to-moderate income (between 80 and 100%), to-moderate income (between 100 and 120%), and high-income (more than 120% of national median family high-income). Including interaction variables between these dummy variables and FHA activity in the MSA, the impact of FHA-insured mortgage activity on homeownership rate is analyzed in MSAs based on their minority share or relative income level.
DATA
Same datasets are used in the analysis at both census tract and MSA levels. Two datasets are combined in the analysis: 1980 and 1990 U.S. Censuses and the 1990 Home Mortgage Disclosure Act (HMDA) dataset.16FHA and
LENDER-MARKET variables are calculated from the latter dataset. Since the HMDA dataset
provides mortgage originations at the individual level,17 mortgage activity is aggregated from individual mortgage originations in the corresponding area. All other variables are obtained from the 1980 and 1990 U.S. Censuses.
Census Tract Level Data
The total number of census tracts analyzed is 39,124. Census tracts located in Alaska, Hawaii, and Puerto Rico are not included in the analysis. Table I presents
15According to the 1990 U.S. Census, the national median family income is $35,700 based on the
author’s calculation.
16According to the HMDA, depository institutions, their direct subsidiaries whose assets exceed
$10 million and which have a branch office in an MSA, savings and loan associations, service corporations that grant home loans, mortgage banking subsidiaries of commercial banks, and mortgage lending institutions with assets exceeding $10 million that are unaffiliated with depository institutions, have to provide information about mortgage applicants’ characteristics, such as type of loan, mortgage applicant’s income, race, sex, location of loan, and final decision of lender on the extension of credit (Canner and Gabriel, 1992).
17Even though HMDA dataset is considered to be the most comprehensive dataset on mortgage
originations, it does not provide some information that is important in tenure and mortgage decisions, such as default risk, wealth and cost of owning. Because of the omission of these variables, the estimated coefficients may be biased. The effects of this omission are discussed in the results section.
FHA MOR TGAGE INSURANCE ACTIVITY 163 TABLE I
Mean Homeownership Rates and FHA Activity in the Census Tracts Based on Certain Census Tract Characteristics
Number of Change in White Black
census Homeownership homeownership homeownership homeownership FHA Census tracts tracts rate rate, 1980–1990 rate rate activitya
All census tracts 39,124 0.62134 ⫺0.02797 0.67580 0.41570 0.26519
Census tracts with FHA-insured mortgage activity
0.00–0.10 15,375 0.60242 ⫺0.00962 0.67201 0.32352 0.01956 0.10–0.25 6,772 0.66857 ⫺0.02439 0.70680 0.42926 0.14175 0.25–0.50 8,162 0.63877 ⫺0.03631 0.68063 0.44956 0.33327 0.50–1.00 8,815 0.59476 ⫺0.05313 0.64535 0.46134 0.67509
Census tracts with minority share
0.00–0.10 16,078 0.74203 ⫺0.02214 0.74870 0.48513 0.21004 0.10–0.25 8,537 0.60644 ⫺0.03264 0.62762 0.41184 0.27412 0.25–0.50 5,582 0.51346 ⫺0.03621 0.55598 0.37588 0.30972 0.50–1.00 8,927 0.44411 ⫺0.02834 0.53726 0.42139 0.31673
Census tracts with median family income relative to MSA income
0.00–0.50 3,019 0.24614 ⫺0.02727 0.28724 0.26681 0.31854 0.50–0.80 7,566 0.43679 ⫺0.03586 0.49764 0.39241 0.34418 0.80–1.00 8,855 0.60415 ⫺0.03121 0.64013 0.47065 0.29292 1.00–1.20 8,779 0.68534 ⫺0.02577 0.70925 0.51020 0.25208 1.20– 10,705 0.73063 ⫺0.02349 0.74620 0.55262 0.19206
Source. Author’s calculations based on 1980, 1990 U.S. Census and 1990 HMDA datasets.
ZEYNEP
O ¨
NDER
TABLE II
Mean Homeownership Rates and FHA Activity in the MSAs Based on Certain MSA Characteristics
Change in White Black FHA-insured Number of Homeownership homeownership homeownership homeownership mortgage MSAs MSAs rate rate, 1980–1990 rate rate activitya
All MSAs 335 0.62134 ⫺0.01416 0.67580 0.41570 0.26454
MSAs with FHA activity
0.00–0.10 50 0.54988 0.00186 0.63087 0.31550 0.03708 0.10–0.25 106 0.64854 ⫺0.00919 0.69245 0.42640 0.17167 0.25–0.50 120 0.64190 ⫺0.01836 0.69135 0.44399 0.35968 0.50–1.00 59 0.62719 ⫺0.04064 0.66472 0.45452 0.59420
MSAs with minority share
0.00–0.10 110 0.67923 ⫺0.01698 0.69538 0.38063 0.26504 0.10–0.25 132 0.66157 ⫺0.02027 0.69923 0.44687 0.27942 0.25–0.50 81 0.60212 ⫺0.01132 0.66565 0.42816 0.30578 0.50–1.00 12 0.45111 0.00409 0.52608 0.30278 0.09874
MSAs with median income related to national income
0.00–0.80 91 0.64775 ⫺0.03459 0.69536 0.48462 0.41845 0.80–1.00 142 0.64204 ⫺0.02635 0.68310 0.43358 0.32933 1.00–1.20 65 0.58629 ⫺0.00155 0.65655 0.38505 0.20335
1.20– 37 0.62844 0.00364 0.68427 0.37929 0.12013
Source. Author’s calculations based on 1980, 1990 U.S. Census and 1990 HMDA datasets.
FHA MORTGAGE INSURANCE ACTIVITY 165 mean homeownership rates in 1990, changes in homeownership rates from 1980 to 1990, and FHA activity at the census tract level weighted by the number of households in each census tract. The mean values suggest that FHA activity has been concentrated in areas with low homeownership rates. For example, mean overall and white homeownership rates are highest in census tracts with moderate FHA-insured mortgage activity (between 10 and 25% of total mortgage origina-tions), but they are lowest in census tracts with more than 50% FHA activity. However, the mean black homeownership rate is highest in the latter tracts. The average decline in overall homeownership rate during the last decade is highest in census tracts with high FHA activity. The mean FHA activity is lowest in almost all white and high-income census tracts where the mean overall, white, and black homeownership rates are highest. These mean values suggest that in general FHA has high market share in census tracts where homeownership rate is low because high FHA activity is observed in census tracts with low homeown-ership rates. However, these figures are only mean values without controlling for the other census tract characteristics and the MSA where the tract is located. The descriptive statistics for variables used in the regression analysis at the census tract level are reported in the Appendix (Table A1).
MSA Level Data
The number of MSAs in the sample is 335. Those MSAs in Alaska, Hawaii, and Puerto Rico are excluded from the analysis. The census tract observations are aggregated at the MSA level. Table II presents mean homeownership rates, change in homeownership rates from 1980 to 1990, and FHA activity in MSAs classified based on their FHA-insured mortgage activity, minority percentage, and relative median family income, weighted by the number of households in each MSA. Although no clear-cut relationship between overall and white homeownership rates and FHA-insured mortgage activity is observed, the black homeownership rate is highest in MSAs with the highest relative FHA-insured mortgage activity. White and black homeownership rates and FHA activity are highest in moderately white-populated MSAs. Interestingly, not only the mean FHA activity but also all of the mean homeownership rates are highest in low-income MSAs (MSAs where the median family low-income is less than 80% of the national median family income). The descriptive statistics for the variables used in the regression analysis at the MSA level are shown in the Appendix (Table A2). Several assumptions are imbedded in this analysis. First, it is assumed that the results obtained in the period analyzed are representative of the past; hence, it can be generalized for past years. Second, FHA activity is approximated by the presence of FHA lending, resulting in the indirect test of FHA activity. Third, all other factors that might affect homeownership are assumed to be controlled for in the analysis. However, some factors that influence tenure and mortgage
choices, such as wealth and cost of owning, are not available. Fourth, homeown-ership that is obtained at one point in time is assumed to represent marginal homeownership activity.
EMPIRICAL RESULTS
Results at Census Tract Level
The estimated marginal impacts of FHA activity18on homeownership rate at the census tract level are presented for all households, as well as for white and black households in Table III.19The results show that FHA activity and homeownership are positively and significantly related, controlling for economic, demographic, housing, and lender market characteristics of census tracts located in the same MSA, although the coefficient on FHA activity is small. If the average FHA activity increases by 100%, the average homeownership rate will increase by only 2.2%. This finding is consistent with the study by LaFayette et al. (1995). In their simulation analysis, the homeownership rate of individuals declined by only 0.1% in the absence of FHA loans.
When census tracts within the same MSA are compared based on their minority share,20it is found that the coefficient on FHA activity is increasing with minority share, controlling for other demographic, economic, lender market and housing characteristics of census tracts. For example, if average FHA activity increases by 100%, average homeownership rate will increase by 0.8% (4.0%) in predominantly white (predominantly minority) neighborhoods. These results suggest that FHA-insured mortgage activity is most helpful to those households living in moderately and predominantly minority census tracts, supporting the findings of previous studies that FHA programs serve minority neighborhoods (e.g., MacRae et al., 1982).
18All models presented in the paper are also estimated using government-insured mortgage activity,
i.e., including FHA, Veterans Administration (VA), and Farmers Housing Administration (FmHA) loans, assuming that the VA and FmHA loans are close substitutes for FHA loans. The results of these estimates are similar but the coefficients are found to be slightly lower than the figures that are obtained by using only FHA-insured and conventional loans. This suggests that other government-insured mortgages might not be used by first-time homebuyers. For the sake of brevity, they are not reported in the paper but available from the author upon request.
19The estimated coefficients on control variables are similar to expectations. For example,
predomi-nantly white-populated, or relatively wealthy census tracts or census tracts with a decline in minority population over the past decade have higher homeownership rates than other census tracts. Parameter estimates and their t-statistics are presented in the Appendix (Table A3). The coefficients for white and black households are found to be similar to those for all households. One exception is that unlike white and all homeownership rates, black homeownership rate is found to be lowest in predominantly white neighborhoods. In order to save space, the results for white and black homeownership models are not presented. They are available from the author upon request.
20The model is estimated with interaction variables between FHA activity and dummy variables
FHA MOR TGAGE INSURANCE ACTIVITY 167 TABLE III
Marginal Effects of FHA-Insured Mortgage Activity on Homeownership Rates at Census Tract Levela
Overall Whites Blacks
Parameter t- Parameter t- Parameter
t-estimate Statistic estimate Statistic estimate Statistic
All census tracts 2.16 10.43 1.21 5.30 0.47 1.62
Census tracts with minority share
0.00–0.10 0.84 2.66 0.06 0.21 ⫺3.98 ⫺3.50
0.10–0.25 0.88 2.80 0.47 1.49 ⫺1.07 ⫺1.62
0.25–0.50 1.73 5.15 2.65 7.31 ⫺1.07 ⫺1.89
0.50–1.00 4.00 13.93 3.63 7.43 1.65 4.76
Census tracts with median family income
Less than 50% of MSA income 0.15 0.31 ⫺0.78 ⫺0.85 ⫺0.63 ⫺0.86 Between 50 and 80% of MSA income 2.25 7.55 0.46 1.29 ⫺0.04 ⫺0.07 Between 80 and 100% of MSA income 2.62 8.69 1.64 5.12 0.88 0.21 Between 100 and 120% of MSA income 2.54 7.91 1.63 4.88 2.41 4.55 More than 120% of MSA income 2.38 6.51 1.45 3.84 1.83 2.88
aAll of the marginal effects are multiplied by 100. These parameter estimates can be interpreted as the impact of the change in average FHA activity on
the average homeownership rate. The parameter estimates on the first row represent the estimated coefficient on the FHA mortgage share for all, white, and black households at the census tract level. The second part of the table summarizes the impact of FHA activity in different census tracts classified according to their minority share. The coefficients represent the impact of FHA activity in the corresponding census tract. They are estimated assuming that the impact of FHA-insured mortgage activity is different in census tracts with a different minority share. They are calculated from the estimated coefficients on interaction variables between FHA activity and dummy variables representing the census tract adjusted from the base census tract group, which includes census tracts with a minority share of less than 10%. Similarly, the third part of the table presents the impact of FHA activity on homeownership in census tracts with different relative income levels. The model assumes that the impact varies according to the income level in census tract relative to the income level in the corresponding MSA. The marginal effects are calculated from the estimated coefficients on interaction variables between FHA activity and dummy variables representing the census tract adjusted from the base census tract group, which includes census tracts with relative income less than 50% of the MSA median family income. The estimated models for all households are presented in the Appendix, Table A3.
The impact of FHA activity is found to be different for white and black households in census tracts with different minority population shares. For white households, the positive association between homeownership and FHA activity is significant in moderately and predominantly minority census tracts (with more than 25% minority share). However, for black households, the significant and positive relationship is obtained only in predominantly minority census tracts (with more than 50% minority share). Interestingly, in predominantly white census tracts, the coefficient on black FHA activity is found to be significant and negative. It is possible that black households living in white census tracts might get FHA loans and move to more minority-populated census tracts in order to own houses. Since the change in population is also controlled for, a negative coefficient is observed.
The analysis of the impact of FHA activity with respect to the relative median family income level suggests that the FHA does not have a significant impact in the distressed neighborhoods where median census tract income is less than 50% of median family income in that MSA. However, FHA-insured mortgage activity has a significant and positive relationship with homeownership in low-, moderate-, and high-income census tracts located in the same MSA.21These results are interest-ing since the mean relative FHA activity is highest in distressed and low-income census tracts, and the aim of the FHA programs is to increase homeownership rate in these neighborhoods. The insignificant coefficient in distressed neighborhoods and significant coefficients in other neighborhoods may be explained by the mobility of households from low-income census tracts to moderate- and high-income census tracts to become homeowners. For example, renters having higher income relative to their neighborhood are particularly more likely to move to better neighborhoods when they become homeowners. It is also possible that households living in high-income neighborhoods but having high default risk may be using FHA loans to become homeowners. In addition, first-time homeowners in these wealthy neighbor-hoods who could get conventional loans might be using FHA loans in order to get a higher rate of return by putting less equity in their houses.
Similar results are obtained when white and black households living in census tracts with different income levels are compared.22The results suggest that white households living in moderate- and high-income neighborhoods and black house-holds living in high-to-moderate and high-income census tracts benefit most from FHA loans in becoming homeowners. These results are contrary to the basic aim of FHA programs, i.e., increasing homeownership rate in low- and moderate-income neighborhoods.
21The census tracts are classified into groups relative to the national median family income in
addition to MSA median family income. The results are similar to those reported on Table III and Table A3.
22The equality of FHA coefficients for white and black households is rejected for all three models
FHA MORTGAGE INSURANCE ACTIVITY 169
TABLE IV
Marginal Effects of FHA-Insured Mortgage Activity on Homeownership Rates at the MSA Levela
Overall Whites Blacks
Parameter t- Parameter t- Parameter t-estimate Statistic estimate Statistic estimate Statistic
All MSAs 3.43 2.53 5.88 4.22 5.37 3.48
MSA groups with minority share
0.00–0.10 9.27 4.10 9.14 4.50 4.51 0.97
0.10–0.25 1.22 0.65 3.94 2.10 ⫺0.42 ⫺0.21
0.25–0.50 ⫺0.75 ⫺0.38 2.30 1.07 6.04 3.23
0.50–1.00 0.18 0.05 ⫺3.00 ⫺0.64 13.43 3.41
MSA groups with income level relative to MSA median income (based on national median family income)
Less than 80% 1.14 0.45 3.37 1.30 0.63 0.24
Between 80 and 100% 3.00 1.58 4.54 2.50 1.07 0.48 Between 100 and 120% 5.09 2.32 8.13 3.81 5.73 2.58
More than 120% 7.65 2.20 13.35 3.49 19.41 6.51
aAll of the marginal effects are multiplied by 100. These parameter estimates can be interpreted
as the impact of the average FHA activity on the average homeownership rate. The first row shows the estimated coefficients and corresponding t-statistics on the FHA mortgage share for all, white and black households at the MSA level. The second part of the table summarizes the impact of FHA activity in MSAs in different minority share groups. The coefficients represent the impact of the FHA activity in the corresponding MSA. These coefficients are estimated assuming that FHA-insured mortgage activity has different impact in MSAs with different minority share. They are calculated from the estimated coefficients on interaction variables between FHA activity and dummy variable representing the MSA adjusted from the base MSA group, which includes MSAs with a minority share of less than 10%. Similarly, the third part of the table presents the impact of FHA activity on homeownership in MSAs with different relative income levels. This model assumes that the impact differs with the relative income level in the MSA. The impacts are calculated from the estimated coefficients on interaction variables between FHA activity and dummy variables representing the MSA adjusted from the base MSA group, which includes MSAs with relative income less than 50% of the MSA median family income. The estimated models for all households are presented in Table A4.
Since most lenders make their mortgage decisions based on neighborhood charac-teristics, the analysis of the impact of FHA activity on homeownership at the neighborhood (census tract) level is important. Although the change in population is controlled for, the estimated models at census tract level assume that people stay in the same neighborhood when they become homeowners. Therefore, the results may not provide the appropriate overall impact of FHA programs. Mobility associ-ated with home purchase may result in small coefficients on FHA activity at the census tract level. The next section presents the MSA level analysis that will shed light on this issue.
Results at MSA Level
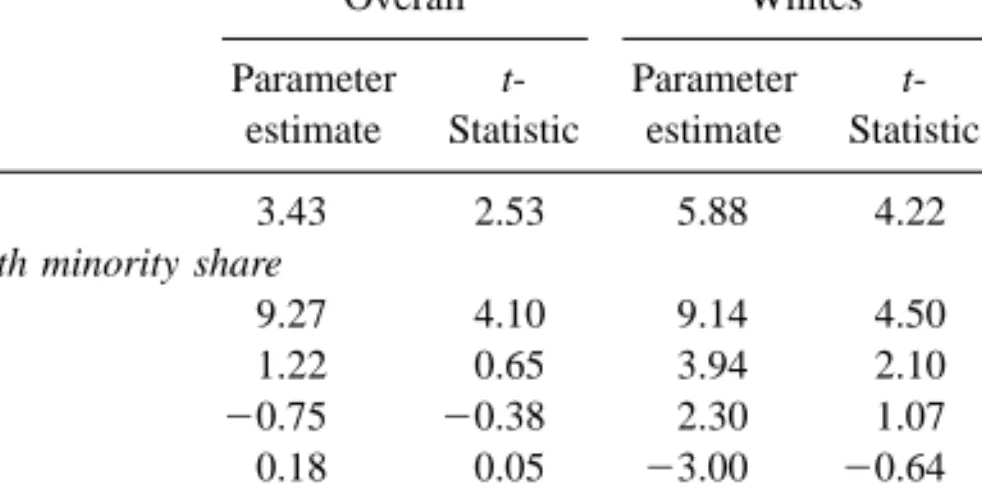
The marginal effects of FHA activity at the MSA level are presented in Table IV.23 It is found that for all households, FHA activity and homeownership are positively and significantly related, controlling for economic, demographic, and mortgage lender market characteristics of the MSA and its census tracts.24The coefficients are slightly higher at MSA level than those at census tract level. These results are found to be true not only for all households but also for white and black households.
When MSAs are compared based on their minority share, it is found that FHA activity has a significant impact on homeownership rate only in predominantly white MSAs. Specifically, FHA programs benefit households in predominantly white MSAs more than those in other MSAs with similar census tract characteris-tics.25However, except for these MSAs, the impact of FHA activity is found to be insignificant. Thus any impact of FHA is best explained at the neighborhood level. The impact of FHA activity is found to be different for black and white households. It is found that white FHA activity is significantly and positively related to the white homeownership rate in predominantly and moderately white MSAs where minority share is less than 25%. However, black FHA activity is significantly and positively related to black ownership in relatively minority-populated MSAs where the minority share is higher than 25%. These findings suggest that whites living in white-populated MSAs and blacks living in minority-populated MSAs get FHA-insured loans in becoming homeowners.
When MSAs are compared with respect to their relative income levels, it is observed that FHA activity has the highest impact in high-income MSAs, control-ling for census tract and MSA characteristics. This relationship is observed not only for all households but also for white and black households. Similar to the
23The second stage estimations for all households are presented in the Appendix, Table A4. The
coefficients on control variables are found to be similar to expectations and the models are good in terms of their explanatory powers. For the sake of brevity, all of the first step estimations and the second step estimations for whites and blacks are not presented. They are available from the author upon request.
24The MSA level homeownership rate is regressed against FHA activity and other MSA variables
without controlling for census tract characteristics. The results are slightly different from those obtained when census tract characteristics are taken into consideration. However, they are more difficult to interpret since they also reflect information at the census tract level. In addition, nonlinearity between FHA activity and homeownership and the impacts of some census tract characteristics are integrated into the MSA factors. No significant impact of the FHA is found at the overall level. Significant and positive coefficients are observed in moderately and predominantly minority-populated and moderate-income level MSAs (between 100 and 120%). The results obtained for white and black households are almost the same. Their FHA activity has a positive and significant impact at the overall level, as well as in moderate-income and predominantly minority-populated MSAs.
25The positive and significant impact of FHA activity on homeownership in almost all
white-populated MSAs is not explained totally by the neighborhood level FHA activity since the results obtained by controlling census tract FHA activity are similar to those reported in Table IV.
FHA MORTGAGE INSURANCE ACTIVITY 171 census tract level analysis, this finding seems to be contrary to the basic aim of the FHA, i.e., increasing homeownership rate in low- and moderate-income areas. These results should be interpreted with caution since individual factors, such as wealth, default risk, and cost of owning, are not taken into consideration in this study. Although we observe a significant impact of FHA in high-income MSAs, households with low income, high default risk, or low wealth living in these MSAs might be using FHA loans to become homeowners. We know that in general, wealthy households are less likely to use FHA loans and more likely to be homeowners. Since FHA activity and wealth are negatively correlated but wealth and homeownership have positive correlation, the omission of wealth may result in the underestimation of the coefficient on FHA activity. Hence, this omitted variable (wealth) might explain the small effect of the FHA on homeownership in these models.
In addition, the cost of owning is another important variable that affects the tenure decision of households. If this cost is high in the area, individuals are less likely to use FHA loans because of FHA loan limit. Furthermore, the homeown-ership rate is expected to be low in places where the cost of homeownhomeown-ership is high. Since this cost is negatively related with both FHA activity and homeown-ership, the exclusion of this important variable might increase the impact of FHA on homeownership. Hence, these two omitted variables may act in opposite and offsetting directions. However, the omitted variables may reduce the standard error of the estimated coefficient, leading to greater apparent significance of the impact of FHA in some neighborhoods or MSAs.
POLICY IMPLICATIONS
This study has some important policy implications. One of the aims of the FHA is expanding homeownership in the areas underserved by conventional lenders, such as minority-populated, distressed, and low-income neighborhoods. Supporters of FHA programs argue that those living in low-income and minority neighborhoods are less likely to become homeowners without FHA loans. The results of the GAO and the Department of Housing and Urban Development (HUD) studies indicate that FHA serves first-time homebuyers and low-income and minority households (GAO, 1996; Bunce et al., 1995). However, the results of this study suggest that FHA does not affect the homeownership rate signifi-cantly in these underserved neighborhoods. Although mean FHA activity is very high, target households may not be using FHA loans in these areas. Hence, the government entities should concentrate on the users of FHA loans in these neighborhoods in evaluating the efficacy of federal mortgage programs.
The FHA has strict housing quality restrictions. Hence, the houses in distressed neighborhoods where low-income households may be able to afford to buy a house may not meet the quality standards of the FHA. Therefore, these households may not get FHA loans. If FHA wants to increase homeownership in distressed
neighborhoods, it may need to re-evaluate its standards in these areas. Even though this suggestion appears to contradict the FHA objective of improving housing standards and conditions, the FHA may in fact increase the quality of housing in these neighborhoods by revising its quality standards and hence increasing homeownership. The homeownership rate is very low in these neigh-borhoods (24.6%). Since increased homeownership may increase housing quality in distressed neighborhoods, the FHA might in fact increase housing quality in these areas.
In evaluating the efficacy of FHA programs, neighborhoods should be taken as a unit of comparison because the aggregation in MSAs masks the specific characteristics of neighborhoods. Moreover, some of the census tract characteris-tics offset the impact of FHA activity at the MSA level.
CONCLUSION
This study investigates the impact of FHA-insured mortgage activity on home-ownership using 1990 HMDA dataset combined with the data from 1980 and 1990 U.S. Censuses. The findings suggest that FHA-insured mortgage programs modestly helped households to become homeowners in 1990 at the aggregate level. White households benefited more from FHA-insured loans in becoming homeowners than black households did. Although a positive and significant impact of FHA activity on homeownership is observed in the analysis, the coefficients on the relative FHA activity are found to be relatively small.
The results suggest that contrary to expectations and the aim of the FHA, its programs do not significantly contribute to homeownership rates in distressed and low-income census tracts and MSAs. The high impact of FHA in relatively wealthy areas can be attributed to the use of FHA loans by households with high default risk or less wealth, and living in these areas. Similarly, the higher impact of FHA on whites than blacks can be also explained by the use of FHA loans by whites who have a higher default risk and less wealth than blacks. In addition, although white first-time homeowners may be using FHA-insured loans, the blacks using FHA-insured loans may not be first-time homeowners. The negative effect of FHA on homeownership in distressed neighborhoods might be explained by the mobility of households out of these neighborhoods when they become homeowners.
The results presented here should be interpreted with caution for several rea-sons. First of all, in the estimations, the individual characteristics of households are not controlled for because of the unavailability of data. For example, the positive and significant impact of the FHA in high-income census tracts could be explained by the usage of FHA loans by high default risk or very low-income households in these neighborhoods. Second, the homeownership rate is taken at one specific point in time, but the mortgage activity is a marginal activity during 1990. Third, the analysis with U.S. Census data does not permit the examination
FHA MORTGAGE INSURANCE ACTIVITY 173 of homeownership and mortgage activity of low- and moderate-income house-holds who have been targeted by the FHA. Fourth, it can be argued that small mortgage bankers’ mortgage activity is underrepresented in the analysis because they were not required to report their mortgage activity according to HMDA in 1990. However, the comparison of 1990 and 1992 HMDA datasets suggest that this underrepresentation may be in the conventional market, not in the FHA market. This comparison reveals that the market shares of mortgage bankers were 31.5 and 46.4% in conventional loans and 74.3 and 73.8% in FHA loans in 1990 and 1992, respectively. Fifth, even though the 1990 HMDA dataset is used to match with 1990 U.S. Census data, this year may not be a representative year for FHA activity because the U.S. was in recession over half of the year. It is known that the share of FHA in mortgage originations increases when the economy is in a recessionary period. In 1990, the FHA mortgage market share was 13.2% whereas the average share of the FHA was 9.2% during the 1990s. It may have extended credit more to current owners then first-time homeowners, resulting in low impact of FHA activity on homeownership. Hence, the use of the 1990 HMDA dataset might explain why no significant impact of the FHA was observed in low-income areas.
In the future, an analysis could consider not only marginal borrowers but marginal owners as well. Additionally, since the FHA aims to serve the low-and moderate-income households, the analysis could examine the effect of FHA-insured mortgage activity on the homeownership rate of these households when the data become available. Finally, it will be more informative to include individ-ual characteristics and easier to explain why FHA activity has a positive and significant impact on high-income neighborhoods and MSAs when individual level data become available. Unfortunately, there is currently no data set for the entire U.S. that includes individual characteristics that may affect both tenure and mortgage choices.
APPENDIX TABLE A1
Descriptive Statistics of the Variables Used in the Census Tract Level Analysis (N⫽ 39,124)
Variables Mean Standard deviation
Homeownership rate 0.60693 0.23620
FHA-insured mortgage activity 0.30903 0.20353 Demographic characteristics of census tracts:
Distribution based on minority share, 1990
0.00–0.10 0.41095 0.49201
0.10–0.25 0.21820 0.41303
0.25–0.50 0.14267 0.34975
TABLE A1—Continued
Variables Mean Standard deviation
Distribution based on change in minority share, 1980–1990
0.00–0.05 0.49931 0.50001
0.05–0.10 0.15574 0.36261
0.10–0.15 0.08680 0.28155
0.15– 0.11277 0.31632
Change in population, 1980–1990 0.11619 0.74189 Distribution based on population, 1990
Less than 1,000 0.03144 0.17450
Between 1,000 and 10,000 0.90599 0.29184
Between 10,000 and 50,000 0.06216 0.24145
More than 50,000 0.00041 0.02022
Average household size 2.65251 0.46214 Age of household head, 1990
Share of household heads aged 25–34 0.14378 0.06280 Share of household heads aged 35–44 0.21918 0.06468 Share of household heads aged 45–54 0.18065 0.04992 Share of household heads aged 55–64 0.17348 0.04488 Share of household heads aged 65–74 0.16054 0.05954 Share of household heads aged 75 or more 0.10808 0.06514 Economic characteristics of census tracts:
Distribution based on median family income
Less than 50% of MSA Median Income 0.07716 0.26686
Between 50 and 80% 0.19850 0.39887
Between 80 and 100% 0.22633 0.41846
Between 100 and 120% 0.22439 0.41718
More than 120% 0.27361 0.44582
Median family income, 1990 $37,852 $17,561 Distribution based on change in median family
income, 1980–1990
Less than or equal to 0% 0.04504 0.20739
Between 0.00 and 0.25% 0.14664 0.35375
Between 0.25 and 0.50% 0.55559 0.49691
Between 0.50 and 1.00% 0.23852 0.42619
Housing characteristics of census tracts: Distribution of housing units, 1990
Share of structures, 1 unit attached 0.06381 0.11422 Share of structures, 2 units 0.06861 0.09640 Share of structures, 3–4 units 0.06093 0.07805 Share of structures, 5 or more units 0.19213 0.21996 Share of structures, mobile units 0.05114 0.09019 Lender market characteristics of census tracts:
Herfindhal index 0.19703 0.18012
Ratio of mortgage bankers to depository institutions 0.42911 0.20349
Central cities 0.52224 0.49951
FHA MORTGAGE INSURANCE ACTIVITY 175 TABLE A2
Descriptive Statistics of Variables Used in the Estimation of the MSA Level Analysis (Number of MSAs⫽ 335)
Overall White Black
Standard Standard Standard
Variable Mean deviation Mean deviation Mean deviation FHA origination rate 0.30903 0.20353 0.29330 0.19969 0.48503 0.27152 Homeownership rate 0.65114 0.06482 0.68396 0.06170 0.40287 0.09881 Demographic characteristics of MSAs:
Minority percentage in 1990 0.19418 0.15161 0.19418 0.15161 0.19418 0.15161 Percentage change in 0.02668 0.02752 0.02668 0.02752 0.02668 0.02752
minority population 1980–1990
Average household size 2.62167 0.18270 2.62167 0.18270 2.62167 0.18270 Growth in population 0.11258 0.14560 0.11258 0.14560 0.11258 0.14560 Percentage of young 0.38427 0.05518 0.34903 0.23997 0.37587 0.07081
households (18–34)
Distribution of MSAs based on population
Less than 150,000 0.28358 0.45141 0.28358 0.45141 0.28358 0.45141 150,000–500,000 0.42229 0.49465 0.42229 0.49465 0.42229 0.49465 More than 500,000 0.26393 0.44141 0.26393 0.44141 0.26393 0.44141 Distribution based on minority population, 1990
Between 0.10 and 0.25 0.38710 0.48780 0.38710 0.48780 0.38710 0.48780 Between 0.25 and 0.50 0.23754 0.42620 0.23754 0.42620 0.23754 0.42620 More than 0.50 0.03519 0.18453 0.03519 0.18453 0.03519 0.18453 Economic characteristics of MSAs:
Median family income $33,499 $7,682 $31,618 $6,580 $19,779 $6,120 Percentage change in median 0.71022 0.22018 0.71022 0.22018 0.71022 0.22018
family income, 1980–1990
Households with income less 0.77273 0.08560 0.75504 0.09131 0.87963 0.07145 than $50,000
Unemployment rate in 1990 5.59099 2.01719 5.59099 2.01719 5.59099 2.01719 Distribution based on relative income, 1990
80% less than national 0.28446 0.45182 0.28446 0.45182 0.28446 0.45182 income
Between 80 and 100 % 0.41642 0.49369 0.41642 0.49369 0.41642 0.49369 Between 100 and 120% 0.19062 0.39336 0.19062 0.39336 0.19062 0.39336 More than 120% 0.10850 0.31147 0.10850 0.31147 0.10850 0.31147 Lender market characteristics of MSAs
Herfindahl index, 1990 0.01533 0.30965 0.01533 0.30965 0.01533 0.30965 Mortgage banker to 0.40207 0.11803 0.40207 0.11803 0.40207 0.11803 depository institution ratio Census regions Northeast 0.20597 0.40501 0.20597 0.40501 0.20597 0.40501 Midwest 0.25373 0.43579 0.25373 0.43579 0.25373 0.43579 South 0.18806 0.39134 0.18806 0.39134 0.18806 0.39134 West 0.35223 0.47838 0.35223 0.47838 0.35223 0.47838 Source. Author’s calculations based on 1980, 1990 U.S. Census and 1990 HMDA datasets.
TABLE A3
Census Tract Level Estimation for All Households Model: OWNn⫽0⫹
兺
M
m⫽1␦m MSAmn ⫹ 1FHAn ⫹ 2 INCOMEn ⫹ 3
DEMOGRAPHICn⫹ 4HOUSINGn⫹ 5LENDER MARKETn⫹ n.
Model I Model II Model III overall minority share relative income
Para- Para-
Para-meter t- meter t- meter
t-estimate Statistic estimate Statistic estimate Statistic
Intercept 1.03 4.97 1.04 5.04 1.03 5.00
FHA Activity 2.16 9.24 0.84 2.66 2.38 6.35
FHA activity interacted with relative income groups
Income less than 50% ⫺2.23 ⫺4.16
Income between 50 and 80% ⫺0.13 ⫺0.80
Income between 80 and 100% 0.23 0.29
Income between 100 and 0.16 0.26
120%
FHA activity interacted with minority share groups
Minority population less 0.04 ⫺0.43
than 10%
Minority population between 0.89 0.94 10 and 25%
Minority population more 3.16 7.96
than 50%
Dummy variables for minority population
Minority population between ⫺1.90 ⫺17.69 ⫺1.90 ⫺12.90 ⫺1.91 ⫺17.78 10 and 25%
Minority population between ⫺2.62 ⫺17.91 ⫺2.92 ⫺14.72 ⫺2.62 ⫺17.86 25 and 50%
Minority population more ⫺1.89 ⫺10.56 ⫺2.98 ⫺13.71 ⫺1.90 ⫺10.54 than 50%
Dummy variables for change in minority population 1980–1990 Base group: negative or no change
Change between 0.00 and ⫺0.91 ⫺8.02 ⫺0.89 ⫺7.79 ⫺0.93 ⫺8.19 0.05%
Change between 0.05 and ⫺1.22 ⫺8.64 ⫺1.16 ⫺8.21 ⫺1.23 ⫺8.80 0.10%
Change between 0.10 and ⫺1.14 ⫺6.85 ⫺1.08 ⫺6.35 ⫺1.16 ⫺7.00 0.25%
FHA MORTGAGE INSURANCE ACTIVITY 177 TABLE A3—Continued
Model I Model II Model III overall minority share relative income
Para- Para-
Para-meter t- meter t- meter
t-estimate Statistic estimate Statistic estimate Statistic Dummy variables for relative income groups
Base group: more than 120%
Less than 50% ⫺2.23 ⫺5.48 ⫺2.10 ⫺5.13 ⫺1.54 ⫺3.36 Between 50 and 80% ⫺2.74 ⫺10.87 ⫺2.74 ⫺10.88 ⫺2.64 ⫺9.00 Between 80 and 100 % ⫺1.04 ⫺6.22 ⫺1.05 ⫺6.35 ⫺1.08 ⫺5.21 Between 100 and 120 % ⫺0.03 ⫺2.75 ⫺0.35 ⫺3.00 ⫺0.36 ⫺2.17 Median family income and splines
Median family income 1.11 27.28 1.13 27.27 1.09 26.05 Income spline at $20,000 ⫺0.45 ⫺10.93 ⫺0.47 ⫺11.34 ⫺0.42 ⫺9.95 Income spline at $40,000 ⫺0.28 ⫺18.87 ⫺0.30 ⫺19.67 ⫺0.29 ⫺18.93 Income spline at $60,000 ⫺0.27 ⫺13.79 ⫺0.26 ⫺13.21 ⫺0.27 ⫺14.05 Income spline at $80,000 ⫺0.05 ⫺1.26 ⫺0.04 ⫺1.26 ⫺0.04 ⫺1.20 Income spline at $100,000 0.04 0.88 0.04 0.90 0.04 0.88 Dummy variables for change in median family income, 1980–1990
Base group: less than 0.00 Change in income between
0.00 and 0.25 ⫺1.93 ⫺9.02 ⫺1.85 ⫺8.69 ⫺1.98 ⫺9.27 Change in income between
0.25 and 0.50 ⫺3.65 ⫺16.51 ⫺3.57 ⫺16.15 ⫺3.70 ⫺16.78 Change in income more than
0.50 ⫺5.62 ⫺22.84 ⫺5.57 ⫺22.62 ⫺5.66 ⫺23.02
Change in population,
1980–1990 0.10 3.82 0.10 3.86 0.10 3.82
Dummy variables for population, 1990 Base group: less than 1,000 Population between 1,000
and 10,000 0.95 1.67 0.87 1.51 0.97 1.71
Population between 25,000
and 50,000 1.84 3.26 1.75 3.10 0.19 3.30
Population more than 50,000 1.98 2.72 1.82 2.49 0.20 2.78 House usage variables, 1990
Share of structures 1 unit
attached ⫺0.10 ⫺25.33 ⫺0.10 ⫺25.43 ⫺0.10 ⫺25.14 Share of structures 2 units ⫺0.57 ⫺96.27 ⫺0.58 ⫺96.55 ⫺0.57 ⫺95.82 Share of structures 3–4 units ⫺0.67 ⫺103.77 ⫺0.67 ⫺103.36 ⫺0.67 ⫺103.61 Share of structures 5 or
more units ⫺0.66 ⫺238.26 ⫺0.66 ⫺237.91 ⫺0.66 ⫺238.32 Share of structures mobile homes 0.15 31.67 0.14 30.91 0.15 31.95 Average household size 0.03 18.77 0.03 19.65 0.03 18.43
TABLE A3—Continued
Model I Model II Model III overall minority share relative income
Para- Para-
Para-meter t- meter t- meter
t-estimate Statistic estimate Statistic estimate Statistic Age of household head, 1990
Share of household heads
aged 15–24 ⫺1.06 ⫺5.15 ⫺1.09 ⫺5.27 ⫺1.07 ⫺5.18
Share of household heads
aged 25–34 ⫺0.60 ⫺2.90 ⫺0.61 ⫺2.96 ⫺0.61 ⫺2.94 Share of household heads
aged 35–44 ⫺0.72 ⫺3.49 ⫺0.75 ⫺3.64 ⫺0.73 ⫺3.52 Share of household heads
aged 45–54 ⫺0.66 ⫺3.19 ⫺0.68 ⫺3.29 ⫺0.67 ⫺3.22 Share of household heads
aged 55–64 ⫺0.72 ⫺3.46 ⫺0.74 ⫺3.57 ⫺0.72 ⫺3.48 Share of household heads
aged 65–74 ⫺0.45 ⫺2.18 ⫺0.47 ⫺2.29 ⫺0.46 ⫺2.21 Share of household heads aged
75 or more ⫺0.47 ⫺2.30 ⫺0.50 ⫺2.41 ⫺0.48 ⫺2.32 Central city (dummy variable) 0.07 1.01 0.10 1.36 0.06 0.82 Lender market characteristics
Herfindhal index ⫺3.34 ⫺11.46 ⫺3.34 ⫺11.46 ⫺3.36 ⫺11.49 Mortgage bankers-to-depository
institutions ratio ⫺0.20 ⫺0.72 ⫺0.24 ⫺0.91 ⫺0.18 ⫺0.63 Memo items:
R2 0.92 0.92 0.92
Dependent variable mean 0.62 0.62 0.62
Note. All of the variables except intercept, house usage, and age of household head variables are multiplied by 100.
FHA MORTGAGE INSURANCE ACTIVITY 179 TABLE A4
MSA Level Estimation for All Households Controlling for Census Tract Characteristics
StepII. OWNm⫽␥0⫹␥1FHAm⫹␥2INCOMEm⫹␥3DEMOGRAPHICm⫹
␥4LENDERm⫹ m.
Model I Model II Model III
overall minority share relative income Parameter t- Parameter t- Parameter
t-estimate Statistic estimate Statistic estimate Statistic
Intercept 0.35 2.76 0.36 2.83 0.17 2.83
FHA activity 3.43 2.53 9.27 4.10 7.65 2.20
Interaction variables with FHA activity Minority share
0.10–0.25 ⫺8.05 ⫺2.91
0.25–0.50 ⫺10.02 ⫺3.35
0.50–1.00 ⫺9.09 ⫺2.32
Relative income level
Less than 80% ⫺6.52 ⫺1.55
Between 80 and 100% ⫺4.65 ⫺1.25
Between 100 and 120% ⫺2.56 ⫺0.69
Economic characteristics Median family income,
1990 ⫺0.18 ⫺1.41 ⫺0.17 ⫺1.34
Growth in median family
income, 1980–1990 2.91 1.77 1.45 0.90 2.55 1.64
Share of households with income less than
$50,000 3.32 0.33 3.91 0.12 3.39 2.90
Dummy variables for relative income Base group: greater
than 120% Less than 80% ⫺4.20 ⫺2.54 ⫺3.69 ⫺2.18 ⫺1.72 ⫺0.90 Between 80 and 100% ⫺3.40 ⫺2.75 ⫺3.03 ⫺2.37 ⫺2.07 ⫺1.51 Between 100 and 120% ⫺1.04 ⫺1.20 ⫺0.85 ⫺0.95 ⫺0.55 ⫺0.55 Unemployment rate ⫺0.11 ⫺0.75 ⫺0.05 ⫺0.38 ⫺0.10 ⫺0.74 Demographic characteristics Growth in population, 1980–1990 3.32 2.07 3.91 2.50 3.39 2.13 Change in minority Share, 1980–1990 11.74 1.53 14.72 1.86 Percentage of young population (age less
than 35) ⫺42.01 ⫺8.63 9.27 ⫺8.11 7.65 ⫺8.58