T.C.
ISTANBUL AYDIN UNIVERSITY INSUSTITE OF GRADUTE STUDIES
OPTIMAL DESIGN OF A ROOFTOP WIND-PV HYBRID SYSTEM TO MEET ENERGY DEMAND FOR A TYPICAL RESIDENTIAL HOME
MASTER SCIENCE THESIS Aussama ALKHESHA
Department of Electrical and Electronics Engineering Electrical and Electronics Engineering Program
T.C.
ISTANBUL AYDIN UNIVERSITY INSUSTITE OF GRADUTE STUDIES
OPTIMAL DESIGN OF A ROOFTOP WIND-PV HYBRID SYSTEM TO MEET ENERGY DEMAND FOR A TYPICAL RESIDENTIAL HOME
MASTER SCIENCE THESIS Aussama ALKHESHA
(Y1613.300016)
Department of Electrical and Electronics Engineering Electrical and Electronics Engineering Program
Thesis Advisor: Prof. Dr. Nedim TUTKUN
DEDICATION
I hereby declare with respect that the study, which I submitted as a Master thesis in this document, has been obtained and presented in accordance with academic rules and ethical conduct, and I referenced the works and material that I have benefited.
FOREWORD
After thanks to Allah our creator, I would like to thank my mother and my father who raised me to become a good person. My family, my wife and two daughters, thank you very much. My wife, thank you very much for your support in my life and during my master’s period. I am truly thankful for having you in my life. I hope I can make you happy and return even some of what you gave.
I would like to thank my thesis advisor Dr. Nedim TUTKUN for his guidance, support, and help during my work in the thesis. I thank him for everything I learned from him.
I thank all my teachers starting from my school time until today as they had great influence on me and made me love education and I hope I can become one day a good teacher as they were.
OPTIMAL DESIGN OF A ROOFTOP WIND-PV HYBRID
SYSTEM TO MEET ENERGY DEMAND FOR A TYPICAL
RESIDENTIAL HOME
ABSTRACT
Energy price gradually increases all over the world every year due to population and economic growths. The primary sources of electricity are usually fossil fuels and major part of them is imported. It is a typical indication of the foreign energy dependency although many countries in the world have renewable energy potential. This potential can be seized on using on-grid or off-grid renewable systems in particular wind-PV systems ranging from power ratings of 1 to 10 kW in remote areas.
To make such systems economic, power balance between generation and consumption should be maintained at hourly time slots in the day.
One way to do that is to solve a discrete optimization problem and the solution can be achieved by a mathematical model satisfying the given constraints in a certain location. Unit sizing of a low power off-grid renewable system to meet power demand for a typical residential home in a location is achieved, in the design process the genetics algorithm is encoded in MATLAB environment for simplicity and robustness, and the outcomes are meaningful and encouraging for widening renewable energy applications worldwide.
Keywords: Rooftop wind-PV hybrid system, Optimal design, Metaheuristic techniques, Renewable energy applications.
TIPIK BIR KONUTUN ENERJI TALEBINI KARŞILAMAK
İÇIN ÇATI-ÜSTÜ RÜZGAR VE FV HIBRIT SISTEMININ
OPTIMAL TASARIMI
ÖZET
Enerji fiyatı, her yıl nüfus ve ekonomik büyümeler nedeniyle tüm dünyada giderek artmaktadır. Birincil elektrik kaynakları genellikle fosil yakıtlardır ve bunların büyük bir kısmı ithal edilmektedir. Dünyadaki birçok ülkenin yenilenebilir enerji potansiyeline sahip olmasına rağmen, yabancı enerji bağımlılığının tipik bir göstergesidir. Bu potansiyel, şebeke içi veya şebeke dışı yenilenebilir sistemler, özellikle uzak bölgelerde 1 ila 10 kW güç sınıfları arasında değişen rüzgar-FV sistemleri kullanılarak ele alınabilir.
Bu sistemleri ekonomik hale getirmek için, üretim ve tüketim arasındaki güç dengesi günün saatlik zaman aralıklarında tutulmalıdır.
Bunu yapmanın bir yolu, ayrı bir optimizasyon problemini çözmektir ve çözüm, belirli bir konumda verilen kısıtlamaları karşılayan bir matematiksel model ile elde edilebilir. Bir lokasyonda tipik bir konut için güç talebini karşılamak için düşük güçlü bir şebekeden bağımsız yenilenebilir sistemin birim boyutlandırması elde edilir, tasarım sürecinde genetik algoritma basitlik ve sağlamlık için MATLAB ortamında kodlanır ve sonuçlar anlamlı ve cesaret vericidir. dünya çapında yenilenebilir enerji uygulamalarını genişletmek için.
Anahtar Kelimeler: Çatı üstü rüzgar-FV hibrid sistemi, Optimal tasarım, Meta-sezgisel teknikler, Yenilenebilir enerji uygulamaları.
TABLE OF CONTENT
FOREWORD ... iv
ABSTRACT ... v
ÖZET ... vi
TABLE OF CONTENT ... vii
LIST OF FIGURES ... ix
LIST OF TABLES ... xii
I. INTRODUCTION ... 1
A. Overview ... 1
B. Literature Review ... 3
C. Purpose of the Thesis ... 9
II. SYSTEM ARCHITECTURE AND DESCRIPTION ... 10
A. Introduction ... 10
B. Wind Turbine ... 12
1. Power Generation from Wind Energy... 12
2. Wind turbine elements ... 13
3. Wind Turbine modeling ... 16
C. Photovoltaic ... 17
1. Electricity generation from Photovoltaic ... 17
2. Photovoltaic cell ... 17
3. PV Module ... 18
4. PV Arrays ... 20
D. Battery Bank ... 23
1. Battery Bank Modelling ... 23
E. Load profile ... 24
1. Uncontrollable load. ... 24
2. Controllable load. ... 24
III. PROBLM FORMULATION AND SYSTEM OPTIMIZATION ... 26
A. Introduction ... 26
B. Construction of Objective Function ... 27
C. Binary-Coded Genetic Algorithms ... 31
D. Methodology ... 33
IV. RESULTS ... 37
A. Unplanted Load Status ... 40
1. Pure PV System ... 40
2. Wind turbine only System ... 43
3. WIND-PV System ... 45
B. PLANNED LOAD STATUS ... 48
1. Pure PV System ... 49
2. Wind turbine pure System ... 51
3. WIND-PV System ... 53
C. Controlled and Uncontrolled Load Status ... 56
D. Performance Analysis of Genetic Algorithms ... 58
E. Analysis of Individual Loads ... 59
V. CONCLUSION AND FUTURE WORKS ... 61
VI. REFERENCES ... 63
LIST OF FIGURES
Figure 1 Hybrid System Block Diagram ... 11
Figure 2 Structure of rooftop wind turbine [31] ... 13
Figure 3 Structure of rooftop wind turbine ... 15
Figure 4 Basic Operation of PV Cell [32] ... 18
Figure 5 Single Equivalent Circuit Model of PV Cell ... 18
Figure 6 PV module Connected Series ... 19
Figure 7 Characteristics of PV Module ... 20
Figure 8 PV Arrays General Shape ... 21
Figure 9 PV System General Layout ... 22
Figure 10 Load Profile for Typical Residential Home Load ... 25
Figure 11: General Optimization process Diagram ... 26
Figure 12 Genetic Algorithm Flowchart ... 33
Figure 13 Hourly Change of 3-Year Average Wind Speed ... 34
Figure 14 Hourly Change of 3-Year Average Radiation Level ... 35
Figure 15 proposed optimization methodology Flowchart ... 36
Figure 16 Load Profile ... 37
Figure 17 Variation of Power Generated at Different Wing Lengths ... 38
Figure 18 Daily Power Change of PV Panel ... 39
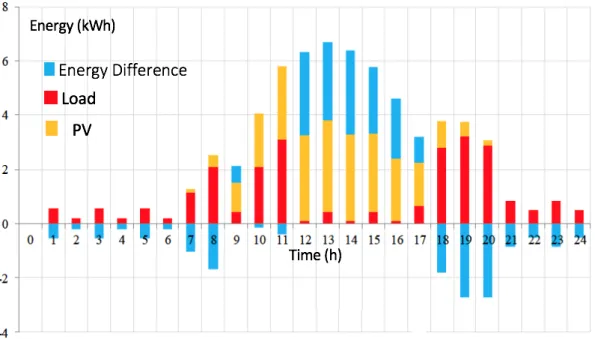
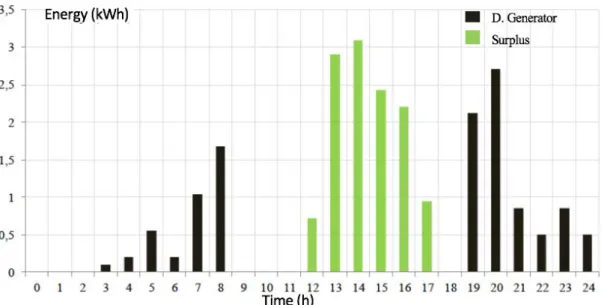
Figure 19 Daily basis of total power generation and consumption in the optimally designed PV system ... 41
Figure 20 Daily Change of Battery Charge and Discharge Status in Pure PV System ... 42
Figure 21 Time slots of a diesel generator use in the optimally designed PV system43 Figure 22 Daily Change of Energy Produced and Demanded with 2 pieces 1 kW
wind turbine ... 44 Figure 23 Daily Change of Battery Charge and Discharge Status in 2 pieces 1kW
Wind Turbine Powered System ... 44 Figure 24 Daily Change of Energy Generated by Extra and Diesel Generators in Pure
Wind Turbine System ... 45 Figure 25 Daily Variation of Generated, Demanded and Difference Energy Amounts in Wind-PV Hybrid System ... 46 Figure 26 Daily Change of Battery Charge and Discharge Status in WIND-PV
Hybrid System ... 47 Figure 27 Daily Change in Excess and Diesel Generators Produced in Wind-PV
Hybrid System ... 48 Figure 28 Daily Variation of Produced, Demanded and Difference Energy Quantities
According to the Load Distributed State in Optimally Distributed PV System ... 50 Figure 29 Daily Change of Battery Charge and Discharge Status in Optimally
Distributed Load Status in Pure PV System ... 50 Figure 30 Surplus Based on Optimally Distributed Load Status in Pure PV System
and Diesel Generator Produced By Daily Exchange ... 50 Figure 31 Daily Change of the Energy Difference Produced and Demanded
According to the Load Distributed in the Optimally Distributed Load Condition in 2 Piece 1 kW wind turbine System... 52 Figure 32 Daily Change of Battery Charge and Discharge Status According to the
Load Distribution in the Most Optimally Distributed State in 2 pcs 1 kW wind turbine System ... 52 Figure 33 Daily Change of Energy Produced by 2 pieces of 1 kW wind turbine and
Diesel Generators according to the most appropriately distributed load status ... 53
Figure 34 Daily Change of Energy and Energy Difference Produced and Demanded According to the Optimally Distributed Load Condition in 9 PV Panels and 1 kW wind turbine System... 53 Figure 35 Daily Change of Battery Charge and Discharge Status According to
Optimally Distributed Load Status in 9 PV Panels and 1 kW wind turbine System ... 54 Figure 36: Daily Change of Energy Generated by Extra Diesel Generators and 9 PV
Panels and 1 kW wind turbine System According to the Load Distribution ... 54 Figure 37 Daily Change of Energy Consumption of Controlled and Uncontrolled
Loads in Planned-Unplanned Load Distribution in Pure PV System ... 56 Figure 38 Daily Change of Energy Consumption of Controlled and Uncontrolled
Loads in Planned-Unplanned Load Distribution in Pure wind turbine System ... 57 Figure 39 Daily Change of Energy Consumption of Controlled and Uncontrolled
Loads in Planned-Unplanned Load Distribution in Wind-PV System ... 57 Figure 40 Variation of Maximum Conformity Value with Generation to Obtain
Planned Load Distribution ... 58 Figure 41 Variation of Convergence Error with Generation to Obtain Planned Load
Distribution ... 59 Figure 42 Unplanned and planned determination of working hours of the dishwasher during the day ... 60 Figure 43: Unplanned and planned determination of working hours of washing
LIST OF TABLES
Table 1 System Components Costs and Ratings ... 12
Table 2 Wind Turbine Parameters Rating Values... 14
Table 3 PV Parameters Rating Values ... 22
Table 4 Typical Residential Loads and Operation Hours ... 25
Table 5 Hybrid System Component’s Ratings and Costs with Backup Generator .... 40
Table 6 Unplanned Load Distribution ... 48
Table 7 Planned Load Distribution with Pure PV System ... 55
Table 8 Planned Load Distribution with pure wind turbine system ... 55
I. INTRODUCTION
A. Overview
Energy is a key issue in the social and socio-economic development of a society. The energy parameter is at the top of the country's development indicators. Especially in developing countries like our country, the demand for energy is increasing. This has increased interest in renewable energy sources. Although renewable energy has advantages, renewable energy sources have significant disadvantages, such as production discontinuity due to weather conditions. Therefore, hybrid systems are used consisting of different renewable energy sources, such as wind, photovoltaic and hydraulic (Lu, Zeng, et all. 2013).
The traditional optimization techniques available for electrical power systems to size the hybrid system are linear programming, dynamic programming and analytical methods. Furthermore, evolutionary techniques such as genetic algorithms, simulated annealing and flock flux optimization have been applied to design the hybrid system. Growing concerns about global warming have urged interest in reducing greenhouse gas emissions, including those emitted during electricity generation from conventional sources such as coal, oil and natural gas etc. In addition, energy security concerns have prompted nations to look for sustainable energy sources to replace fossil fuels that are running out. Renewable energy sources (RES) like wind power and solar power offer sustainable and ecological alternatives for energy production. However, some technical and economic challenges must be resolved before these sources can replace current power generation resources. First of all, these RES are intermittent, unpredictable and uncontrollable, which means that they cannot be used exclusively to meet load demand reliably. Furthermore, renewable energy generation technologies are generally more expensive than conventional generators of comparable size, especially if used together with energy storage devices to improve their reliability. As a result, they cannot supply energy at a competitive price. Finally, its distributed nature and its dependence on location cause
difficulties with respect to its integration into the centralized architecture of power generation and contemporary delivery systems.
The energy generation system with renewable energy sources can be built by a single system (photovoltaic only, only wind) or a hybrid system with other sources or generators of renewable energy (photovoltaic / wind, photovoltaic / diesel). Furthermore, these systems can be connected to the network or be independent of the network. Despite the unpredictable nature of resources in the independent renewable energy generation systems of the network, it is important for the continuity of the power generation system designed as a hybrid due to its variable spacing and intermittent nature. The most used systems are solar and wind energy systems due to their modularity. The integration of various types of conventional and / or renewable energy generation technologies into a single energy system, with the possibility of integrating them with energy storage devices, can be a viable solution to some of these challenges. In particular, exploiting the difference in seasonal and daily supply profiles of some types of RES as wind and solar to complement each other can significantly improve reliability and reduce the cost of energy for such systems. This type of integrated system is generally known as hybrid power systems. The energy conversion technologies that are generally used in them include: photovoltaic, wind turbines, micro-hydroelectric and combined heat and power units. Furthermore, energy storage technologies on a network scale are rapidly improving and could soon become an integral part of any hybrid energy system to address the intermittency problem and drive the integration of distributed generation powered by renewable energy sources in energy systems (Tutkun, Ungören, & Alpagut, 2017).
The generation of energy through standalone renewable energy systems is more expensive than the energy generation systems with fossil fuels. It is therefore important to optimally design such systems in many aspects, such as low cost operation and maintenance, optimal size and location. Recently few researchers have been using meta-heuristic algorithms to accomplish these goals by solving complex problems derived from system modeling in design process and preliminary outcomes of using these techniques exhibit better performance compared to other deterministic techniques. In order to design a wind-PV hybrid system to meet energy demand for a typical residential home, deterministic optimization techniques such as linear
However, in some cases the objective function obtained from modeling may be complex due to linear and nonlinear constraints so that they are mostly incapable of solving it. Thus metaheuristic techniques such as the simulated annealing, particle swarm optimization, the shuffled frog-leaping algorithm, gravitational search optimization etc. can be one option to solve for optimal values. Few investigations on this problem are discussed as follows (Tutkun, 2019).
B. Literature Review
Tutkun et al presented a micro-hybrid energy system with low power wind turbines, several photovoltaic panels, a few storage batteries and controllable and uncontrollable electrical loads to generate low-cost electricity in residential homes or similar places. The operation cost of this system was reduced to an acceptable amount of cost for a fair competition with grid cost. The Shuffled Frog-Leaping Algorithm (SFLA) software was designed to find the minimum daily operating cost for wind-PV hybrid system installed in the residential house. With a time interval of one hour, the operation cost of the unscheduled load profile was ₺ 8.12 per day. The designed software was used to optimally program the energy demand to minimize operating costs. Once the optimization process was completed, the operating cost was reduced to ₺ 7.07 for one day, to be precise, the operation cost was improved by around 13% (Tutkun, Can, & San, 2015).
Jaszczur et al, presented a hybrid system for renewable energies for residential use that is based on two different optimization criteria. The system presented uses photovoltaic modules, wind generators and batteries as energy stores. The analyzes were carried out on the basis of experimental measurements regarding electrical charge, local solar radiation, wind speed and other environmental parameters. The optimization process was carried out from two economic and ecological points of view, whereby the optimization process showed that low wind energy affects the system, while photovoltaic modules show better alternatives, whereby this study focused more on the environmental aspect, which eliminated the idea of a diesel generator and there were no effective ones Mechanisms to control daily loads (Jaszczur, Hassan & Palej, 2019).
Antonio et al, carried out a high-resolution analysis with which a hybrid bank of batteries for photovoltaic wind turbines can be dimensioned. The analysis aims to minimize the annual cost of the systems by meeting two reliability constraints. The solution was obtained numerically using an iterative technique. The decision variables are the photovoltaic area, the wind generator radius and the battery capacity. Based on the fuzzy logic inference system, a high-resolution model was developed to evaluate the number of active residents and the electricity consumption in the household. To enable a more precise dimensioning of the system, a new reliability parameter called seasonal load loss index was defined, which takes into account the seasonality of the data. In the iterative process, in addition to the most common probability of a load loss, the probability ratio of a seasonal load loss was used. In comparison to conventional methods, the results obtained show that the introduction of the new parameter into the iterative process results in a significant improvement in the reliability of the system and a slight increase in its costs. In my view, the study was almost complete. since it was important to analyze the stresses in two hot and cold seasons and in the cold season there is a possibility of energy loss (Giallanza, Porretto, Puma & Marannano, 2018).
Hemeida et al, wanted to present a realistic solution for the energy requirements in Makadi Bay, Red Sea, Hurghada, Egypt, of the battery storage (BE S). TORSCHE's linear optimization technology was used to achieve an optimal solution for the proposed renewable cross-energy system. The optimal size of the hybrid renewable energy system was examined based on the actual weather and load data collected. The individual configuration of PVS and WES in the presence of BES was examined and compared with the PV / WT hybrid. In addition, the economic analysis was presented to show the best economic system. The final results that obtained showed that the installation of this hybrid system consisting of WES, PVS and BES is cheaper than the individual installation. In my opinion, the study was based on a comparison of the feasibility of setting up a hybrid system on the one hand or creating separate systems on the other, which can be evident in many cases, particularly in the regions of the Mediterranean (Hemeida, El-Ahmar, et all. 2019). Nurunnabi et al presented a feasibility and sensitivity analysis of microgrids connected to the network and outside the network based on renewable energies and
network algorithm was used to track wind speed and solar radiation in two prominent regions throughout the year, and promising results were analyzed to decide whether the data is reliable for the forecast or not. Four different model types, including PV-Grid, Wind-PV-Grid, Wind-PV-Grid and hybrid renewable energy sources outside the network, are developed using HOMER Pro software (Hybrid Optimization of Multiple Energy Resources). Consideration of the key factors: net electricity costs, energy costs, share of renewable energies, local load demand, availability of renewable energy sources, system economics and greenhouse gas emissions, optimal hybrid system for renewable energies (HRES), lot. The results showed that the optimal solutions are significantly influenced by the uncertainty of the key variables , for the fixed configuration of the system, e.g. the wind PV grid system, a sensitivity analysis with six uncertain input variables (such as the nominal discount rate, the price of the network energy, the runtime of the wind turbine) is carried out, the average wind speed, the solar radiation and the average electrical charge show how sensitive the current total net costs are to each type of uncertain variable. The final results of analysis showed the total net costs are more sensitive to the nominal discount rate and average wind speed than the other four variables. I think information can help a system designer prioritize efforts to reduce wind speed. Uncertainty the results also show that the optimal configuration and size of the system vary significantly with the reduction of the nominal discount rate by 1% (Nurunnabi, Hossain & Pota, 2019).
Moghaddam et al, they presented the design of an optimal hybrid photovoltaic / wind / battery energy system for the load requirement, taking into account the actual data on annual solar radiation and wind speed in Zanjan, Iran. The optimal capacity of the hybrid system component is determined to minimize the NPCS of current net costs and improve the likelihood of hourly blackouts from the Reliability Index Deficit using the new improved crow search algorithm (ICSA). The optimal capacity of the hybrid system components is shown in different combinations and in different amounts of the DPHIP restriction. The simulation results showed that the PV / Batt hybrid system is cheaper and more reliable for the city of Zanjan compared to the other combination in terms of NPCS and DPHIP. The results also showed that the construction costs of the WT / Batt system are higher for Zanjan than for the other combinations, and it is not cheap that one of the important reasons is the weak wind
potential in the city of Zanjan and the dependency of this combination on the Way to the high-bay warehouse for freight delivery. In addition, when designing the hybrid system according to the ICSA method, the impact of important technical factors is assessed, including changes in the efficiency of the inverter and the investment costs of the storage system and changes in the load. The results showed that higher inverter efficiency lowers NPCS and improves reliability, so increasing the cost of storage investments increases NPCS and degrades reliability. NPCS also increase with increasing demand (Moghaddam, Bigdeli, et all. 2019).
Madziga et al, wanted to present an optimal hybrid energy system to reliably and sustainably cover the electricity needs of a remote village without a grid connection, Gwakwani, South Africa. Three off-grid systems have been proposed: (i) photovoltaic systems with a diesel generator; (ii) photovoltaic systems and battery storage; and (iii) photovoltaic systems with a diesel generator and battery storage. based on three main goals: (i) meeting energy needs; (ii) system costs; and (iii) pollution based on three main objectives: (i) meeting energy needs; (ii) system costs; and (iii) the contamination for this analysis was tested different sizes of photovoltaic panels and the optimal size selected in each scenario. A general comparison was made between the two optimal systems when using the diesel generator and when using the battery. Both scenarios are able to meet the demand adequately without any significant interruption, but there are differences in costs and technical optimization. The result is: The three scenarios of the model system can be used for electrification and for combining the energy requirements at a considerable price. However, the optimal solution guarantees a more reliable system in terms of costs, as shown in scenario (1). The cost of adopting scenario (3) is not economical for a small village. In my opinion, the study did not show a final solution, just a general comparison of all options (Madziga, Rahil & Mansoor, 2018).
Dong et al, conducted a simulation experiment to demonstrate the advantages of the hybrid system with the data obtained from the island of Zhoushan, Zhejiang province, China. In their study, they aimed to optimize the size of grid independent photovoltaic (FV), wind turbine (RT), battery and hydrogen system (storage source battery and hydrogen based hybrid system) reliably and economically. They used the Ant Colony Algorithm to optimize the hybrid system's size optimization to maximize
system costs to size the hybrid system with an efficient energy storage to meet basic load demand. They found that there was a paradoxical relationship between reduced system cost and increased system reliability in simulations using CCA, which reduced search time to achieve the goal. The battery-only hybrid system, the hydrogen-only hybrid system, and the three systems, both of which are compared. They concluded that the battery and hydrogen-based system are more economical than other systems (Dong, & Xiang, 2016).
Hadidian et al, proposed the size optimization method of grid independent photovoltaic / wind turbine / battery power energy system using Gray Wolf Optimization algorithm formulated in Matlab software. The main objective of optimization is to minimize the total annual cost of the hybrid system by determining the most appropriate wind turbine, photovoltaic panel and battery number by considering reliability (LPSP). In this method, they have determined the most suitable hybrid system to meet the load as wind turbine and battery. In their studies comparing 90%, 95% and 100% usability of the components of the hybrid power generation system, they concluded that the reliability of the devices decreased as the usability decreased. The results obtained from the optimization have found that Gray Wolf Optimization algorithm can easily find the optimum hybrid power energy system quickly and at lower cost compared with the methods well known in the literature. They suggested that consideration of the reliability method could have a significant impact on optimization (Hadidian-Moghaddam, Arabi-Nowdeh, & Bigdeli, 2016).
Sanajaoba et al, presented the optimization of the hybrid energy system by taking into account the usability of photovoltaic panels and the power interruption rates of wind turbines (accepted as 0.05) in their study with data obtained from Almora region of India. For the optimization of the hybrid energy system, a new meta-heuristic algorithm called Cuckoo Bird search algorithm has been implemented in MATLAB programming environment. They also investigated the sensitivity of various input parameters such as solar radiation, wind resources and cost of capital to the unit energy cost. The results of the Cuckoo Bird search algorithm are compared with Genetic Algorithms and Particle Swarm Optimization algorithms and it is concluded that the calculation times are decreased by 20.1% and 17.8% respectively (Sanajaoba Singh & Fernandez, 2018).
Sangeetha et al, modeled the hybrid system consisting of photovoltaic panel, wind turbine and battery group using Simulink program and estimated size optimization by using heuristic optimization techniques in Matlab program. They aimed to maximize power supply reliability and minimize power generation costs in the size optimization of the hybrid system. In this study, they compared the results with Genetic Algorithm and Flower Pollination Algorithm for size optimization. They have proven that the genetic algorithm also provides good results in optimization, but the Flower Pollination Algorithm has achieved better results than the Genetic Algorithm by taking into account the energy production and energy costs that meet the installed power (Sangeetha, & Suja, 2017).
Zhang et al. Aimed to develop a new effective methodology for modeling and optimization of the hybrid system for renewable energy by considering two hydrogen and battery-based energy storage devices. They proposed a hybrid Chaotic Search and Harmonia Search based Simulated Annealing algorithm for optimization. The proposed algorithm performance compared with the Simulated Annealing and Harmonic Search based Simulated Annealing algorithms. Algorithms have been developed in Matlab program to obtain the minimum life cycle cost of the hybrid system by supplying the electricity load of the housing in a remote region in Kerman Province of Iran with renewable energy sources independent from the network. The optimization results of the six hybrid systems consisting of wind turbine / hydrogen, photovoltaic panel / hydrogen, wind turbine / photovoltaic panel / hydrogen, wind turbine / battery, photovoltaic panel / battery and wind turbine / photovoltaic panel / battery were compared. According to the optimization results, they concluded that battery-based hybrid systems provide lower cost and reliable energy than hydrogen-based hybrid systems. They stated that the most suitable and economical hybrid system is wind turbine / battery, the ratio of wind turbine, battery and converter to total life cycle costs are 67%, 5% and 28% respectively. 50 independent studies have been conducted for the comparison of the performance of the algorithms and the robustness of the algorithms and they have concluded that the proposed hybrid Chaotic Search and Harmonia Search based Simulated Annealing algorithm is superior to the others (Zhang, Maleki, Rosen, & Liu, 2018).
C. Purpose of the Thesis
The main objective of this thesis is to create optimally design a rooftop hybrid wind-PV power generation system to partly meet power demand for a residential home with controllable and uncontrollable appliances using the binary-code genetic algorithm, which is mostly widely used metaheuristic technique for home energy management in a wind-PV hybrid system consisting of a number of wind turbine, PV panels and batteries. In this hybrid system, total annual net operation and maintenance cost and determination of the number of components are estimated. In the design process the genetics algorithm is encoded in MATLAB environment for simplicity and robustness. The simulation results have shown that the proposed method worked well for the problem under consideration.
II. SYSTEM ARCHITECTURE AND DESCRIPTION
A. Introduction
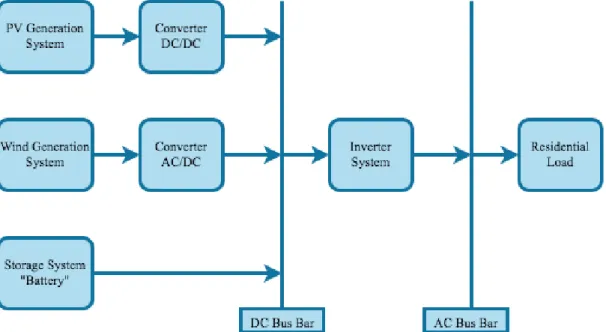
An off-grid hybrid wind-PV system is designed to meet the energy needs of a small residential building. In terms of benefits and costs, this system differ significantly from each other. The off-grid system optionally requires an emergency generator, or some loads may be shut down when the energy demand is greater than the generated and stored electricity. If the generated excess energy is available at any time interval, it must be dissipated into a controllable discharge load (usually a purely resistive load) to maintain voltage and frequency stability in the AC bus. In some applications, a discharge charge may be an electric water heating system. In a system connected to the network, surplus power is expected to be supplied to the network, reducing operating costs. The energy system considered here consists of three main parts: wind turbine, photovoltaic cells, and battery. The two previous units generate power corresponding to the local wind and solar energy sources to deliver freight. The battery bank is the energy storage system that can feed the load in case of a power failure and store excess energy when the generated energy exceeds the charge. The energy storage system is important to cover the lack of the unpredictable and fluctuating nature of renewable energy, but its existence creates difficulties with the sizing problem. The system works as follows:
PV modules and wind turbines generate electricity when the irradiation and wind speed during the day reach sufficient levels. The fact is that the amount of photovoltaic energy production depends strongly on the speed and the temperature of the solar radiation as well as on the energy efficiency of the modules and therefore changes strongly with an interval of one hour. Similarly, wind turbines may begin to produce energy at wind speeds greater than 3 m / s and stop at wind speeds greater than 25 m/s. If the energy generated in a period of time is greater than the energy required, this excess energy is used to fully charge the batteries; then it will be
transferred to an electric water heating system or similar system if energy is still being generated.
There are two types of busbar in the system: direct current (DC) and alternating current (AC).
The direct current (DC) power of the photovoltaic modules is used to charge the batteries via the DC-DC converter. Even the alternative current (AC) power of the wind turbines is converted to the appropriate voltage by the AC to DC converter to charge the batteries as well. The DC energy stored in the batteries is converted into AC energy by the DC-AC converter and transferred to the AC busbar to supply the AC loads. In this case, the DC loads from the DC bus are fed to the voltage level of the battery pack and the AC loads supplied by the AC power bus at a certain voltage and frequency. To be sure our system is working properly, the battery management system controls the charging and discharging of the battery. The block diagram and the open scheme of the hybrid system are shown in Figure 1.
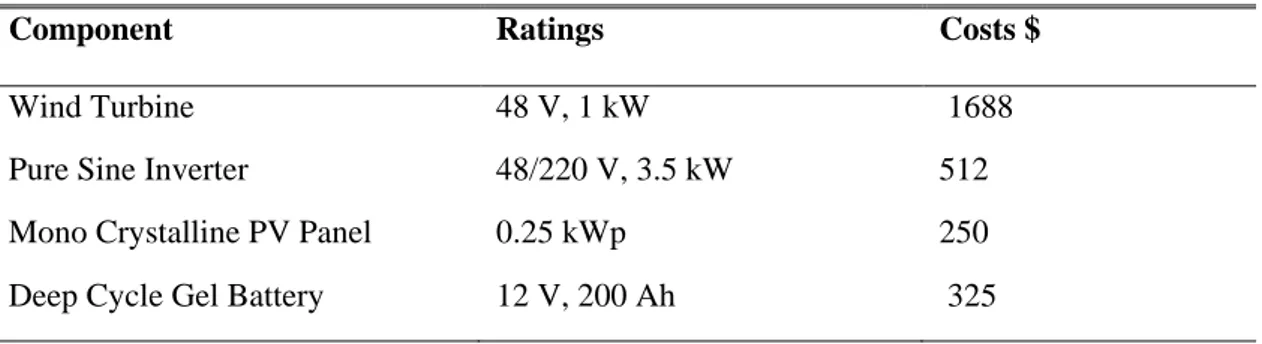
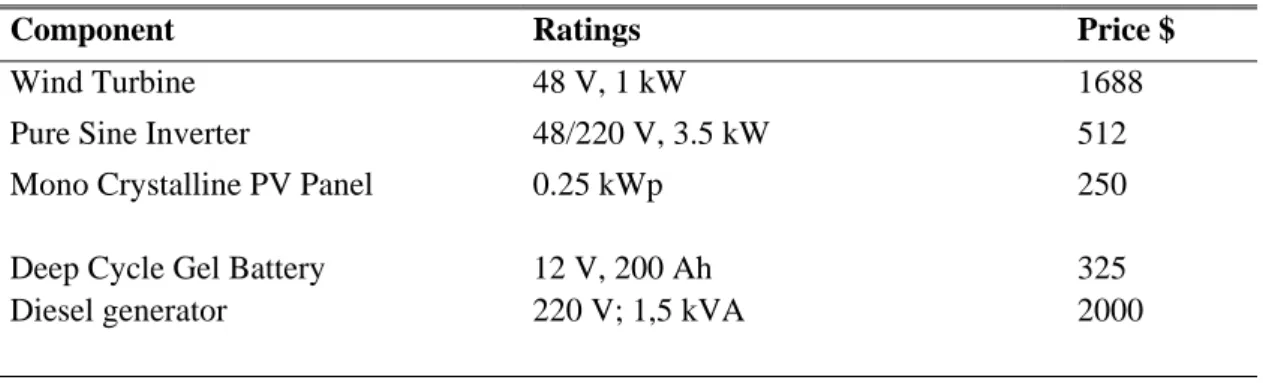
Table 1 System Components Costs and Ratings
Component Ratings Costs $
Wind Turbine 48 V, 1 kW 1688
Pure Sine Inverter 48/220 V, 3.5 kW 512
Mono Crystalline PV Panel 0.25 kWp 250
Deep Cycle Gel Battery 12 V, 200 Ah 325
B. Wind Turbine
1. Power Generation from Wind Energy
Wind is a natural phenomenon caused by air movement due to air pressure gradients. The wind flows from high pressure areas to low pressure areas. The higher the atmospheric pressure gradient, the higher the wind speed and hence the wind energy that can be detected by the wind through wind power conversion machines.
The use of wind energy goes back thousands of years. Ancient human history has shown that wind energy is independently discovered and used in different parts of the world. Windmills have been used in various agricultural sectors, such as pumping water or grinding grain.
Wind turbines need a certain wind speed to generate energy. Start (cut in) and (cut out) can generate energy between wind speeds. The limit is the lower limit, as a rule the system stops below this limit. In modern turbines, the intervention value is between 2 and 4 m/s. The energy gained by the turbine increases with increasing wind speed. At a given wind speed for wind turbines, the system-related power reaches its maximum value. The maximum speed reached is called the rated speed and the maximum power is the rated speed. As soon as the wind speed will exceed the rated speed, the system-related power equals the rated power. In modern turbines, the rated speed is generally between 10 and 15 m/s. The system must stop to prevent damage to the system at higher wind speeds. The point of maximum speed to stop the system is called a disconnect. In modern turbines, this value is usually between 25 and 35 m/s.
2. Wind turbine elements
The main turbine components are shown in Figure 2 and consist of an extruded aluminum shaft, an aluminum die-cast nacelle and integrated electronic components, carbon fiber reinforced epoxy resin blades / diffuser and aluminum fins. An inverter is required to network the turbine.
Figure 2 Structure of rooftop wind turbine Source: (Babu,., Kiran, & Rajendra, 2017).
In wind turbines, the vanes and the hub are defined as rotors, and also the tilt rotation system called tilt control is included in this part. The housing (nacelle) is the part that is connected to the rotor and placed on the tower to accommodate the transmission, the high and low-speed shaft, the control unit, and the generator parts. (Anonymous. 2014).
The transmission transmits the high torque formed in the blades at low speed to the generator by converting the low torque at high speed. The generator is converted into electrical energy with a longer or smaller torque. The tower is made of steel and durable material that carries the rotors, the body, and the blades of the wind turbine. The anemometer is the measurement device of wind speed caused by the temperature difference between the wind and the cables that are under the wind.
Wind turbines are advertised with a nominal output. Roof turbines generally have an output of 400 W to 1 kW. With a quick mental calculation, the 1 kW turbine would generate 24 kWh of energy every day (1 kW x 24 hours). Well, it would be true if the wind blows constantly at the nominal wind speed. The fact is, however, that none of these conditions can occur on a roof, Table 2. shows our wind turbine parameters rated values.
Table 2 Wind Turbine Parameters Rating Values
Properties Rated Values
Output Power 1000W
Max Output Power 1200W
Rotor Diameter 2.18m
Swept Area 3.73 sq.m.
Number of blades 3
Output Voltage DC24V / 48V
Rotate speed 500 rpm
Cut in wind speed 3m/s
Figure 3 Structure of rooftop wind turbine
The curve shows in Figure 3 that the turbine produces electricity at approximately 3 m/s, the cutting speed. The slower winds do not have enough power to turn the rotor. When the wind speed increases, the power increases rapidly, but the power only reaches 1 kW (the nominal power) when the wind speed is about 11 m/s. To put it in perspective: Winds are more likely to occur in the range of 3 to 5 m/s, which means that a 1 kW turbine generally produces less than a tenth of its nominal value.
The shutdown speed is the speed at which the turbine applies a braking mechanism to avoid damage. A typical shutdown speed is only a few m/s higher than the nominal speed, so that the "weak point", the area in which the turbine generates its nominal power, is quite small.
3. Wind Turbine modeling
A wind turbine generates power Pw when the wind speed V is greater than the cutting in speed Vci and turns off when V is greater than the shutdown (cutting out) speed Vco.
If Vr <V <Vco (Vr is the nominal wind speed), the wind turbine generates the nominal power Pr.
If Vci <V <Vr, the output power of the wind turbine varies according to the Cube Act. The Equation 1 are used to model the wind turbine:
P𝑤𝑤 = � 𝑃𝑃𝑟𝑟. �𝑉𝑉 3−𝑉𝑉 𝑐𝑐𝑐𝑐3 𝑉𝑉𝑟𝑟3−𝑉𝑉 𝑐𝑐𝑐𝑐3� , 𝑉𝑉𝑐𝑐𝑐𝑐 ≤ 𝑉𝑉 ≤ 𝑉𝑉𝑟𝑟 𝑃𝑃𝑟𝑟 , 𝑉𝑉𝑟𝑟≤ 𝑉𝑉 ≤ 𝑉𝑉𝑐𝑐𝑐𝑐 0 , 𝑉𝑉𝑐𝑐𝑐𝑐 ≤ 𝑉𝑉 𝑜𝑜𝑜𝑜 𝑉𝑉 ≤ 𝑉𝑉𝑐𝑐𝑐𝑐 (Equation 1) where 𝑃𝑃𝑟𝑟 = 12 𝐶𝐶𝑝𝑝𝜌𝜌𝑎𝑎𝑐𝑐𝑟𝑟𝐴𝐴𝑤𝑤𝑉𝑉𝑟𝑟3 (Equation 2)
Where Cp is the power factor, 𝜌𝜌𝑎𝑎𝑐𝑐𝑟𝑟 is the air mass density shown in Equation 3, and
Aw is the cross section of the wind rotor.
In the Equation 2 the values affecting the power available in the wind flow are air density, wind rotor size and wind speed. The main factors affecting air density are ambient temperature, atmospheric pressure, altitude and air components and others. If the altitude and temperature values are known, the air density can be calculated by Equation 3, and the wind speed value measured by the meteorological station is reduced to the location where the renewable system is installed by the Equation 4.
𝜌𝜌𝑎𝑎𝑐𝑐𝑟𝑟 = 353,49𝑇𝑇 . 𝑒𝑒� −𝑍𝑍 30 𝑇𝑇� (Equation 3) 𝑉𝑉 = 𝑉𝑉𝑐𝑐. �𝐻𝐻𝐻𝐻0� 𝛼𝛼 (Equation 4)
Where T is the temperature at the site where the wind turbine is installed measured in (°C).
H is the height at the site where the wind turbine is installed, 𝐻𝐻0 height at the original location (statutory conditions or factor value), measured in meter (m).
V is the increased wind speed at the height of the cube H, 𝑉𝑉𝑐𝑐 is the wind speed at the original location (statutory conditions or factor value).
C. Photovoltaic
1. Electricity generation from Photovoltaic
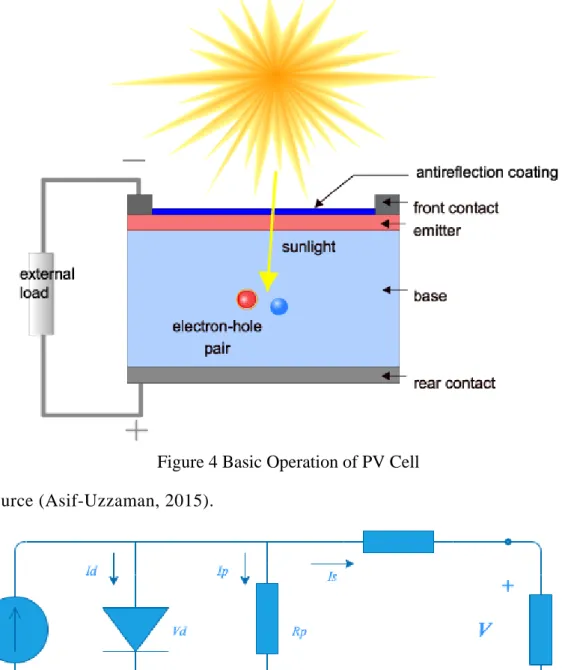
Although solar energy technologies differ from methods and techniques, they are generally studied under two major titles. The first of these are solar thermal technologies. In these systems, heat energy is first obtained, so that the recovered heat can be used directly or converted into electrical energy. The second are photovoltaic systems. Thanks to the solar cells used in these systems, sunlight is converted directly into electricity.
Photovoltaic energy come through the photovoltaic effect, which describes how some materials can convert sunlight into electricity. They absorb some of the solar energy and allow the current to flow between two opposing layers. Individual solar cells provide a relatively small amount of energy, but electrical energy may be important in interconnecting. The cells, modules and matrices may be switched in series or in parallel or in combination generally to produce the desired peak voltage output.
2. Photovoltaic cell
A photovoltaic cell (PV cell) is an energy-sensing technology that converts solar energy into useful electricity through a process called a photovoltaic effect. It uses semiconductors to interact with photons coming from the sun and generate an electric current. (Xu, Zhang, et all 2019).
Figure 4 Basic Operation of PV Cell Source (Asif-Uzzaman, 2015).
Figure 5 Single Equivalent Circuit Model of PV Cell 3. PV Module
A single solar cell cannot deliver the required net output. In order to increase the output power of a photovoltaic system, it is therefore necessary to connect the number of these photovoltaic solar cells. A solar panel is normally connected in series with a sufficient number of solar cells to provide the required standard voltage and output. A solar module can be designed from 3 watts to 300 watts. Solar
modules or photovoltaic modules are basic components available on the market for a solar power generation plant.
In reality, a single photovoltaic solar cell produces a very small amount that varies between about 0.1 watts and 2 watts. However, it is not practical to use a low power device as part of a system. The required number of such cells is combined to form a commercial solar system, which is referred to as a solar module or photovoltaic module.
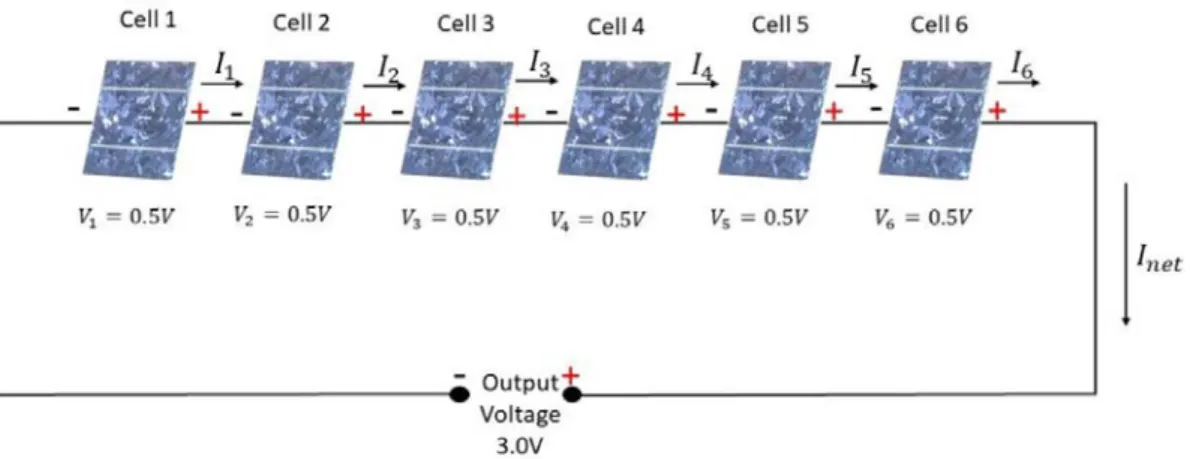
In a solar module, solar cells such as battery cell units are connected in a battery system. This means that the positive terminals of a cell, which is connected to the negative terminal voltage of the solar module, the simple sum of the voltage of the individual cells, which are connected in series in the module.
Figure 6 PV module Connected Series
The normal output voltage of a solar cell is about 0.5 V, so if 6 of these cells are connected in series, the output voltage of the cell would be 0.5 × 6 = 3 volts.
The performance of a solar module depends on certain conditions, such as the ambient temperature and the intensity of the incident light. Therefore, the evaluation of a solar module must be determined under such conditions. It is a common practice to express the rating of the photovoltaic or solar module at a temperature of 25 ° C and a light radiation of 1000 W / m2. Solar modules are classified according to open circuit output voltage (Voc), short circuit current (Isc) and maximum output (Wp). This means that these three parameters (Voc, Isc and Wp) can be measured by a solar module at 25 ° C and a solar radiation of 1000 W / m2.
These conditions, namely the temperature of 25 ° C and the solar radiation of 1000 W / m2, are collectively referred to as standard test conditions. (Hiendro, Yusuf, et all, 2018).
The site where the solar modules are installed. This is because the sunlight and the temperature vary with time and place.
a) Characteristics of PV Module
If we plot a diagram in which the X-axis is represented as a voltage axis and the Y-axis as a solar module, then the diagram represents the V-I characteristic of a solar module.
Figure 7 Characteristics of PV Module
The I-V curve of an illuminated solar cell has the shape shown in Figure 7. Many cell performance parameters can be obtained from this curve:
- Short Circuit Current, Isc - Open Circuit Voltage, Voc - Theoretical Power, Pth - Maximum Power, PMax 4. PV Arrays
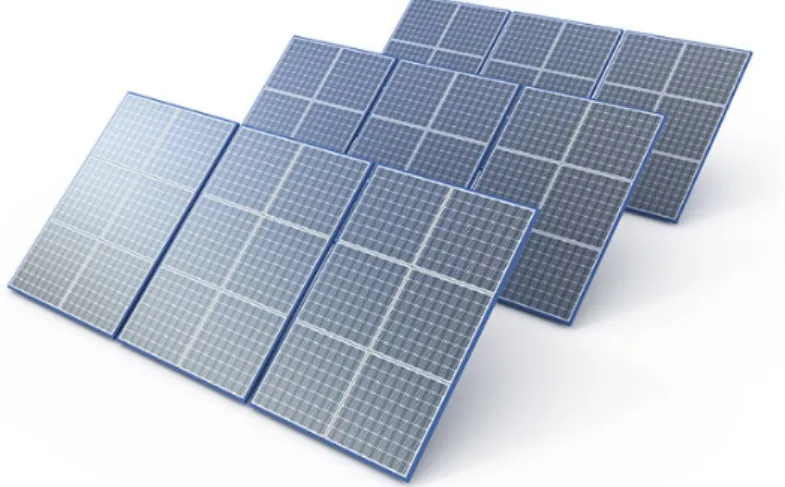
A photovoltaic array is a coherent collection of photovoltaic modules as shown in the Figure 8. Each photovoltaic module (PV module) consists of several interconnected photovoltaic cells. Cells convert solar energy into direct current. Photovoltaic modules are sometimes referred to as solar modules, although this term is best used for solar thermal modules or air heaters. Photovoltaic modules differ from solar cells
installation and installation in residential, commercial and industrial applications. The application and investigation of photovoltaic devices is called photovoltaics.
Figure 8 PV Arrays General Shape a) PV Arrays Modeling
For a photovoltaic system with 𝜂𝜂𝑃𝑃𝑉𝑉 efficiency and 𝐴𝐴𝑃𝑃𝑉𝑉 area (m2), the 𝑃𝑃𝑃𝑃𝑉𝑉 output power (kW), if it is subject to the available solar radiation R (kW / m2) on the inclined surface, results from Equation 5:
𝑃𝑃𝑃𝑃𝑉𝑉= 𝑅𝑅 . 𝐴𝐴𝑃𝑃𝑉𝑉 . 𝜂𝜂𝑃𝑃𝑉𝑉 (Equation 5)
5. Photovoltaic systems summary
Photovoltaic systems are also used as renewable energy sources and solar thermal energy technologies.
Photovoltaic (PV) technology converts direct solar energy into electricity according to the photoelectric principle. The photovoltaic technology is therefore suitable for areas with low and high direct radiation.
The surfaces of photovoltaic systems may vary in square, circular or rectangular. Its thickness is about 0.2 mm or 0.4 mm and its area can vary up to 100 m2. It is known that the intensity of solar radiation at sea level on a sunny day is 1000 W / m2. Depending on the region, the amount of energy per 1 m2 varies between 800 and 2600 kW / h per year.
Photovoltaic technology uses solar collectors made from various types of photovoltaic materials to produce electricity. The most commonly used materials include mono- and polycrystalline silicon triple-fused solar cells, cadmium tellurite (CdTe), gallium arsenide (GaAs), and indium gallium phosphite (InGaP).
A solar cell is generally a small power generator. To generate electricity on a large scale, solar cells form a multicellular module. These modules are mounted in a photovoltaic field with a length of up to several meters.
Figure 9 PV System General Layout
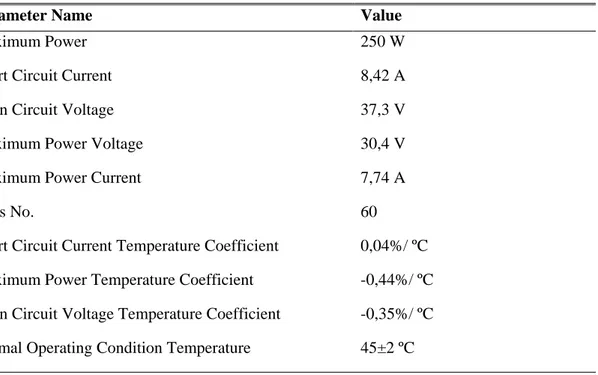
Table 3 PV Parameters Rating Values
Parameter Name Value
Maximum Power 250 W
Short Circuit Current 8,42 A
Open Circuit Voltage 37,3 V
Maximum Power Voltage 30,4 V
Maximum Power Current 7,74 A
Cells No. 60
Short Circuit Current Temperature Coefficient 0,04%/ ºC Maximum Power Temperature Coefficient -0,44%/ ºC Open Circuit Voltage Temperature Coefficient -0,35%/ ºC Normal Operating Condition Temperature 45±2 ºC
D. Battery Bank
The battery storage serves to store the additional energy generated by PV and WT and to compensate for the energy deficit when renewable energies cannot meet the charging requirement. The battery charging process begins when the total output power of the wind and photovoltaic generator is greater than the charging demand, while the battery bank is discharged when the power generated by the wind and photovoltaic generator is less than the demand charging The proposed deterministic approach becomes the uncertainties of solar radiation which takes into account wind speed and load demand when taking into account the uncertainty factor determined from the average forecast error with the PV / WT generation models.
1. Battery Bank Modelling
At every hour t; the battery state of charge [SOC (t)] is linked to the state of the previous charge [SOC (t - 1)] and the situation of the production and energy consumption of the system during the period t - 1 to t. During the charging process when the charge of the (PB battery) flows to the battery (i.e. PB> 0), the state of charge of the battery available at time t can be described by:
𝑆𝑆𝑆𝑆𝐶𝐶(𝑡𝑡) = 𝑆𝑆𝑆𝑆𝐶𝐶(𝑡𝑡−1)+ 𝑃𝑃1000 𝐶𝐶𝐵𝐵(𝑡𝑡) .∆𝑡𝑡𝑏𝑏 (Equation 6)
Δt is the simulation step time (which is set to 1 hour) and Cb is the total nominal capacity of the battery in kilowatt hours. On the other hand, when the battery charge leaks from the battery (i.e., PB <0), the battery is discharged. Therefore, the state of charge of the battery that is available at time t can be expressed as:
𝑆𝑆𝑆𝑆𝐶𝐶(𝑡𝑡)= 𝑆𝑆𝑆𝑆𝐶𝐶(𝑡𝑡−1)− 𝑃𝑃1000 𝐶𝐶𝐵𝐵(𝑡𝑡) .∆𝑡𝑡𝑏𝑏 (Equation 7)
To extend the life of the battery, the battery must not be discharged or overcharged. This means that the SOC battery must be subject to the following restriction at all times:
(1 − 𝐷𝐷𝑆𝑆𝐷𝐷𝑚𝑚𝑎𝑎𝑚𝑚) ≤ 𝑆𝑆𝑆𝑆𝐶𝐶(𝑡𝑡)≤ 𝑆𝑆𝑆𝑆𝐶𝐶(𝑚𝑚𝑎𝑎𝑚𝑚) (Equation 8)
Where DODmax and SOCmax are the maximum permissible discharge depth of the battery and the SOC.
E. Load profile
Residential load can generally be divided into two main categories, based on their ability to reschedule. These categories are:
1. Uncontrollable load.
2. Controllable load.
The non-controllable load consists of non-controllable devices and accounts for 20% of the total load such as lighting, television, computers and refrigerators. The power supply must be available when consumers use the first category device.
Controllable charging or intelligent charging uses new technologies, such as intelligent devices, and is divided into two subcategories: not delayed and delayed. Non-controllable appliances are those that are thermostatically controlled, such as the air conditioning, heating and automatic water heater, and account for 50% of the total load. Non time delay devices can be controlled when heat storage is installed to reduce the energy shortage. The devices that can be undone are those that are not controlled by a thermostat, such as a thermostat clothes washer / dryer and dishwasher, iron, kettle and vacuum cleaner. Deferred devices account for 30% of the total load. The residents are flexible to change their use at low price periods. Due to the controllable load, the request response strategy can be used efficiently, e.g. B. Load reduction and load transfer. During the request to answer the question, the program participants therefore reduce the energy consumption of the network and program it in another time interval in which the energy price is low. In times of low activity, the participants can consume energy in the networks to simplify this.
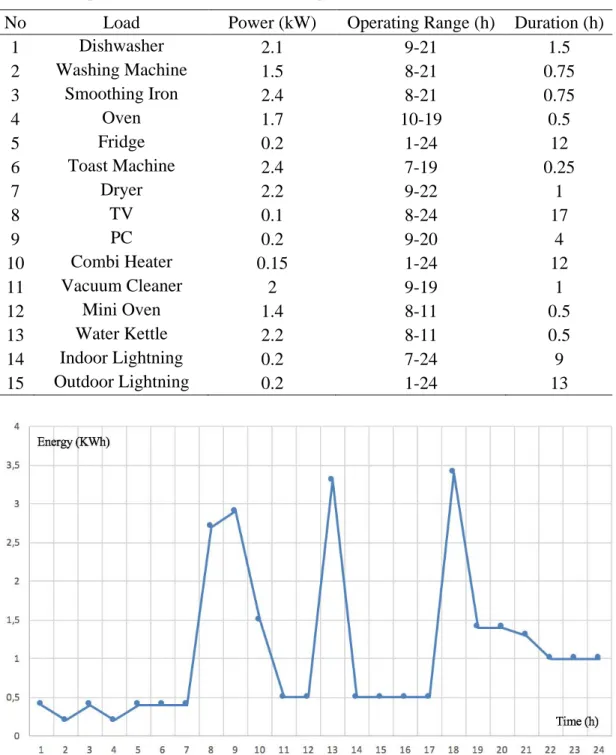
Table 4 Typical Residential Loads and Operation Hours
No Load Power (kW) Operating Range (h) Duration (h)
1 Dishwasher 2.1 9-21 1.5 2 Washing Machine 1.5 8-21 0.75 3 Smoothing Iron 2.4 8-21 0.75 4 Oven 1.7 10-19 0.5 5 Fridge 0.2 1-24 12 6 Toast Machine 2.4 7-19 0.25 7 Dryer 2.2 9-22 1 8 TV 0.1 8-24 17 9 PC 0.2 9-20 4 10 Combi Heater 0.15 1-24 12 11 Vacuum Cleaner 2 9-19 1 12 Mini Oven 1.4 8-11 0.5 13 Water Kettle 2.2 8-11 0.5 14 Indoor Lightning 0.2 7-24 9 15 Outdoor Lightning 0.2 1-24 13
III. PROBLM FORMULATION AND SYSTEM
OPTIMIZATION
A. Introduction
Optimization is the sum of the mathematical principles and methods for solving numerical problems in many disciplines such as physics, biology, engineering, business and trade. In engineering, optimization is the most efficient use of resources (labor, time, capital, processes, raw materials, capacities, equipment, etc.) in a system for specific purposes (cost reduction, maximizing profits, maximizing) the use and maximizing efficiency). It is defined as a method that enables access (Touré, Addouche, et all, 2019).
Optimization is the process of doing something better. During optimization, the inputs are adjusted to determine the minimum or maximum result or the maximum output. It depends on a device, a math operation, or an experiment. As shown in the following figure, the entries consist of variables. The process or function is referred to as a cost function, target function, fitness functions and the result as costs and fitness. (Tutkun, Moses, 2014), (Tutkun, Moses, 2014).
Figure 11: General Optimization process Diagram
Mathematically, optimization can be defined as finding the best solution to a function with one or more arguments with certain restrictions. Optimization is the
from production to design. It is an optimization process to get the maximum benefit or the lowest cost in the company, to manufacture the device in the most ideal dimensions in the design, to design the devices that use less energy or to the harmful gases emitted by the engine to minimize (Mekontso, Abubakar, et all, 2019).
Optimization problems are the selection of the best system components from a search field or a range of possible solutions.
B. Construction of Objective Function
Optimization methods can be divided into two categories as conventional and next generation methods. Conventional methods are the graphical structure method, the iterative method, the probability method and the exchange method. Conventional methods follow a strict procedure and also show little flexibility, low convergence speeds, longer calculation times and no dynamic changes. Nowadays, these techniques are rarely used due to their inconvenience. On the other hand, next generation approaches are faster, more flexible than traditional approaches, with higher convergence speeds and effective global search solutions. This trend shows that the new generation of algorithms (evolutionary heuristics) has been widely accepted and used in the literature in recent years. The next generation methods are taboo search based on artificial intelligence, genetic annealing, simulated annealing, harmony search, optimization based on biogeography, ant colony optimization, cuckoo bird, Firefly algorithms as heuristic algorithms inspired by nature. (Ndukwe, Iqbal, Liang, & Khan, 2019).
Renewable energy systems rely heavily on system components. Correctly modeling each component therefore provides tools to better understand system performance and reliability, and to optimize the system. The researchers use various optimization techniques such as the graphic method, the probabilistic approach, the iterative technique, artificial intelligence (intuitive), dynamic programming, linear programming, multi-purpose design and software to optimize the hybrid photovoltaic system. / wind (Oviroh, & Jen, 2018).
The main concern in designing the proposed PV wind hybrid system is to determine the size of each component involved in the system so that the load can be met in an economical and reliable manner. System components are therefore subject to:
1. Minimize the total cost of the system.
2. Make sure that the load is delivered according to certain reliability criteria.
In order to minimize the cost in the hybrid system, the power difference between the generated and consumed powers must be reduced as much as possible. In this case the difference power can be expressed by Equation 8.
24
∑ ( ∆𝑃𝑃(𝑘𝑘) = 𝑃𝑃𝑔𝑔(𝑘𝑘) − 𝑃𝑃𝑑𝑑(𝑘𝑘) ) = 0 (Equation 8)
𝑘𝑘=1
Where k is the consecutive integers 1 to 24, Pg (k) and Pd (k) are the forces produced and consumed respectively in the hourly time period.
The energy generated and demanded in total in each 24 hour period can be expressed in Equation 9 and Equation 10.
24 𝑊𝑊𝑔𝑔= ∆𝑡𝑡 ∑ { 𝑁𝑁𝑤𝑤 × 𝑃𝑃𝑤𝑤(𝑘𝑘) + 𝑁𝑁𝑝𝑝 × 𝑃𝑃𝑝𝑝(𝑘𝑘) } (Equation 9) 𝑘𝑘=1 24 𝑊𝑊𝑑𝑑= ∆𝑡𝑡 ∑ 𝑃𝑃𝑑𝑑(𝑘𝑘) (Equation 10) 𝑘𝑘=1
Here, ∆t is the time interval, Pw (k), Pp (k), Np and Nw respectively, the wind turbine in the k-hour period, the forces generated by the panels, the number of PV panels and the number of wind turbines (Kharrich, Akherraz, & Sayouti, 2017). To achieve the balance between daily generated and consumed forces, the average 24-hour energy difference must be zero. When the hourly change of power difference is considered, it is seen that it has positive and negative values. The positive and negative values of the power difference indicate excess power and lack of power, respectively. The integration of the power difference over time gives the total daily energy difference and is expressed in Equation 11.
24
∆𝑊𝑊 = 𝑊𝑊𝑔𝑔− 𝑊𝑊𝑑𝑑= ∆𝑡𝑡 ∑ ∆(𝑘𝑘) (Equation 11)
𝑘𝑘=1
To determine the amount of batteries to be stored we use the difference between the positive and negative peak values of the energy change over an average day.
Gel batteries have a life cycle of 1500 cycles, and this cycle should not exceed 80% charge and less than 20% discharge for good performance. Accordingly, the number of batteries required for storage capacity can be calculated by Equation 12.
𝑁𝑁𝑏𝑏≥ ∆𝑊𝑊𝑚𝑚𝑚𝑚𝑚𝑚0.8𝑊𝑊−∆𝑊𝑊𝑏𝑏 𝑚𝑚𝑐𝑐𝑚𝑚 (Equation 12)
Where, ∆𝑊𝑊𝑚𝑚𝑎𝑎𝑚𝑚, ∆𝑊𝑊𝑚𝑚𝑐𝑐𝑚𝑚 and Wb are the maximum and minimum energy values of the energy difference and the largest amount the battery can store.
To determine the number of PV panels and wind turbines required in the hybrid system needed to feed electrical loads in a typical house, the following procedures should be followed:
1. The unit prices and average life of commercially available 1 kW wind turbines, 0.25 kW PV panels and 200 Ah gel batteries are determined.
2. If the wind turbine power exceeds a single PV panel power rating, the number of PV panels is gradually increased to maintain power balance. 3. Annual cost is calculated for each combination and the lowest cost hybrid
system combination is found.
4. Choose the best combination with the lowest cost.
Taking these steps into consideration, the most suitable combination of WIND-PV-Battery components to be used to meet the energy requirements of a residence in the Turkish south boarder area of Kilis was chosen. (Tutkun, Can, Afandi, 2017)
Pricing of each component of the system is given and this combination is determined to minimize installation, maintenance and operation costs.
Based on the data of Table 1 for 20 years of system life only wind turbine, only PV and hybrid WIND-PV system combinations are calculated with the total cost (TC) of Equation 13.
𝑇𝑇𝐶𝐶 = (𝑁𝑁𝑊𝑊𝑇𝑇 × 𝐶𝐶𝑊𝑊𝑇𝑇 × 𝐹𝐹𝑊𝑊𝑇𝑇× 𝑃𝑃𝑊𝑊𝑇𝑇 + 𝑁𝑁𝑃𝑃𝑉𝑉× 𝐶𝐶𝑃𝑃𝑉𝑉× 𝐹𝐹𝑃𝑃𝑉𝑉+ 5 × 𝑁𝑁𝐵𝐵× 𝐶𝐶𝐵𝐵× 𝐹𝐹𝐵𝐵) × 𝐶𝐶𝐼𝐼𝐼𝐼+
�𝑁𝑁𝑊𝑊𝑇𝑇× 𝐵𝐵𝑊𝑊𝑇𝑇× 𝐸𝐸𝑊𝑊𝑇𝑇+ 𝑁𝑁𝑃𝑃𝑉𝑉× 𝐵𝐵𝑃𝑃𝑉𝑉× 𝐸𝐸𝑃𝑃𝑉𝑉+ ∑24𝑘𝑘=1��∑𝑐𝑐=1,𝑗𝑗=1𝑁𝑁𝑊𝑊𝑇𝑇,𝑁𝑁𝑃𝑃𝑃𝑃𝑐𝑐𝑊𝑊𝑇𝑇𝑐𝑐𝑃𝑃𝑊𝑊𝑇𝑇𝑐𝑐(𝑘𝑘) +
𝑐𝑐𝑃𝑃𝑉𝑉𝑗𝑗𝑃𝑃𝑃𝑃𝑉𝑉𝑗𝑗(𝑘𝑘)� − 𝑐𝑐𝑐𝑐𝑃𝑃𝑐𝑐(𝑘𝑘) + 𝑐𝑐𝑑𝑑𝑃𝑃𝑑𝑑(𝑘𝑘) 𝑐𝑐𝑚𝑚𝑃𝑃𝑚𝑚(𝑘𝑘) − 𝑐𝑐𝑒𝑒𝑃𝑃𝑒𝑒(𝑘𝑘)�� × 365 (Equation 13)
∑24𝑘𝑘=1�∑𝑀𝑀,𝑁𝑁𝑐𝑐=1 ,𝑗𝑗=1�𝑃𝑃𝑊𝑊𝑇𝑇𝑐𝑐(𝑘𝑘) + 𝑃𝑃𝑃𝑃𝑉𝑉𝑗𝑗(𝑘𝑘) �− 𝑃𝑃𝑐𝑐(𝑘𝑘) + 𝑃𝑃𝑑𝑑(𝑘𝑘) + 𝑃𝑃𝑒𝑒(𝑘𝑘) − 𝑃𝑃𝑓𝑓(𝑘𝑘) − 𝑃𝑃𝑙𝑙(𝑘𝑘)� (Equation 14) 0 ≤ 𝑃𝑃𝑊𝑊𝑇𝑇𝑐𝑐(𝑘𝑘) ≤ 𝑃𝑃𝑊𝑊𝑇𝑇𝑐𝑐𝑚𝑚𝑎𝑎𝑚𝑚 0 ≤ 𝑃𝑃𝑃𝑃𝑉𝑉𝑗𝑗(𝑘𝑘) ≤ 𝑃𝑃𝑃𝑃𝑉𝑉𝑗𝑗𝑚𝑚𝑎𝑎𝑚𝑚 0 ≤ 𝑊𝑊𝑑𝑑(𝑘𝑘) ≤ 2,4 𝑘𝑘𝑊𝑊ℎ 0 ≤ 𝑊𝑊𝑐𝑐(𝑘𝑘) ≤ 2,4 𝑘𝑘𝑊𝑊ℎ 𝑊𝑊𝑑𝑑(𝑘𝑘) − 𝑊𝑊𝑐𝑐(𝑘𝑘 − 1) ≤ 0 𝑊𝑊𝑑𝑑(0) = 𝑊𝑊0 = 1,2 𝑘𝑘𝑊𝑊ℎ
Where 𝑁𝑁𝑊𝑊𝑇𝑇 number of wind turbines (WT), 𝐶𝐶𝑊𝑊𝑇𝑇 unit generation cost coefficient, 𝐹𝐹𝑊𝑊𝑇𝑇 price of each WT, 𝑃𝑃𝑊𝑊𝑇𝑇 rated power of WT, 𝑁𝑁𝑃𝑃𝑉𝑉 PV panel number, 𝐶𝐶𝑃𝑃𝑉𝑉 PV
installation cost coefficient, 𝐹𝐹𝑃𝑃𝑉𝑉 PV panel price, 𝑁𝑁𝐵𝐵 number of batteries, 𝐶𝐶𝐵𝐵 battery installation cost coefficient, 𝐹𝐹𝐵𝐵 battery price, 𝐶𝐶𝐼𝐼𝐼𝐼 combined interest rate, 𝐵𝐵𝑊𝑊𝑇𝑇 WT maintenance cost per kWh, 𝐸𝐸𝑊𝑊𝑇𝑇 amount of energy produced by kWh in kWh per year, 𝐵𝐵𝑃𝑃𝑉𝑉 PV maintenance cost per kWh, 𝐸𝐸𝑃𝑃𝑉𝑉 PV panels is the amount of energy produced in kWh in one year.
The maintenance costs per kWh for WT and PV panels are taken as 0,85 and 0,42 cents respectively.
𝑃𝑃𝑊𝑊𝑇𝑇 power generated by WT, 𝑃𝑃𝑃𝑃𝑉𝑉 power generated by PV, 𝑃𝑃𝑙𝑙 power demand, 𝑃𝑃𝑐𝑐
charging power to the batteries, 𝑃𝑃𝑑𝑑 discharging power from the batteries, 𝑃𝑃𝑚𝑚 missing power, 𝑃𝑃𝑒𝑒 extra power generated, 𝑊𝑊𝑐𝑐 the amount of energy stored in the batteries, 𝑊𝑊0 the amount of energy initially charged in the batteries.
𝑐𝑐𝑊𝑊𝑇𝑇 the unit costs of WT power = 0.03 $, 𝑐𝑐𝑃𝑃𝑉𝑉 the unit costs of PV power = 0.03 $,
𝑐𝑐𝑐𝑐 the unit costs of charge power = 0.04 $, 𝑐𝑐𝑑𝑑 the unit costs of discharge power =
0.03 $, 𝑐𝑐𝑚𝑚 the unit costs of missing power = 0.11 $, 𝑐𝑐𝑒𝑒 the unit costs of extra generated power = 0.03 $.
In the scale WT-PV hybrid system shown in Figure 1, PV panels and WT are used for basic electricity production and batteries are used for storage. In the area where
dependent on radiation and wind speed, respectively. The maximum energy to be obtained from each device is usually given by the manufacturer as a datasheet, as given in Table 3, but the radiation level, wind speed and temperature, and so on. elements may change momentarily according to the conditions of the environment at any moment. (Tutkun, 2014)
The energy generated by each subsystem can be estimated by a small calculation by looking at their respective power curves. It produces 0.25 kW and 1 kW electrical energy with a monocrystalline PV panel and a horizontal axis WT sequence. The gel batteries used in the hybrid system have a storage capacity of 2.4 kWh and are suitable for deep cycle use. A 3 kW closed loop full sine converter is required to convert the DC power stored in the batteries to AC power in order to supply AC loads in the settlement. The maximum energy to be obtained from PV panels at any time is provided by maximum power point tracking system and the maximum energy to be obtained from WT is determined mechanically by wind direction. Thus, once the power to be produced with PV panels and WT is determined, the energy demand is met by methods such as load shifting, valley filling, hill trimming according to the changing time during the day. In order to reduce the energy, installation, operation and maintenance costs of the small-scale system, it is necessary to balance the energy produced and consumed in each time frame. (Tutkun, Çelebi, 2014)
C. Binary-Coded Genetic Algorithms
Genetic algorithms play an important role in many areas such as artificial intelligence, engineering, robotics, etc., for example in research techniques for managing complex spaces. Genetic algorithms are based on the underlying genetic process in biological organisms and on the principles of the natural evolution of populations. These algorithms process a population of chromosomes that represent spatial research solutions with three operations: selection, crossing, and mutation. In their original formulation, search space solutions are encoded using the binary alphabet. However, the good properties of these algorithms do not result from the use of this alphabet. Other types of encoding have been considered for the rendering problem, such as real encoding, which appears particularly natural when addressing parameter optimization problems with variables in continuous domains (Babu,., Kiran, & Rajendra, 2017).
In order to solve this optimization problem, genetic algorithm (GA) is proposed, in which the code of the genetic algorithm with the MATLAB software is used in this work to solve the previous optimization problem, GA contains the elitist approach. This means that a solution cannot be degraded from one generation to the next, but that the best individual from one generation is copied to the next generation without changes. (Tutkun, Moses, 2014)
The GA used is based on the use of the flow chart in the following figure to obtain the optimal solution. Initially, GA picks random individuals from the current population as parents and uses them to father children for the next generation using the three main operations of selection, crossing, and mutation operations. Therefore, you can change a population of individual solutions repeatedly, with the population developing into an optimal solution in later generations. It should be noted that the different configurations used in the GA 100 individuals for the population size, the stochastic uniformity function for the selection operation, the scatter cross function (with a crossing probability of 80%) for the cross operation, possible adaptive mutation function (with a probability of 1% ) for mutation surgery and an elite person. It should be noted that the three additional limits of the last equation can be entered directly into the specific positions of the GA. (Kömürcü, Tutkun, Özölçer, Akpınar, 2008).
Figure 12 Genetic Algorithm Flowchart D. Methodology
We will assume to design a 5 kW wind-PV system for 20 year lifetime and we have to feed constant 5 kW load residential home.
There are loads have rated power value and operating at different hours as I mentioned previously, as washing machine is operated 0,75 hour and rated power value is 1.5 kW.
So, the main objective is to design a low-cost wind-PV hybrid system in terms of investment and operation and maintenance costs.
To make this we have to optimize wind-PV system using the real coded system in terms of number of PV panels, wind turbines, batteries.
Wind speed and insolation rate data used in the calculation of the estimated power are obtained as the annual average of each hour of the day. The average wind speed and sunbathing data for 2015, 2016 and 2017 were obtained from the local weather station and adapted to the specified location.
Figure 14 and Figure 13 show the hourly variation of average wind speed and radiation level during the day on an hourly basis corresponding to each hour of each day of the three years. The average wind speed and radiation level during the day were calculated as 6.36 m/s and 0.21 kW/m2, respectively. The typical load profile and working hours rated power values are given in Table 4.
Figure 13 Hourly Change of 3-Year Average Wind Speed .
Figure 14 Hourly Change of 3-Year Average Radiation Level
In the scale WT-PV hybrid system shown in Figure 1, PV panels and WT are used for basic electricity production and batteries are used for storage. In the area where the system is installed, electricity production with PV panels and WT is mainly dependent on radiation and wind speed, respectively. The maximum energy to be obtained from each device is usually given by the manufacturer as a datasheet, as given in Table 3, but the radiation level, wind speed and temperature, and so on elements may change momentarily according to the conditions of the environment at any moment.
The energy generated by each subsystem can be estimated by a small calculation by looking at their respective power curves. It produces 0.25 kW and 1 kW electrical energy with a monocrystalline PV panel and a horizontal axis WT sequence. The gel batteries used in the hybrid system have a storage capacity of 2.4 kWh and are suitable for deep cycle use. A 3 kW closed loop full sine converter is required to convert the DC power stored in the batteries to AC power in order to supply AC loads in the settlement. The maximum energy to be obtained from PV panels at any time is provided by maximum power point tracking system and the maximum energy to be obtained from WT is determined mechanically by wind direction. Thus, once the power to be produced with PV panels and WT is determined, the energy demand is met by methods such as load shifting, valley filling, hill trimming according to the