Л И - З ’АШІАТЕ . АШ-ІАС'ЕМВІ’Г;Т.^ І>Г?&РіААХХОН · S;YSTEM3v S'ÎJCCESS
·“ “' '■. ••‘А и : ,’ ·?.* *'*·· 'С * V £. 'т ^ 'т · ■ • '"е:· : г-'г^ t \ > ·ΤÄ
Е А -Е SCHOOL OF BUSINESS .t^.:£IrE3T:-^ ί·,ΤΗ^
A N EM PIRICAL STU DY TO OBSERVE A N D EVALUATE
M A N A G E M EN T INFORM ATION SYSTEMS SUCCESS
IN A
DOMESTIC BA N K
A THESIS
SUBMITTED TO THE DEPARTMENT OF MANAGEMENT AND THE GRADUATE SCHOOL OF BUSINESS ADMINISTRATION
OF BILKENT UNIVERSITY
IN PARTIAL FULFILLMENT OF THE REQUIREMENTS FOR THE DEGREE OF MASTER OF BUSINESS ADMINISTRATION
By
I certify that I have read this thesis and in m y opinion it is fully ad equate, in scope and in quality, as a thesis for the degree of M aster of Business Administration.
A
Assist. Prof. Serpil Sayın
I certify that I have read this thesis and in m y opinion it is fully adequate, in scope and in quality, as a thesis for the degree of Master of Business Adm inistration.
\
Assist. Prof. Dilek Onkal
I certify that I have read this thesis and in m y opinion it is fully adequate, in scope and in quality, as a thesis for the degree of Master of Business Adm inistration.
'f!'
1
Assist. Prof. Can S. M ugan
Approyed for the Graduate School of Business Administration
K Ö
-3 H .
Prof. Siibidey Togan
ABSTRACT
AN EMPIRICAL STUDY TO OBSERVE AND EVALUATE MANAGEMENT INFORMATION SYSTEMS SUCCESS
IN A
DOMESTIC BANK
ÖZLEM ALBAYRAK Master of Business Administration Supervisor ; Assist. Prof. SERPİL SAYIN
June 1994, 96 pages
The main purpose of this thesis is to observe and evaluate the interrelationships of MIS users’ involvement and users’ system satisfaction. To do that IŞBANK’s management information systems has been considered as the sample MIS environment. Questionnaire measuring MIS users involvement and satisfaction levels were conducted as well as pre interviews with the different MIS user groups at IŞBANK. After the questionnaires post interviews were conducted to better analj^ze the subject. Based on the feedback from pre interviews, the relationships between various measures have been studied. Both statistical and non-statistical results of the study are represented in the thesis.
ÖZET
AN EMPIRICAL STUDY TO OBSERVE AND EVALUATE MANAGEMENT INFORMATION SYSTEMS SUCCESS
IN A
DOMESTIC BANK
ÖZLEM ALBAYRAK
Yüksek Lisans Tezi, İşletme Enstitüsü Tez Yöneticisi: Yar. Doç. SERPİL SAYIN
Haziran 1994, 96 sayfa
Bu çalışmanın amacı Yönetici Bilgi Sistemlerinde sistem başarısı ile kullanıcı katılımı arasındaki ilişkileri incelemektir. Bu amaçla IŞBANKASI Bilgi işlem Sistemi baz alınmış, kullanıcı katılımı ile sistemden memnuniyetleri arasındaki ilişkileri ölçme amacıyla an ketler ve öngörüşmeler yapılmıştır. Anket sonrası görüşmelerle konuyu daha iyi analiz etme amaçlanmıştır. Çalışmada anketler ve görüşmelerden elde edilen sonuçlar gerek istatiksel gerekse yorumsal çıkarımlar halinde değerlendirilmiştir.
ACKNOWLEDGMENTS
I would like to thank Assist. Prof. Serpil Sayın for her guidance, suggestions and encouragement for the preparation of this thesis. I am also thankful to Assist. Prof. Dilek Onkal and Assist. Prof. Can Mugan for their helpful suggesstions during the completion of the thesis.
W ithout the helps of Tuna Karayel and Mustafa Uysal, I would not be able to read some of the MIS literature. I would like to thank them very much.
I would also like to thank interviewed information providers for their participation and interest in the study. My special thanks are due to Mr. Mustafa Su, Mrs. Ayça Gençler from IŞBANK Organization Department for providing the valuable list of bank’s branches, as well as the managers’ names. I am also thankful to Mr. Şemsettin Arad and all of my friends Hakan, Ergun, Utku, Fuat who work at İŞBANK’s Information Processing Center.
For their patience, I would like to express my deepest gratitude to my mother and my only sister. Duygu.
Contents
1 INTRODUCTION
1.1 Management
1.2 Information . 3
1.3 S y s te m s ... 5
1.4 MIS : Management Information S y s te m s ... 6
2 PROBLEM DEFINITION 8
3 LITERATURE REVIEW 10
3.1 MIS Concept 10
3.2 User Involvement and User Satisfaction in MIS . 13
4 METHODOLOGY 27
4.1 MIS Under S tu d y ... 28
4.2 MIS User G r o u p s ... 28
4.3 Measurement of MIS User Satisfaction and Involvement 32
5 FINDINGS 39
5.1 Statistical Findings 40
5.2 Non-Statistical Findings . 43
5.2.1 Recommendations... 45
6 SUMMARY and CONCLUSION 47
7 APPENDICES 53
List of Figures
1 MIS concept : a function of management, information and systems 1
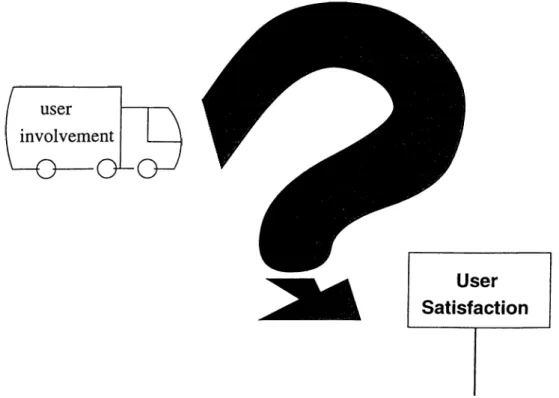
2 Can user involvement be a medium to reach user satisfaction ? ... 8
3 MIS and its foundational b a s e ... H
List of Tables
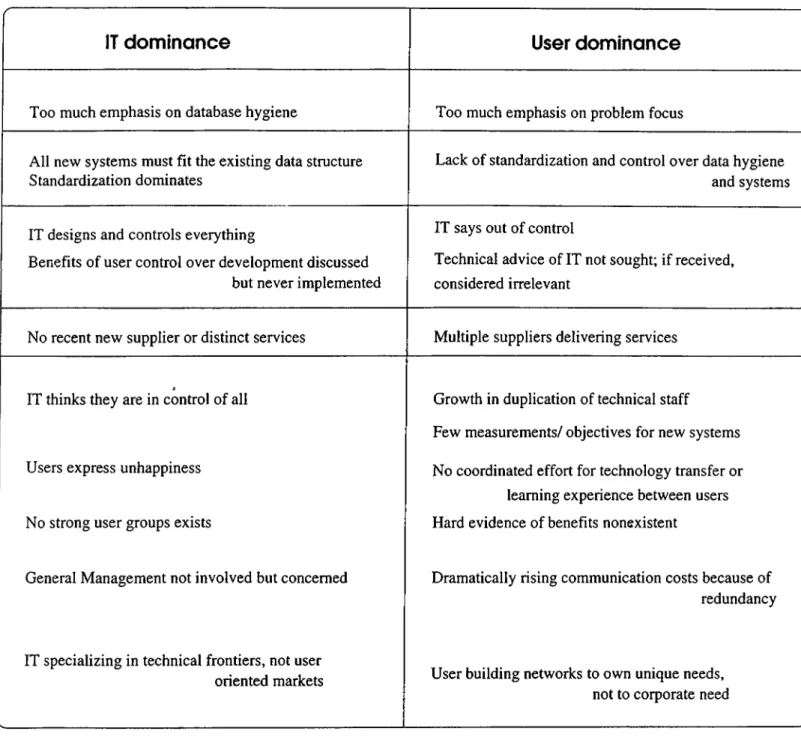
1 Possible implications of Excess IT and User D om inance... 15
2 Measurement of user involvement (continues in the next page) ... 18
2 Measurement of user involvement 19
3 Measurement of user satisfaction (continues in the next page) ... 21
3 Measurement of user satisfaction 22
4 Score boundaries for normalized user satisfaction 36
5 Distribution and number of questionnaires conducted 39
6 Overall Regressions for NS with A ... 41
7 Overall Regressions for NS with I ... 42
A P P E N D IC E S
A p p e n d ix A : Questionnaire used in the study., .54
A p p e n d ix B : Scattered diagrams of responses to questionnaires. .80
1 INTRODUCTION
Since the main purpose of this study is to observe the interrelationships between involve ment and satisfaction of MIS^ users, understanding of MIS concept intended in this study is required at the first step. Hence, we start with the intended definition of MIS in the study.
Early definitional problems associated with MIS include many disagreements over what an MIS is and is not. At one extreme, MIS is defined as a Computer Based Information
confusion of MIS definition, either closer to Data Base Management Systems (DBMS), or Decision Support Systems (DSS) has been already discussed in the literature (Spiegler 1980, Naylor 1982, Watson and Hill, 1983).
Having mentioned the extreme definitions of MIS, one should talk about a third class of MIS definitions. This class combines the previous definitions, which seem conflicting, at least different. Wysong thought of MIS as a system both to support managerial decision making (a DSS), and to support day- to-day activities in individual functional areas (Wysong, 1985).
In this study, MIS is referred to in the sense of Wyong’s definition. Hence, before we proceed, it is appropriate to study the Wysong model of MIS.
In order to place in context the role of MIS within an organization, Wysong looked at the terms involved in MIS : management, information and systems (Figure 1).
1.1
Management
As a term, management implies not only a process by which certain activities are per formed but also people administrating the process. In the development of MIS, there are some general axioms :
• the system should relate to the organizational internal structure.
The system should provide management information which :
is necessary to exercise control over operations,
provides early warning of developing problems,
• indicates remedial actions required.
• enables management to correct interpretation of financial and other statistics.
enables management to allocate organizational resources effectively and efficiently.
1.2
Information
Information is necessary not only for day-to-day operations and performance analysis, but also for tracking progress toward long-term strategic goals. Information can be considered as a vital resource in the business world and managed as so. It consists of a body of knowledge which reduces uncertainty about future happenings.
“The general connotation of information is that it is the result of gathering, classifying, recording, analyzing, sorting, interpreting, and presenting data selectively in a format that is useful and timely” (Wysong, 1985).
(Wysong, 1985). Hence, for information to be high quality it must have the following characteristics ; (Wysong 1985, Brophy 1986).
Relevance : Information submitted to management must be relevant. Irrelevant in
formation reduces productivity. Hence, careful analyses should be performed in selecting which information is relevant to which decision.
Reliability and Consistency : Reliability and consistency of information are key factors
in achieving successful decision-making process. Regardless of the kind of transactions on it, data must be consistent at all levels of an information system.
Timeliness : If the information does not arrive on time, it may generate circumstances
that are very difficult, even impossible to correct. Hence, information should be submitted on time, and this is a vital determinant of information quality.
Completeness : In many circumstances, incomplete information may cause even worse
events than events caused by lack of information. Completeness of information is highly related to the decision to which the information pertains. Ideally, managers must use all the information required to make a decision; however, in real life it is hard to satisfy this. In some cases, all of the information required may not be available, yet in some others, only part of the available information can be gathered. As a result, most of the times only partial sets of required information is submitted to the managers. To the extent that the information is complete, the quality of it increases.
C o st: Although gathering, storing and processing information are all costly, informa
obtaining the same information, hence different costs. The less costly way of obtaining the same information characteristics should be preferred.
1.3
System s
Common to all systems are organization, interaction, interdependence, integration, and a central objective. According to the general systems theory, all systems have the following characteristics:
• systems are designed to accomplish a certain objective ( or set of objectives which may change throughout time ),
• objectives of individual elements are less important than the overall systems objec tives, just like the output and the process of the overall system is more valuable than that of basic elements,
• there exists an established arrangement of systems elements,
• interrelationships among individual elements are synergistic.
Channels for the movements of resources through a system are provided by commu nication. Hence, communication plays the role of a vital element in the whole systems. Information being the main resource of management information systems, requires high
The important aspect is that information systems development is now in a language that management can and must understand.” (McAulay, 1993). But there are still some problems in this language as stated in Cash (1992). Those problems mainly originate from the different knowledge bases of the sides, as well as their different backgrounds. “To communicate among each others, information technology specialists use words as bits, bytes, DOS, CICS, and so on, which are highly opaque to general managers. General Managers, conversely, have a quite different language that includes such terms as sales growth, return on investment, and productivity, terms that are opaque to the information technology specialists ’’(Cash, 1992).
To the extent communication problems among MIS users and information technology specialists ( software developers, system designers,...) are decreased, information systems can be more effective and efficient use of systems will be provided. Certainly, new infor mation analysis methodologies, software and hardware technologies will help to close the gap between MIS users and MIS technology specialists.
Having mentioned about the individual terms involved in MIS, now it is time to define the MIS concept intended in this study.
1.4
MIS : Management Information System s
Most of the previous definitions of MIS failed to respond some questions about MIS, because MIS was considered as a product m the past. However, MIS is not a product, it is a concept (Wysong 1985), and the concept that will be referred throughout this study
is parallel to the definition by Walter Kennevan (1970) :
“ A Management Information System is an organized method of providing past, present, and projected information related to the internal operations and external intelligence. It supports the planning, control, and operational function of an organization by furnishing uniform information in the proper time frame to assist the decision maker. ”
In Chapter 2, the problems addressed in this study will be defined. In Chapter 3, a literature review will be given. Chapter 4 contains a description of how the study was conducted. Our findings are given in Chapter 5. Finally Chapter 6 contains a brief summary, conclusions and directions for further research.
Figure 2: Can user involvement be a medium to reach user satisfaction ?
2 PROBLEM DEFINITION
The main purpose of this study is to observe and evaluate interrelationships among MIS users’ involvement -both in participation and commitment meanings, and their satisfac tions with the system. A list of questions that will be addressed is given below :
• Is there a relation among MIS users’ involvement and their satisfaction with the system ? Does the basic axiom claiming that user information satisfaction increases as users are involved in the MIS system hold in our domain ?
• How can user information satisfaction and involvement be measured ?
• Are users’ and EDP^ staff’s perceptions of user involvement in MIS similar ?
• W hat is the degree of MIS user involvement in different phases of system develop ment?
• How effective is the power asymmetry in fulfilling the expectations?
• What factors affect user satisfaction ?
• What are the users’ general attitudes and behaviors about MIS?
• At which levels, are there communication gaps between the users and information technology specialists?
• What are the mechanisms in identifying users’ requirements?
• Are there mechanisms to encourage users to be involved in system development? Are all of the users aware of these mechanisms ?
• Would users prefer to work without computers ? (attitudes)
3 LITERATURE REVIEW
In this section previous studies in MIS literature are reviewed. First, the concept of MIS intended in this study is given. Then in the following subsection, an overview of the research on user satisfaction and user involvement is presented.
3.1
MIS Concept
In this section the emergence of MIS and the overall evolution of empirical research in Information Systems will be explained.
M IS E m erg en ce : There has been an ongoing discussion on the definition and the concept of MIS in the literature. These discussions were mainly caused by controversial functionalities or different uses of MIS in the organizations. Some argued that MIS was more like a DBMS ( Database Management System ), which is closer to computer science. Still others considered MIS as a DSS ( Decision Support System ), closer to management and decision science, while some others claimed that MIS is more like CBIS ( computer based information system ) that provides and controls information flow in the organizations, closer to organization science.
Given the above considerations, the discussions on MIS definitions should no more be unexpected. Moreover, the emergence of MIS can be explained by these three related fundamental fields of studies : computer science, management science, and organization science (Culnan and Swanson, 1986).
At present, most scholars agree that MIS is an interdisciplinary field of endeavor. Davis suggests that MIS represents the intersection of six fields of knowledge (Davis, 1984). In addition to the three sciences in the framework of Swanson, behavioral science, organizational function, and management accounting were also suggested.
These three foundation fields form a triangular base (Figure 3). Actually, the top point, named as MIS, is flexible. It may move in the space according to the requirements
Computer science focuses mainly upon three components ; data, software and hard
ware. Every organization produces data about basic facts of their organizations in daily activities. These facts, which mean data, are not more important than un-processed raw materials for manufacturing firms. If data is not processed correctly by the software and hardware combinations, it is of no value for the organization. Rather it may mean heavy, meaningless junks.
A possible analogy can be applied to this concept. One can consider data as un processed petroleum found in the nature. Before applying the necessary processes to it, finding the place of the petroleum, gathering and refining, it does not provide any value for the human. Before the inventions of refinery, and usage areas of it, petroleum just stays there, just like data stays as basic facts. In this analogy, software matches with some characteristics of refinery. Data is turned into reports, interpretations can be made. In other words, “helpful information” is generated for the use of organizations, just like petroleum can be turned into fuel oil, oil, etc...Hardware, in turn establishes architectural parameters for data and software, besides, it provides the vehicle for organizational em ployment of both. This is similar to cars, other transportation or heating media using processed oil.
Management science (MS), as an approach to managerial decision making that is based
on specific methodology, makes extensive use of quantitative analysis. MS is mainly concerned with problems, models and solvers. Foundation of MS goes back to early 1900’s though modern MS is generally considered to have originated during World War II. The most significant development was the discovery of the simplex method for solving linear
programming problems.
By the help of computers and methodological developments, virtual explosion of the MS field occurred. Models are used to express real situations in more structured and formal languages. In other words, models are representations of real objects or situations. In general, experimenting with models requires less time and cost than experimenting with real objects or situations. MS models are used to solve real life problems in organizations. They provide the computational technology by means of which models are addressed and explored. Decision makers sometimes refer to these models to solve actual problems. Output of solvers will help them in their decision making processes. Hence, some of the scientists considered MIS closer to DSS.
3.2
User Involvement and User Satisfaction in MIS
Users know about systems through experiencing them. Their knowledge is gained in the course of working with the system in either day-to-day transactions, or in making decisions. User knowledge is experiential knowledge , which is a special way of knowing and thinking. It is knowledge that is concerned with the immediate realities of one’s situation, not with abstract theories about systems.
At an individual level, user knowledge is related to a person’s needs to learn and develop. It is almost a certain and well-known fact that, when referred, user knowledge
them, it exists in forms that are not realistic, not ordered, not systematic, not necessarily rational and not consistent over time.
On the other hand, users may perceive MIS specialists as being self oriented, and not listening to the users. Table 1 consists of two possible extreme scenarios that may arise in the organizations having MIS ; user dominant scenario and MIS staff dominant scenario (Cash, 1992).
Whatever the degree of dispute among the user and the MIS specialists is, it can be said that user knowledge about the system in use and MIS in general is an important source of information for implementing successful MIS applications. It helps to picture user expectations from MIS.
Actually, user expectations can be used as predictors of project success or failure. Ginzberg claimed that to the extent that users hold realistic assumptions about the sys tems, they are more satisfied with the system and use it more than users whose pre implementation expectations are unrealistic. (Ginzberg, 1987). In Figure 4·, Ginzberg’s proposed chain to MIS success is given.
How can one claim that users expectations are unrealistic ? This question is not an easy-to-answer one. Although it is a fact that more knowledged users have generally more realistic assumptions about systems, measuring the degree of users expectations’ realism is not a clear and well-defined process. In his study, Ginzberg used expert’s expectations as basis to measure the realism of user’s expectations. Further, the results of his study suggest that in addition to the experts ( system development personnel).
r
IT d om ina nce U se r dom inance
Too much emphasis on database hygiene Too much emphasis on problem focus
All new systems must fit the existing data structure Standardization dominates
Lack of standardization and control over data hygiene and systems
IT designs and controls everything IT says out of control
Benefits of user control over development discussed but never implemented
Technical advice of IT not sought; if received, considered irrelevant
No recent new supplier or distinct services Multiple suppliers delivering services
IT thinks they are in control of all Growth in duplication of technical staff
Few measurements/ objectives for new systems
Users express unhappiness No coordinated effort for technology transfer or
learning experience between users
No strong user groups exists Hard evidence of benefits nonexistent
General Management not involved but concerned Dramatically rising communication costs because of
redundancy
IT specializing in technical frontiers, not user
oriented markets User building networks to own unique needs,
not to corporate need
V j
user management who played active role during system definition can also provide the benchmark expectations against which the realism of users’ expectations can be judged.
Throughout the emergence of MIS, a large portion of the MIS studies has been devoted to finding ways to implement successful systems so that users will be satisfied and will refer to the system in their jobs. Reasons of system success and failure have been searched parallel to the studies analyzing factors making systems successful or unsuccessful (Ives and Olson, 1983). If high speed is found as a factor making an MIS successful, then ways to increase system’s speed have been searched.
Several methods have been proposed for having better MIS in different stages of MIS development. Evaluations of those methods, pros and cons of them were studied by different scientists (Alter 1976, Batiste and Jung 1983, Shank and Zmud 1985, Markus 1983, Nutt 1980, Kendall 1987, Mansuy 1989).
Common to almost all of those studies is the existence of communication gap between MIS users and system development specialists as a major factor for not having successful MIS. This gap is thought to be filled mostly when users are involved in the different stages of MIS development.
Mansuy’s evolutionary development strategy is one of the studies that tries to close this gap. He claimed that problems caused by lack of user involvement will disappear when his proposed development strategy for MIS is used (Mansuy, 1989). He stated that management information systems should be built to be modified to meet the user’s needs, which usually change faster than the time it takes to build systems using the traditional
approaches.
Mansuy’s proposed strategy permits more user involvement in the management infor mation systems development. Hence, he claimed that evolutionary development strategy (his proposed strategy) allows the MIS developer to adopt to the user’s environment, rather than forcing the user to adopt to the traditional MIS development process.
Generating tools for measuring user involvement as well as user satisfaction and systems success have occupied considerable portion of the previous MIS studies (Ives and Olson, 1984). Table 2 presents the previous MIS studies on user involvement, while Table 3 summarizes user satisfaction measures (Ives and Olson, 1983).
1. Question n a i r e s self rated
Stu d y Vari a b l e Label M e thod of Measurement Comments
F e r e n c e & U r e t s k y 1 9 7 6 T o p M a n a g e m e n t
I n v o lv e m e n t M u lt ip le it e m " fo r c e d c h o ic d '
F r a n z 1 9 7 9 U s e r - M a n a g e r
I n f lu e n c e M u lt ip le it e m b e h a v io r a lly a n c h o r e d F o r d e s i g n & im p le m e n t a tio n
F u e r st 1 9 7 9 U s e r in v o l v e m e n t
S in g l e - i t e m L ik e r t - t y p e s c a l e
G a lla g h e r 1 9 7 4 P a r tic ip a tio n D ic h o t o m o u s m e a s u r e
G u th r ie 1 9 7 2 P a r tic ip a tio n I n d e x S i n g l e ite m o p e n e n d e d , c o d e d a s
lo w m e d iu m o r h ig h U s e r s " e x p r e s s e d p h ilo s o p h y " I g e r s h e im 1 9 7 6 U s e r i n v o lv e m e n t S i x ite m , lik e r t ty p e s c a l e K a is e r 8 l S r in iv a s a n 1 9 8 0 U s e r i n v o l v e m e n t T r e e ite m , lik e r t t y p e s c a l e L u c a s 1 9 7 5 U s e r i n v o lv e m e n t T w o ite m , lik e r t t y p e s c a l e L u c a s 1 9 7 6 U s e r i n v o l v e m e n t S i n g l e ite m , lik e r t t y p e s c a l e M a is h 1 9 7 9 U s e r in v o l v e m e n t S i n g l e ite m , b e h a v io r a lly a n c h o r e d
O l s o n & I v e s 1 9 8 1 U s e r I n v o lv e m e n t M u lt ip le ite m , lik e r t t y p e s c a le A l s o in c lu d e d r a tin g s b y E D P
R o b e y & F a r r o w 1 9 7 9
P a r tic ip a t io n S i n g l e it e m , lik e r t t y p e s c a l e
In itia tio n , d e s i g n 8 l
im p le m e n t a tio n
S a r to r e 1 9 7 6 P a r tic ip a tio n B e h a v io r a lly a n c h o r e d
S c h e w e 1 9 7 6 I n v o l v e m e n t in S y s t e m D e v e l o p m e n t S i n g l e it e m , b ip o la r s c a l e P re im p le m e n t a tio n i n v o lv e m e n t T w o ite m s c a le S p e n c e 1 9 7 8 A l s o in c lu d e d r a tin g s b y E D P P o s t im p le m e n t a tio n in v o lv e m e n t T w o ite m s c a l e S w a n s o n 1 9 7 4 A p rio ri in v o lv e m e n t T e n it e m , lik e r t ty p e s c a l e P o s s i b l e c o m p o u n d w it h s y s t e m u s a g e Z m u d 1 9 8 1 I n v o lv e m e n t r o le s e ts S i n g l e it e m , lik e r t t y p e s c a l e
2. Questionnaires, multiple raters
s t u d y Variable Label Me t h o d of Measurement Comments
E d s tr o m 1 9 7 7 I n f lu e n c e S i n g l e ite m b ip o la r s c a l e s r e p e a te d fo r 6 p h a s e s , fo u r r a te n 3. Interviews A lt e r 1 9 7 8 I n itia tio n I n t e r v ie w - d ic h o to m o u s c l a s s i f ic a t i o n P a r tic ip a tio n I n t e r v ie w - d ic h o to m o u s c l a s s i f ic a t i o n
P a r tic ip a tio n -O p e r a tin g M a n a g e m e n t I n te r v ie w s P o w e r s & D i c k s o n 1 9 7 3 U s e r s o n P r o je c t T e a m I n te r v ie w s U s e r I n itia tio n I n te r v ie w s T h u r s to n 1 9 5 9 S p e c i a l i s t s v s O p e r a tin g P e r s o n n e l C l a s s ific a tio n V a n l o m m e l 8 l D e B r a b a n d e r O r g a n iz a tio n a l I n v o lv e m e n t P attern C la s s if ic a t io n E D P r a tin g s U s e r P r o je c t I n v o lv e m e n t C la s s ific a tio n s c a le s fo r d e s ig n a n d im p le m e n t a tio n A. Experi m e n t a l m a n i pulation B o la n d 1 9 7 8 T r a d itio n a l d e s ig n p r o t o c o ls v e r s u s m u tu a l in te r a c tio n s S im u la t e d S y s t e m d e s i g n p r o b le m K in g & R o d r iq u e z 1 9 7 8 , 1 9 8 1
P a r tic ip a tio n D ic h o t o m o u s m a n ip u la tio n
A user satisfaction measurement test can achieve to account for 100% of the vari ance. However, there is always the possibility of producing more satisfaction for users by computers. Limits of satisfaction can only be drawn by limits of creativity. Hence, any measurement of satisfaction is limited by this measurement’s boundaries. This is what Mathieson claims in “Measuring Satisfaction” , the story of Bogon the gnome whose hobby was the measurement of user satisfaction (Mathieson, 1986).
Before and after Mathieson’s Bogon, scientists have attem pted to develop instruments to measure user satisfaction in MIS literature. (Bailey and Pearson 1983, Kendall 1987, Nath 1989, Melone 1990). It is possible to divide MIS literature into three phases of study.
In the first phase, the definition of user information satisfaction, as well as identification of variables affecting it were established. Ives (1983) defined user information satisfaction as the extent to which users believe their information systems meet their information requirements. In light of this definition, and identification of the variables affecting the level of user satisfaction, the second phase has been initiated.
In the second phase, some hypothesis were generated about the relations of some variables ( user involvement, system quality, system success, perception of systems by users , system usage rate, etc...) with the user information satisfaction. As a result, almost an axiom of MIS literature has been reached : “User involvement is a necessary condition for MIS user satisfaction and system success.”
“User participation is critical to the success of the MIS project” (Powers and Dickson, 1973).
1. Measures of system quality
Study Vari a b l e Label Method of Measurement Comments
B o la n d 1 0 7 8 P e r fo r m a n c e 7 S c a le s
G a lla g h e r 1 9 7 4 P e r c e iv e d v a lu e o f reporti» D o lla r e s tim a te s
K in g a n d R o d r iq u e z 1 9 7 8 1 9 8 1 D e c i s i o n m a k in g p e r f o r m e n c e E x p e r t e v a lu a t io n s P o w e r s & D i c k s o n 1 9 7 3 C o s t to d e v e lo p H is to r ic a l r e c o r d s S a r to r e 1 9 7 6 P e r fo r m a n c e 7 s c a le s O b je c tiv e T h u r s to n 1 9 5 9 T i m e to c o m p le t e H is to r ic a l r e c o r d s V a n lo m m e l & D e B r a b a n d e r 1 9 7 5 E c o n o m i c b e n e f its I m p r o v e m e n ts in IS 7 ite m lik e r t ty p e s c a l e 6 ite m , lik e r t t y p e s c a l e R a te d b y E D P a ls o
2. M e asures of system usage
K in g 8l R o d r iq u e z A m o u n t o f u s e N u m b e r o f s y s t e m q u e r ie s M e a s u r e n o t d e s c r ib e d O b je c tiv e L u c a s 1 9 7 5 ,1 9 7 6 R e p o r te d u s e S i n g l e ite m F u e r st 1 9 7 9 U s e o f s y s t e m a n d g e n e r a l M I S U s e r e s tim a te s S c h e w e 1 9 7 6 S y s t e m u s a g e m o n th ly r e q u e s t # fo r a c t iv it y b a s e in fo r m a tio n O b j e c t iv e S w a n s o n 1 9 7 4 I n q u ir y in v o l v e m e n t M o n ito r e d s i n g l e in d ic a to r O b j e c t iv e
3. M e a sures of p e r c e i v e d q u a l i t y /informâtion satisfaction
E d s tr o m 1 9 7 7 P e r c e iv e d s u c c e s s o f IS S i n g l e ite m , b ip o la r s c a l e M u lt ip le ra tes
F r a n z 1 9 7 9 P e r c e iv e d s u c c e s s o f IS
3. Measures of perceived quality/information satisfaction ( continued )
S t udy Variable Label Me t h o d of Measurement Comments
K a is e r & S r in iv a s a n In fo r m a tio n s y s t e m s s u c c e s s T w o it e m lik e r t ty p e s c a le M a is h 1 9 7 9 F e e l i n g a b o u t IS F iv e it e m , b ip o la r s c a le O l s o n a n d I v e s 1 9 8 1 IS q u a lity F o u r it e m , lik e r t t y p e s c a l e P o w e r s a n d D i c k s o n 1 9 7 3 U s e r s a t is f a c t io n N o t d e s c r ib e d
S a r to r e 1 9 7 6 S a tis fa c tio n 12 ite m , lik e r t ty p e s c a l e
S p e n c e 1 9 7 8 M I S s a t is f a c t io n 3 ite m , lik e r t ty p e s c a le
S w a n s o n 1 9 7 4 M I S a p p r e c ia tio n 16 ite m lik e r t ty p e s c a le
4. Measu r e s of changes in user behaivor/attitudes
A lt e r 1 9 7 6 R e s is t a n c e I n t e r v ie w - d ic h o to m o u s c la s s . E d s tr o m 1 9 7 7 S C h a n g e in w a y s I n t e r v ie w - d ic h o to m o u s c la s s . S u t h r i e 1 9 7 2 F e lt n e e d fo r in fo r m a tio r M u lt ip le ite m , d if f e r e n c e s c a l e I g e r s h e im 1 9 7 6 S y s t e m a c c e p t a n c e M u lt ip le ite m lik e r t ty p e s c a l e K a is e r 8l S r in iv a s a n
U s e r a ttitu d e s M u lt ip le ite m lik e r t t y p e s c a l e
L u c a s 1 9 7 5 , 1 9 7 6 U s e r a ttitu d e s S i n g l e it e m , lik e r t t y p e s c a l e
M a is h 1 9 7 9 U s e r b e h a v io r
M u lt ip le ite m , b e h a v io r a l a n c h o r e d s c a le
M a is h 1 9 7 9 U s e r a ttitu d e s M u lt ip le it e m lik e r t t y p e s c a le
R o b e y & F a r r o w 1 9 7 9 C o n f lic t S i n g l e ite m , lik ert t y p e s c a le
T h u r s to n 1 9 5 9 N e w w o r k p a ttern s I n t e r v ie w
“There is too little involvement in developing a system and too little ownership of the resulting system. These conditions lead to lack of use and dissatisfaction with the system” (Lucas, 1978 p.43).
“In relation to other factors, eg. top level management support, competence of EDP staff, quality of goal setting, user involvement seems to be the only one which is consis tently related to the quality of the final outcomes” (DeBrabander and Edstrom, 1977, p.191).
“The management information systems literature shows almost general agreement that the success of information systems can be improved by involving the user in the develop ment of those systems” (Franz and Robey, 1986 p.329).
“Participation by these who will be affected by the system is essential. This is especially true for operating managers” (Dickson and Simmons, 1970).
In the third phase of the MIS literature studies, reviews of the previous studies have been made. Most of these reviews emphasized the need for high quality, theory based, and carefully executed empirical studies (Ives and Olson 1984, Melone 1990, Premkumar 1992).
This tendency has been followed by the generation of somewhat standardized or well- accepted measurement scales (Bailey and Pearson, 1983). Bailey and Pearson’s user satisfaction scale is referred in Hawk and Aldag, 1990 as one of the most popular instru
added.
Redefinition of involvement concept, measurement biases in user satisfaction and in volvement in the studies were determined (Barki and Hartwick 1989, Hawk and Aldag 1990). As a result, more sound and valid studies were initiated to rehabilitate the defi ciencies of previous work.
DeBrabander and Tiers have tested their explanatory model by controlled experiments to observe the situational factors that affect effective communication between MIS users and EDP specialists (DeBrabanber and Tiers, 1984). The results of their study claimed that one may expect that intra-team communication will be more effective when the members of a team have also received some preparatory explanation about the operational and systemic contingencies affecting the system to be developed as well as the basic operational and systemic properties involved in the system ( De Brabander and Tiers, 1984).
In addition to the communication gap, top managers tendency toward MIS in general has been realized as another factor effecting MIS success. Historically, user involvement in information systems was considered as participation in the system development process by potential users or their representatives (Barki and Hartwick, 1989). Then by the end of 1980’s, it has been defined and measured as a set of operations or activities that users have ( or haven’t ) performed. Actually, user involvement recently redefined by Barki and Hartwick refers to the state that reflects the importance and personal relevance of a system to the user.
In that respect a user highly anticipated in a system development process may not be highly involved with it if she does not give enough importance to the system. On the other hand, a user who does not participate in the system development process can well be involved in the system if the person thinks that the system is relevant. William J. Doll examined this question : “What if this person is the Top Manager ? ’’Doll examined the top manager’s role in providing guidance for information systems development activities (Doll, 1985). He claimed that management, rather than the hardware, software, or tech nical expertise, is becoming viewed as the missing ingredient in the recipe for successful MIS development efforts.
Although most developers would agree to user involvement in principle, it requires a greater commitment to make it work. Engineers and other team members may not follow through for several reasons. They may lack empathy or sympathy for inexperienced or non-technical computer users. When developers and users meet, they may find that different values, work styles, even languages get in the way of communicating. Developers tend to be young, rationalistic and idealistic, products of relatively homogeneous academic environments. They often have little experience or understanding of the very different work situations and attitudes of many system users. The best intentions can succumb into these factors, especially in the face of the slowness and imprecision that often accompanies user involvement (Grudin, 1991).
support the user’s decision making task.
Similarly, system developers must have influence on the process in determining the technological constraints and possibilities. Finally, the process must end in an agreement whereby different considerations are matched and taken account of (Edstrom, 1977).
In the last decade, it is a fact that empirical researches have dominated the scientific work in the MIS field. Methodologies for conducting the case study of information systems have been presented by Lee (1989).
In order to get detailed information about the evolution of empirical research in IS, the reader may refer to Cheon, Graver and Sabherwal (1993). Their study concludes that the recent emphasis on methodological rigor on organizational level issues are signs that indicate the maturing of the MIS field.
The methodology followed in this particular empirical study about the organizational issues of MIS is presented in the following chapter.
4 METHODOLOGY
Although there are a large number of research methodologies that are applicable to MIS research, given the diversity of the MIS field, it is nonsense to assert one best approach to conducting MIS research (Jenkins 1985). Yet, the selection of the best methodology can be determined within the context of the research objective.
The research methodology followed in this study can be named as group feedback anal
ysis as presented by Jenkins (1985). Employing this methodology, groups of human
subjects complete an objective instrument for testing of the researcher’s initial hypothe sis. Following the statistical analysis of the collected data, the data and the analysis are discussed with the subject group to obtain their subjective evaluation.
In this study, in order to collect objective data ( to test the relationship between MIS user satisfaction and involvement ) questionnaires have been conducted. However, the interviews were performed not only after, but also before the tests. The-intent is to achieve a deeper analysis than that afforded by the statistical analysis alone.
As the first step, the following were identified ;
• the MIS environment to be studied,
4.1
MIS Under Study
The evolving base of today’s world is that information about money is as important as money itself. The way how you present information to the management is likely to be the heart of the financial sector. Hence, I§BANK’s MIS environment was selected as the basis for this study.
What was important ten years ago has been achieved in I§BANK today. That is to say that all current financial transactions can be performed by computers without errors and minimal delays. Having completed the automation of its services totally in all of its branches, I§BANK aims to be in the process of implementing better ways for the current system.
i§BANK’s software applications are developed in house by I§BANK’s Information Processing Center (IIPC). In IIPC, there is an MIS group. Although MIS is a recently spoken subject ( only the last 2 years, especially by upper level managers and managers of big branches ) in I§BANK, the MIS group is rich in both human and other resources, representing the importance given to the studies in the MIS field.
4.2
MIS User Groups
One of the questions to be responded by this study is the existence of differences in satisfaction and involvement levels of different MIS user groups. For that reason, after selecting I§BANK’s MIS as our MIS environment, identification of possible different user groups was performed.
In order to do that, several interviews have been conducted in IIPC, branches, and the organizational department of general management of the bank. The initial interviews were mainly used to set and define criteria that classify MIS users.
According to the classification made by IIPC, there are four different main user groups in the bank’s computer based information system. These groups differ mostly in their reasons to use the system, type of information they use and ways to reach the information. However, members of the same group carry almost similar characteristics. Requirements
*
of those groups are fulfilled by different groups of IIPC. The different MIS user groups defined by IIPC and the assigned groups that serve for these types of users is presented below ;
• Managemjsnt... MIS group,
• Branch users...Branch application group.
• ATM users... ATM group,
• I§BANK’s information processing center (IIPC) employees.
Each user group has access to different screen types. Information retrieved by these screens are also different. Managers can use MFS screens, while other users has access to personal computer and Nixdorf screens^.
Having mentioned about the different types of user groups in the perspective of this study, following paragraphs present some common characteristics of them briefly.
M a n ag e m en t G roup; This group includes not only top level managers, but also managers of branches. Top level managers consist of general manager and the board of directors. They have access to MFS screens, which are closed to branch use. Managers don’t have to use the system, and their power may be more effective than that of branch people. Hence, shape of involvement and satisfaction patterns are expected to be found different than that of branch people’s.
Interviews conducted in the branches with branch managers and those in organization department of the general management led us to include second managers, assistant man agers and sometimes even department chiefs at branches in the management group. This was caused by the fact that these people are the ones who actually use MIS and present the information to the branch managers, while the branch managers usually stay away from the system.
Although the questionnaires conducted both with the branch managers and with the managers who work at general management are the same, their responses will be kept in different records for comparison purposes among those groups.
B ra n ch U ser G ro u p : This group, excluding the branch manager, considers all branch employees who use computer based information system in their daily jobs. For this group, it is mandatory to use this system for transactions. These people have limited access to Nixdorf and PC screens. This group consists of mainly front-line users, who
touch money as they work with the system .
IIP C S taff G ro u p : This group is included in our list in order to compare MIS users’ satisfaction and involvement patterns with IIPC staff’s perceptions. Application Test Center (АТС) is a subgroup in the IIPC. IIPC group, except for the АТС staff, is on the production side of the MIS, not on the consumption side. With this in mind, one should not consider them as regular MIS users. However, in order to compare the link of user involvement to user satisfaction when involvement is assessed by the system analysts to when it is assessed by the users, several people in this group have been interviewed.
IIPC staff were asked to answer questions as if they are branch people or managers. People in the MIS group of the IIPC were given the questionnaires prepared for the management group. Likewise, people in Branch Application Development group in IIPC were given questionnaires prepared for the branch users. For detailed information about the conducted questionnaires readers may refer to the following subsection called Measures
of MIS User Satisfaction and Involvement.
Backgrounds of the people in MIS group consist of business administration and man agement as well as computer science, while most of the people in the Branch Application Development group“* are from computer engineering. In addition to them, people in Ap plication Test Center of IIPC were given the questionnaires.
usage. АТС looks like an ordinary branch of the bank. It has a manager, second manager, chief and other people coming from an ordinary ( mostly big branches though ) branches of the bank.
Initially, АТС people were selected by managers according to their good performance, familiarity with computer usage and good relations with other managers. Although АТС consists of people coming from branches, it is not an actual branch. All of the transactions here are performed in a test environment. АТС does not have real clients in the office and the physical office conditions are better than that of other branches.
АТС consists of only 8 people and out of them only 4 were given the questionnaires. As the size of the sample is very small this groups data were used as part of IIPC staff data.
4.3
M easurement of MIS User Satisfaction and Involvement
Identification of the measures of MIS user satisfaction and involvement is one of the most important parts of this study. As stated in the Literature Review chapter, con siderable research has been conducted to demonstrate users’ involvements effect on user satisfaction from MIS and system success (Hawk and Aldag 1990, Ives and Olson 1984, 1981).
We used the scale developed and partially validated by Bailey and Pearson (1983) to measure MIS users’ satisfaction level. This instrument has been referred to in later MIS
studies as one of the most popular scales for measuring MIS user satisfaction ( Swanson 1982®, Baurodi, Olson and Ives 1986, Hiltz and Johnson 1990, Melone 1990).
The test consists of 39 factors® that are found to be effective in MIS user satisfaction. The measure is based on the semantic differential of four adjective pairs which describe each factor. The relative importance of the factor is based on a separate fifth reaction.
Si = Y^RiiWi^
j-'i
The definition of satisfaction is the sum of the user’s weighted reactions to a set of factors, where ;
Si : satisfaction of individual i,
Rij: reaction to factor j by individual i,
Wij·. importance of factor j to individual i.
The scaling of the seven intervals was quantified by assigning the values -3, -2, -1, 0, 1, 2 and 3 to the intervals. The importance scale was assigned values from 0.10 to 1.00 with steps of 0.15, the value 0.10 being associated with extremely unimportant and 1.00 with extremely important. Using these numbers, the reaction of an individual to a given factor is the average of the assigned values ;
” k=i
n = the number of responded adjective pairs of a specific factor,
Ni,j,k = the numeric response of user i to adjective pair k of factor j.
Thus, Rij can take on values from -3 to +3. Summing the individual weighted factor responses, one gets the overall satisfaction for the user ;
39 w·-· "
j = l k = l
The range of is from +117 to -117. The perceived satisfaction as measured by the above equation can be deceiving. The problem occurs because a given individual may have no reaction to one or more factors. For example, a user evaluated 20 of the 39 factors as highly satisfactory (eg. +3) with an extreme importance (eg. 1.00) and evaluated other 19 factors as neutrally satisfactory (eg. 0) and unimportant. Then the perceived overall satisfaction score would be 60, approximately half-way between 0 and 117. This user can only be viewed as highly satisfied, yet her score suggests only a moderate rating.
To overcome this problem, the score can be normalized to ± 1. The normalized score is based only on factors with at least one nonzero response in the first four adjective pairs. Factors evaluated with only zero responses are omitted as not meaningful. The normalized score for a user is equal to the actual divided by the maximum possible. The
maximum possible score is given as the number of factors receiving at least one nonzero score multiplied by 3.0. That is ;
= ÏF& Ô ) '^here
N Si = normalized satisfaction for user i,
F{ = number of meaningful factors
39
Fi = E ^-i
j=i
where, Sij = 1 if ^ijk > 0-0> zero otherwise.
Thus, the normalized score ranges from -1.00 to +1.00. -1.00 represents maximally dissatisfied, while +1.00 represents maximally satisfied. Table 4 represents the score boundaries for normalized user satisfaction, N Si as stated by Bailey and Pearson (1983).
As the original questionnaire is in English, we translated it into Turkish. To make it more understandable by the target readers, the Turkish copy was prepared by the help of I§BANK’s manager of Organization Department.
N o r m a l i z e d Score Tr a n s l a t i o n
N
1.00 Maximally satisfied
0.67 quite satisfied
0.33 slightly satisfied
0.0 neither satisfied nor dissatisfied
-0.33 slightly dissatisfied
-0.67 quite dissatisfied
-1.00
V --- maximally dissatisfied j
Table 4: Score boundaries for normalized user satisfaction
As for the instrument to be used for measuring MIS user involvement level, part of the scale suggested by Franz and Robey (1986) has been selected. From the scale, ques tions aiming to fneasure user involvement in both design and implementation stages were included in our test.
With the original instrument, only information about the current situation of user involvement can be gathered. To get further information about the perceived level of optimum user involvement, two more scales were added for each question. These cjnestions ask the target that, according to them, what should be the involvement levels of users, and when asked to them individually how much they would like to involve in the process.
The difference in the responses to the first two scales, namely the scales for current and optimum levels of involvement, were calculated for each question. Then adding the absolute value of them, the number showing the total difference of the perceived optimum involvement level. A,· is found for each person. That is.
13
= I]
\fij-j = l
fij = response of individual i to the first scale in question j
Sij = response of individual i to the second scale in question j
The current involvement level I{ were calculated as the sum of the individual responses for the first scales in the second part of the questionnaires. Again in this scale, the assigned values range from -3 to +3, by increments by l.T hat is ;
13
A;=l
where, /¿a, is the response of individual i to question k on the first scale of the questions
In this study, normalized satisfaction score NS was regressed with current involvement level, I, and with deviation from the expected level of involvement, A.
4.4
Conducting the Questionnaire
measured. At the end of the second part of the questionnaire questions which are specific for I§BANK were appended. These questions aim to test the awareness of the target people from the mechanisms giving intensive for the user involvement in the bank.
Unfortunately, our initial trials for conducting the questionnaire free from the organi zational context have failed as some branch managers didn’t respond to the questionnaire. Later, contact with Organization Department of the Bank was provided. As a result of this contact, list of sample branches and names of bank managers was generated. Those people were informed by the Organization Department before the questionnaire were con ducted. The questionnaires stayed with the respondents for at least one week.
To eliminate, or at least to decrease the possible negative effects of this, the target peo ple were informed, before the questionnaires were conducted, that the individual results will not be given to the bank management.
Having explained the methodology of this study, the next chapter presents the findings of the study. In the next chapter, both statistical results obtained by the questionnaires and feedbacks provided by the pre and post interviews will be presented.
Manager Non manager Total
General Management Several Departments
total : 11 11 Branches Branch A Branch B Branch C Branch D Branch E Branch X 6_ 5 4 3 2 1 6 V 4 4 total : 21 + 1* total : 23 + 5 * 44 EDP IIPC ATC total : 11 total : 8 19
* invalid or incomplete questionnaires
Table 5: Distribution and number of questionnaires conducted
5 FINDINGS
In this chapter, the results of conducted questionnaires as well as pre and post interviews will be presented, classified and evaluated to respond to the questions asked in the Problem
Definition chapter.
The number of people given the questionnaires and their groups are given in Table 5. In total, 80 people were given the questionnaires, though 6 of these turned out to
incomplete questionnaires that are not counted by the study.
5.1
S tatistical Findings
After calculating the numbers for satisfaction level NS, current involvement level I and deviation from the optimum involvement level A, regressions among those variables were performed. The normalized satisfaction level was considered as the dependent variable, while the divergence from the optimum involvement level and current involvement level were counted as independent variables.
The scatter diagrams for the data of each user group and overall sample are available in Appendix Bi
cT cp O < CD »-1 a> aq»-i a> C/D C/5 o* P CO CO erf“ C3-> U se r G ro up n R . P line e q ua tio n IIPC 19 0.65 0.002499 -0.02x + 0.72 N on m anagers 23 0.63 0.001109 -0.02x + 0.86 G eneral M ng. 11 0.57 0.062694 -O.Olx + 0.67 A ll 74 0.45 6.62E-05 0.66x
to S" O < CD CD cm•-1 CD C/3 C/3 O* P C/3 C O erh i=r U se r G ro up n R P. line e q ua tio n IIPC 19 0.32 0.181756 0.007X + 0.50 Non managers 23 0.37 0.0845 0.02x + 0.90 General Mng. 11 0.08 0.808004 -O.OOlx + 0.50 All 74 0.17 0.14875 0.004X + 0.53 Branch Mng. 21 0.02 0.917645 0.009x + 0.50
The summarized information of the regression results are given in Table 6 and Table 7. The detailed information on regressions may be found in Appendix C. The link of user involvement to user satisfaction is found to be stronger when user involvement is assessed by system analysts than when it is self reported. This result is in contradiction to the claims of Hawk and Aldag (1990).
Means of N Si's and It's for each group are presented in Table 8. As the table shows, bank manager group is the most involved and maximally satisfied of all. The EDP staff’s judgment for the users’ satisfaction level is the lowest. On the other hand, their judgment for the users’ involvement level is not the lowest.
Up until now, statistical information obtained by the study have been provided. Ac tually, statisti6al significance does not always imply significance. That is rejection of null hypothesis does not mean that precise prediction (practical significance) follows. It does demonstrate to the researcher that within the sample data at least, this particular- dependent variable, N Si, has an association with the independent variables, /,■ and A,·.
5.2
N on-Statistical Findings
The results of the study give enough evidence to claim that most of the branch people are not aware of some activities promoting user involvement or even the existence of the АТС. Personnel working at branches may not have enough information about their groups
Table 8: Means of N Si and /,· values
bank is not very efficient in the sense that the employees are not aware of the mechanisms employed by the headquarters. The bank under study has more than 800 branches all over the country. Yet, only 6 of them which are in Ankara were included in the study. This may lead a bias.
Most of the branch people are not even aware of the АТС in IIPC. As a surprising fact almost all of the branch people saying that they are not aware of АТС have answered the following question which asks if they would accept to work at АТС, as yes.
Branch people have greater numbers in their judgments for the divergence of the current involvement from the optimum involvement level. Actually there is no positive current involvement level in their answers.
2 of those 6 were interviewed after the tests, and they said as the involvement part was not suitable for them, they did not answer that part.
On the contrary to the branch people, managers of the bank mostly think that the divergence of the current involvement level from the optimum involvement level is low. The obtained level of current involvement is more than that was claimed by the branch people. Out of 11, 5 bank managers, and out of 19, 2 EDP employees answered current involvement level as positive.
The reason of this may be not only that bank managers are more involved, but also that they are more informed than branch people about their involvement patterns. Most of the projects were developed by the information exchange between IIPC and bank managers. Moreover, bank managers have more power in the organization than branch people have. Hence, this may help them to be involved in MIS design and implementation also.
5.2.1 Recommendations
Out of the interviews conducted the following items can be identified as recommendations;
• Change in organizational structure. The hierarchic structure of IIPC and the bank should be reorganized. Most of the managers agreed that IIPC may be another organization serving for the bank. Having HPC as a profit center, the users may
better organizational structure. Pros and cons of such implementation will not be presented here, as it requires further investigation.
• Change in proposal presentation. The promotion given for the proposals that will provide better services of computer based information systems ® is an important sign of intensive given in user involvement. A recent project forced branch people to send proposals to the organizational department about MIS. In 6 months, 5182 proposal letters were collected. They were grouped in to 1114 different groups. Among those groups, 128 proposals were determined and 49 of them have been realized.
During the pre interviews, it has been observed that some branch people and 1 АТС person claimed that the number of proposals will dramatically increase if a pre-designed electronic letter facility format is provided for the branch people.
• Increase awareness of АТС. The increased awareness of АТС will provide infor mation for the branch people and hence their knowledge about users’ involvement patterns will increase.
Some factors are found to be unrelated or meaningless by some of the respondents. The strongest of all is the claim saying that IIPC people cannot be generalized, yet the questions ask for the general. The level of involvement may change from some IIPC people to the others.
In this chapter, findings of the study have been presented. In the following chapter, summary and conclusion of the findings will be given.