Address for Correspondence: Dr. Aslı Tanındı, Ufuk Üniversitesi Tıp Fakültesi, Dr. Rıdvan Ege Hastanesi, Kardiyoloji Bölümü Mevlana Bulvarı No:86-8, Balgat, Ankara-Türkiye
Phone: +90 312 204 40 82 E-mail: [email protected] Accepted Date: 17.04.2014 Available Online Date: 03.06.2014
©Copyright 2015 by Turkish Society of Cardiology - Available online at www.anatoljcardiol.com DOI:10.5152/akd.2014.5447
A
BSTRACTObjective: Total bilirubin (TB) was recently recognized as an endogenous anti-inflammatory and anti-oxidant molecule. Uric acid (UA) takes part in cardiovascular diseases by inducing oxidative stress, inflammation, and endothelial dysfunction. We assessed the relationship between serum TB levels, serum UA levels, and inflammatory status assessed by neutrophil-to-lymphocyte ratio (N/L) and arterial stiffness and arterial wave reflection in patients with a clinical diagnosis of coronary artery disease (CAD).
Methods: We included 145 consecutive patients admitted with stable angina pectoris (SAP) or acute coronary syndrome (ACS). Blood samples were drawn at admission for complete blood count and biochemistry. Non-invasive pulse waveform analysis for the determination of augmentation index (AIx) and carotid-femoral pulse wave velocity (PWV) measurements were performed with the commercially available SphygmoCor system.
Results: When patients were divided into tertiles of PWV and AIx, median N/L and median serum UA levels were the highest and mean TB levels were the lowest in the third tertile (p<0.001 for all). AIx and PWV were positively associated with serum UA and N/L and negatively asso-ciated with serum TB levels (p<0.001 for all). After adjustments for age, gender, heart rate, systolic blood pressure, and presence of diabetes, significant correlations persisted for N/L, UA, and TB in ACS patients (p<0.05). In the SAP group, TB was significantly negatively correlated with AIx and PWV, and UA was significantly positively correlated with PWV (p<0.05).
Conclusion: N/L ratio and serum UA and TB levels might be used to risk-stratify patients with respect to arterial stiffness in CAD patients, especially in the presence of ACS. (Anatol J Cardiol 2015; 15: 396-403)
Keywords: arterial stiffness, arterial wave reflection, neutrophil-to-lymphocyte ratio, uric acid, total bilirubin, coronary artery diasease
Aslı Tanındı, Aycan Fahri Erkan, Aslıhan Alhan*, Hasan Fehmi Töre
Department of Cardiology, Faculty of Medicine and *Department of Statistics, Faculty of Arts and Sciences, Ufuk University; Ankara-Turkey
Arterial stiffness and central arterial wave reflection are associated
with serum uric acid, total bilirubin, and neutrophil-to-lymphocyte
ratio in patients with coronary artery disease
Introduction
“Arterial stiffness” collectively describes distensibility, com-pliance, and elasticity of the arterial vasculature (1). Carotid-to-femoral pulse wave velocity (PWV) is considered the gold stan-dard method because of its relative ease in determination and reliability (2). Central aortic pressure wave is composed of a forward-traveling incident wave created by ventricular systole and a subsequent reflected wave from the periphery. Increased aortic stiffness leads to faster transmission of both waves; so, a reflected wave arrives earlier and causes a disproportionate increase in systolic pressure in late systole (3). Augmentation of the central aortic pressure wave is expressed as augmentation pressure (AP) in absolute terms. Augmentation index (AIx),
which is an indirect measure of arterial stiffness, is the AP as a percentage of central pulse pressure (PP) (4).
Bilirubin, the end product of heme catabolism, was recently recognized as an endogenous anti-inflammatory and anti-oxi-dant molecule. It has been revealed that bilirubin is a potent scavenger of reactive oxygen species, and it suppresses the oxidation of lipids and lipoproteins (5). Uric acid, which is gener-ated as the end product of purine metabolism in humans, has also been shown to play a key role in cardiovascular diseases, hypertension, and related conditions by inducing oxidative stress, inflammation, and endothelial dysfunction (6).
We aimed to investigate if there is any association between serum total bilirubin levels, serum uric acid levels, neutrophil-to-lymphocyte ratio (N/L), and arterial stiffness measured by PWV
and arterial wave reflection assessed by AIx in patients with a clinical diagnosis of coronary artery disease (CAD).
Methods
This cross-sectional study consisted of 145 consecutive patients who were admitted to our clinic with stable angina pec-toris (SAP) or acute coronary syndrome (ACS) and decided to undergo coronary angiography with a clinical diagnosis of CAD between October 2012 and May 2013. Eighty-three patients had SAP, which was defined as angina pectoris and/or angina equiva-lent symptoms suggestive of CAD, and they had either positive stress test results or other indications for coronary angiography. Twenty-nine patients had an unstable pattern of chest pain sug-gesting unstable angina pectoris (USAP) with or without ischemic electrocardiographic findings, and 33 patients were admitted with acute myocardial infarction (AMI). AMI was defined according to the latest universal definition of myocardial infarction (7).
Anthropometric parameters; past medical history; presence of hypertension, diabetes, and hyperlipidemia; smoking habits; family history of CAD; and medications were recorded for each patient. Blood samples were drawn from the antecubital vein at admission for complete blood count (Cell-Dyn 3700, Abbott, USA) and biochemistry analysis UniCell DxC 800, Beckman Coulter USA). Total white blood cell (WBC) count and differential leuko-cyte count were determined using an automated blood cell counter.
Selective left and right coronary angiography was performed through the femoral artery by standard Judkins technique with 6 Fr catheters (MediCath, Barcelona, Spain) using a GE Innova 4100 (GE Healthcare, Milwaukee, WI, USA).
Non-invasive pulse waveform analysis was performed on the day following coronary angiography with the commercially available SphygmoCor system (AtCor Medical, Sydney, Australia). Peripheral pressure waveforms were recorded from the radial artery, using applanation tonometry with a high-fideli-ty micromanometer. After the acquisition of 20 sequential wave-forms, a validated (8) generalized transfer function was used to generate the corresponding central aortic pressure waveform. Only high-quality recordings, defined as an in-device quality index of 80% and visually acceptable curves by the investigator, were included in the analysis. AP, AIx, and PP were recorded. Entire pulse wave analysis was performed in the sitting position under standardized conditions in the morning hours. Peripheral blood pressure measurements were performed with a validated automated arm blood pressure monitor (Omron M3W, Omron Healthcare), keeping the radial artery at the level of the heart. Blood pressure recordings were taken immediately prior to tonometric measurements. The average of two measurements taken at 5-minute intervals was recorded.
Carotid-femoral PWV was also assessed using the SphygmoCor device (AtCor Medical, Sydney, Australia) as previ-ously described (9). A measuring tape was used to measure the distance between the carotid and femoral artery recording
sites. PWV was calculated automatically by dividing this dis-tance by the time interval between the rapid upstroke in the pulse wave at the carotid and femoral arteries using the peak of the R wave on electrocardiography as a reference point.
Exclusion criteria were prior percutaneous or surgical revas-cularization; active infectious disease; inflammatory, autoim-mune, or connective tissue disease; severe renal disease; any hepatic disease; and rhythm other than sinus.
This cross-sectional study was conducted according to the recommendations of Declaration of Helsinki on Biomedical Research involving human subjects and was approved by the institutional ethics committee. Written informed consent was obtained from each participant.
Statistical analyses
SPSS statistical software (SPSS 15.0 for Windows, Inc., Chicago, IL, USA) was used for all statistical calculations. Kolmogorov-Smirnov test was used to test for normal distribu-tion. Continuous variables were given as mean±standard devia-tion and medians (interquartiles); categorical variables were defined as percentages. Continuous variables were compared by ANOVA and Kruskal-Wallis tests. Spearman’s correlation coefficient was used for the analysis of the correlation between AIx, PWV, N/L ratio, serum uric acid, and total bilirubin levels. Partial rank correlation coefficients were calculated using SPSS Syntax coding, adjusting for age, gender, height, heart rate, systolic blood pressure, and diabetes mellitus. For post hoc multiple comparisons where Bonferroni’s correction was applied, statistical significance was defined as p<0.017. Otherwise, p<0.05 was considered significant.
Results
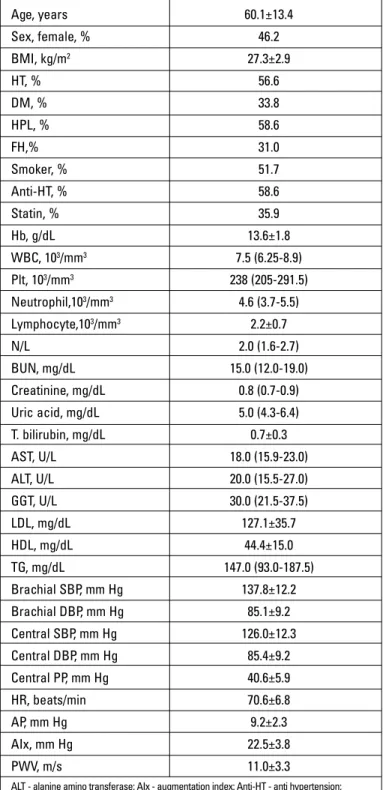
Baseline characteristics of the study population, including demographics, cardiovascular risk factors, medications, and hemodynamic data, are provided in Table 1. Mean age of the study population was 60.1±13.4 and the ratio of females was 46.2%. Seventy-two patients had significant CAD, defined as at least 50% stenosis in at least one epicardial coronary artery; 33 patients had minimal CAD, which meant CAD not fulfilling the criteria for significant CAD. Forty patients were found to have normal epicardial coronary arteries.
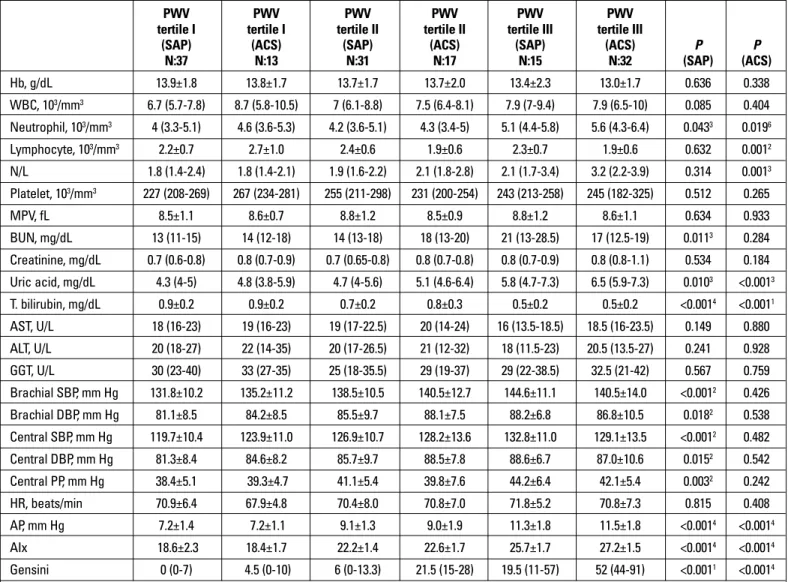
Tables 2 and 3 demonstrate the serum neutrophil, lympho-cyte counts, N/L ratio, serum uric acid levels, and total serum bilirubin levels detected by routine complete blood count and biochemistry analysis separately in SAP and ACS patients with respect to tertiles of PWV and Aix, respectively. Central and peripheral hemodynamic data are also given in these tables. N/L ratio and mean serum uric acid levels were the highest in the 3rd
tertile of PWV and AIx, both in SAP and ACS patients, whereas mean serum total bilirubin levels were the lowest. Normal refer-ence values were 1.8-7 mg/dL for serum uric acid and 0-1.4 mg/ dL for total serum bilirubin in our laboratory. Only two patients had out-of-range serum total bilirubin levels just above the upper
limit. Eighteen patients had high serum uric acid levels; 10 of them had values between 7-8 mg/dL, 5 patients had values between 8-9 mg/dL, and 3 patients had values between 9-10 mg/dL.
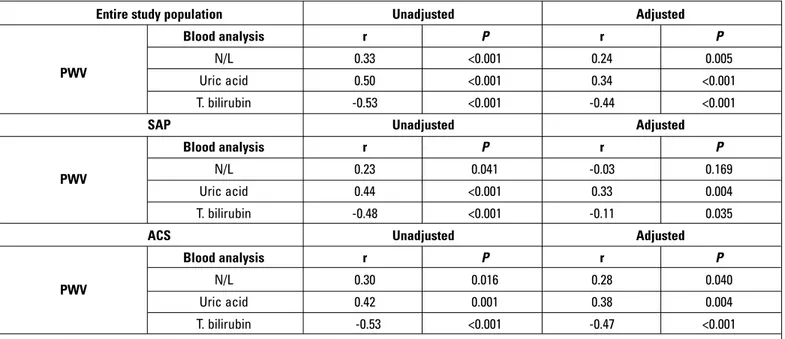
AIx and PWV were both positively associated with serum uric acid and N/L ratio and negatively associated with serum total
bili-rubin levels (Fig. 1, 2). The correlation analysis was repeated after adjustments for age, gender, heart rate, systolic blood pressure, and presence of diabetes, which could have affected the analysis. Significant associations were found to persist in the entire study population. However, when the analysis was performed separately for SAP and ACS patients, the significant correlations between PWV, Aix, and N/L disappeared in SAP patients. In addition, the relation between serum uric acid and AIx nearly lost its signifi-cance, and the association between serum total bilirubin and PWV was severely weakened in patients with SAP (Table 4a, b).
We also searched for the correlation between Gensini score, which shows the extent of CAD, and N/L ratio, serum uric acid, and total bilirubin levels. Higher N/L ratio and serum uric acid levels and lower total bilirubin levels were associated with higher Gensini scores (Table 5).
Age, years 60.1±13.4 Sex, female, % 46.2 BMI, kg/m2 27.3±2.9 HT, % 56.6 DM, % 33.8 HPL, % 58.6 FH,% 31.0 Smoker, % 51.7 Anti-HT, % 58.6 Statin, % 35.9 Hb, g/dL 13.6±1.8 WBC, 103/mm3 7.5 (6.25-8.9) Plt, 103/mm3 238 (205-291.5) Neutrophil,103/mm3 4.6 (3.7-5.5) Lymphocyte,103/mm3 2.2±0.7 N/L 2.0 (1.6-2.7) BUN, mg/dL 15.0 (12.0-19.0) Creatinine, mg/dL 0.8 (0.7-0.9) Uric acid, mg/dL 5.0 (4.3-6.4) T. bilirubin, mg/dL 0.7±0.3 AST, U/L 18.0 (15.9-23.0) ALT, U/L 20.0 (15.5-27.0) GGT, U/L 30.0 (21.5-37.5) LDL, mg/dL 127.1±35.7 HDL, mg/dL 44.4±15.0 TG, mg/dL 147.0 (93.0-187.5) Brachial SBP, mm Hg 137.8±12.2 Brachial DBP, mm Hg 85.1±9.2 Central SBP, mm Hg 126.0±12.3 Central DBP, mm Hg 85.4±9.2 Central PP, mm Hg 40.6±5.9 HR, beats/min 70.6±6.8 AP, mm Hg 9.2±2.3 AIx, mm Hg 22.5±3.8 PWV, m/s 11.0±3.3
ALT - alanine amino transferase; AIx - augmentation index; Anti-HT - anti hypertension; AP - augmentation pressure; AST - aspartate amino transferase; BMI - body mass index; BUN - blood urea nitrogen; DBP - diastolic blood pressure; DM - diabetes mellitus; FH - family history; Hb - hemoglobin; HDL - high-density lipoprotein; HPL - hyperlipidemia; HR - heart rate; HT - hypertension; GGT - gamma-glutamyl transferase; LDL - low-density lipoprotein; MPV - mean platelet volume; N/L - neutrophil-to-lymphocyte ratio; PP - pulse pressure; PWV - pulse wave velocity; SBP - systolic blood pressure; TG - triglyceride; WBC - white blood cell count
Table 1. Baseline characteristics of the study population
Figure 1. Scatterplot diagram demonstrating the relation between serum uric acid levels and augmentation index
2.00 4.00 6.00 8.00 10.00 12.00 uric acid, mg/dL augm ind (%) 30.00 25.00 20.00 15.00
Figure 2. Scatterplot diagram demonstrating the relation between serum total bilirubin levels and pulse wave velocity
0.00 0.50 1.00 1.50 T. bilirubin, mg/dL PWV 20.00 15.00 10.00 5.00 0.00
Discussion
In this cross-sectional study, we demonstrated that patients with increased arterial stiffness and arterial wave reflection had higher N/L ratio, higher serum uric acid levels, and lower serum total bilirubin levels both in stable and unstable clinical condi-tions. We report significant associations between N/L ratio, serum uric acid levels, PWV, and Aix, highlighting the role of inflammation on large vasculature. We also report significant negative correlations between serum total bilirubin levels, PWV, and Aix, which points to the antioxidant protective role of biliru-bin against arterial stiffening in patients with CAD. All of these associations persist in ACS patients after adjustments for pos-sible confounders, like age, gender, height, heart rate, systolic blood pressure, and diabetes mellitus.
Bilirubin has emerged as a novel biochemical tool, the higher physiological levels of which have been shown to be protective against coronary atherosclerosis. Lower levels were associated with overt CAD and stroke (10). It was also shown that total serum bilirubin levels were associated with the presence, severity, and extent of atherosclerotic plaques detected by cor-onary CT angiography in patients with known CAD (11), and this finding was also supported in the present study, reporting a significant negative correlation between total serum bilirubin and Gensini score. One step further, studies investigating the association between arterial stiffness and serum bilirubin levels have been conducted recently. Zhu et al. (12) showed that bra-chial-ankle PWV (baPWV) decreased with increased levels of total bilirubin in patients with CAD, and Li et al. (13) reported that total serum bilirubin concentration was negatively associated
PWV PWV PWV PWV PWV PWV tertile I tertile I tertile II tertile II tertile III tertile III
(SAP) (ACS) (SAP) (ACS) (SAP) (ACS) P P
N:37 N:13 N:31 N:17 N:15 N:32 (SAP) (ACS) Hb, g/dL 13.9±1.8 13.8±1.7 13.7±1.7 13.7±2.0 13.4±2.3 13.0±1.7 0.636 0.338 WBC, 103/mm3 6.7 (5.7-7.8) 8.7 (5.8-10.5) 7 (6.1-8.8) 7.5 (6.4-8.1) 7.9 (7-9.4) 7.9 (6.5-10) 0.085 0.404 Neutrophil, 103/mm3 4 (3.3-5.1) 4.6 (3.6-5.3) 4.2 (3.6-5.1) 4.3 (3.4-5) 5.1 (4.4-5.8) 5.6 (4.3-6.4) 0.0433 0.0196 Lymphocyte, 103/mm3 2.2±0.7 2.7±1.0 2.4±0.6 1.9±0.6 2.3±0.7 1.9±0.6 0.632 0.0012 N/L 1.8 (1.4-2.4) 1.8 (1.4-2.1) 1.9 (1.6-2.2) 2.1 (1.8-2.8) 2.1 (1.7-3.4) 3.2 (2.2-3.9) 0.314 0.0013 Platelet, 103/mm3 227 (208-269) 267 (234-281) 255 (211-298) 231 (200-254) 243 (213-258) 245 (182-325) 0.512 0.265 MPV, fL 8.5±1.1 8.6±0.7 8.8±1.2 8.5±0.9 8.8±1.2 8.6±1.1 0.634 0.933 BUN, mg/dL 13 (11-15) 14 (12-18) 14 (13-18) 18 (13-20) 21 (13-28.5) 17 (12.5-19) 0.0113 0.284 Creatinine, mg/dL 0.7 (0.6-0.8) 0.8 (0.7-0.9) 0.7 (0.65-0.8) 0.8 (0.7-0.8) 0.8 (0.7-0.9) 0.8 (0.8-1.1) 0.534 0.184 Uric acid, mg/dL 4.3 (4-5) 4.8 (3.8-5.9) 4.7 (4-5.6) 5.1 (4.6-6.4) 5.8 (4.7-7.3) 6.5 (5.9-7.3) 0.0103 <0.0013 T. bilirubin, mg/dL 0.9±0.2 0.9±0.2 0.7±0.2 0.8±0.3 0.5±0.2 0.5±0.2 <0.0014 <0.0011 AST, U/L 18 (16-23) 19 (16-23) 19 (17-22.5) 20 (14-24) 16 (13.5-18.5) 18.5 (16-23.5) 0.149 0.880 ALT, U/L 20 (18-27) 22 (14-35) 20 (17-26.5) 21 (12-32) 18 (11.5-23) 20.5 (13.5-27) 0.241 0.928 GGT, U/L 30 (23-40) 33 (27-35) 25 (18-35.5) 29 (19-37) 29 (22-38.5) 32.5 (21-42) 0.567 0.759 Brachial SBP, mm Hg 131.8±10.2 135.2±11.2 138.5±10.5 140.5±12.7 144.6±11.1 140.5±14.0 <0.0012 0.426 Brachial DBP, mm Hg 81.1±8.5 84.2±8.5 85.5±9.7 88.1±7.5 88.2±6.8 86.8±10.5 0.0182 0.538 Central SBP, mm Hg 119.7±10.4 123.9±11.0 126.9±10.7 128.2±13.6 132.8±11.0 129.1±13.5 <0.0012 0.482 Central DBP, mm Hg 81.3±8.4 84.6±8.2 85.7±9.7 88.5±7.8 88.6±6.7 87.0±10.6 0.0152 0.542 Central PP, mm Hg 38.4±5.1 39.3±4.7 41.1±5.4 39.8±7.6 44.2±6.4 42.1±5.4 0.0032 0.242 HR, beats/min 70.9±6.4 67.9±4.8 70.4±8.0 70.8±7.0 71.8±5.2 70.8±7.3 0.815 0.408 AP, mm Hg 7.2±1.4 7.2±1.1 9.1±1.3 9.0±1.9 11.3±1.8 11.5±1.8 <0.0014 <0.0014 AIx 18.6±2.3 18.4±1.7 22.2±1.4 22.6±1.7 25.7±1.7 27.2±1.5 <0.0014 <0.0014 Gensini 0 (0-7) 4.5 (0-10) 6 (0-13.3) 21.5 (15-28) 19.5 (11-57) 52 (44-91) <0.0011 <0.0014
AIx - augmentation index; ALT - alanine aminotransferase; AP - augmentation pressure; AST - aspartate aminotransferase; BUN - blood urea nitrogen; DBP - diastolic blood pressure; Hb - hemoglobin; HR - heart rate; GGT - gamma-glutamyl transferase; MPV - mean platelet volume; N/L - neutrophil-to-lymphocyte ratio; PWV - pulse wave velocity; SBP - systolic blood pressure; WBC - white blood cell count. 1- significant difference between PWV tertile I - PWV tertile III, PWV tertile II - PWV tertile III. 2- significant difference between PWV tertile I - PWV tertile II, PWV tertile I - PWV tertile III. 3: significant difference between PWV tertile I - PWV tertile III. 4: significant difference between PWV tertile I - PWV tertile II, PWV tertile I - PWV tertile III, PWV tertile II - PWV tertile III. 5: significant difference between PWV tertile I - PWV tertile II. 6: significant difference between PWV tertile II- PWV tertile III. p<0.05 is considered significant. For the parameters expressed in medians, Bonferroni’s correction is applied, and p<0.017 is considered significant
Table 2. Complete blood count and biochemical and hemodynamic analysis, including serum uric acid and total bilirubin levels, according to tertiles of PWV, separate for stable angina pectoris and acute coronary syndrome patients
with arterial stiffness assessed by non-invasive baPWV mea-surement in Chinese men.
There are possible mechanisms to explain the protective role of bilirubin against increased arterial stiffness. The bile pig-ments biliverdin and unconjugated and conjugated bilirubin exert their antioxidant role by the scavenging of peroxyl radi-cals, inhibition of membrane lipid peroxidation, and scavenging of reactive nitrogen species in vitro (14). Heme oxygenase, the catalytic enzyme of bilirubin, is the rate-limiting enzyme in the degradation of heme, which causes the formation of biliverdin, free ferrous iron, and carbon monoxide. It is suggested that heme oxygenase-1 (HO-1) and heme degradation products can attenuate complement-mediated inflammation and protect human vascular endothelium against complement-mediated injury and preserve vascular nitric oxide (15). In addition, it has
been recently shown that matrix metalloproteins, the overactiv-ity of which results in increased arterial stiffness, can be down-regulated by HO-1 (13).
There are studies that report uric acid as a determinant of arterial stiffness, partly independent from atherosclerosis risk fac-tors (16). Although the exact mechanism has not been elucidated, pro-oxidant effects, endothelial dysfunction through a decrease in nitric oxide production, and vascular and systemic inflamma-tion are mostly blamed (17). Hsu et al. (18) recently reported that uric acid was independently associated with arterial wave reflec-tion and central systolic blood pressure. Our findings are in accor-dance with previous studies relating uric acid with increased arterial stiffness and arterial wave reflection.
We also report higher N/L ratios with increasing stiffness indices, which supports the role of inflammation on vascular
AIx tertile AIx tertile AIx tertile AIx tertile AIx tertile AIx tertile
I (SAP) I (ACS) II (SAP) II (ACS) III (SAP) III (ACS) P P
n:35 n:13 n:35 n:15 n:13 n:34 (SAP) (ACS) Hb, g/dL 13.8±1.8 13.6±1.8 13.6±1.6 13.8±2.2 13.8±2.6 13.1±1.6 0.490 0.339 WBC, 103/mm3 6.6 (5.7-8.3) 8.1 (5.8-9.5) 7.4 (6.2-8.7) 7.4 (6.4-7.8) 7.9 (7.0-9.5) 8.2 (6.7-9.6) 0.062 0.393 Neutrophil, 103/mm3 3.9 (2.9-5.0) 4.6 (3.6-5.3) 4.4 (3.6-5.1) 4.3 (3.4-5.2) 5.1 (4.4-6.3) 5.5 (4.3-6.4) 0.0097 0.0346 Lymphocyte, 103/mm3 2.3±0.6 2.7±1.0 2.2±0.7 2.0±0.6 2.4±0.6 1.8±0.6 0.737 0.0022 N/L 1.7 (1.4-2.0) 1.7 (1.4-2.1) 1.8 (1.6-2.3) 2.1 (1.8-2.7) 2.2 (2.0-2.5) 3.3 (2.2-4) 0.0223 <0.0011 Platelet, 103/mm3 228 (209-271) 273 (261-281) 233 (211-286) 231 (206-261) 243 (213-299) 239 (181-320) 0.891 0.273 MPV, fL 8.7±1.1 8.5±0.7 8.7±1.1 8.7±1.1 8.7±1.4 8.5±1.0 0.996 0.842 BUN, mg/dL 13 (11-15) 15 (12-18) 15 (13-20) 18 (12.5-19) 17 (13-26) 17 (13-19) 0.0242 0.627 Creatinine, mg/dL 0.7 (0.6-0.8) 0.8 (0.7-0.8) 0.8 (0.7-0.9) 0.8 (0.7-0.9) 0.7 (0.6-0.8) 0.8 (0.7-1.1) 0.152 0.110 Uric acid, mg/dL 4.3 (3.9-4.8) 4.8 (3.8-5.6) 4.9 (4-5.9) 5.1 (4.8-5.9) 5.9 (4.8-7.3) 6.8 (5.8-7.7) 0.0023 <0.0011 T. bilirubin, mg/dL 0.9±0.2 0.9±0.2 0.7±0.2 0.8±0.3 0.5±0.3 0.5±0.2 <0.0014 <0.0011 AST, U/L 18 (16-23) 19 (16-23) 19 (16-22) 20 (14.5-24) 17 (13-20) 18.5 (16-25) 0.390 0.927 ALT, U/L 20 (17-28) 22 (14-35) 20 (16.5-26) 21 (14-30) 19 (13-24) 21 (13-17) 0.588 0.960 GGT, U/L 29 (21.5-36) 30 (27-34) 29 (19.5-37) 26 (16.5-34) 24 (22-39) 34.5 (23-43) 0.941 0.232 Brachial SBP, mm Hg 132±9.1 135.3±11.2 137.8±11.1 137.9±12 145.7±12.3 141.6±14 <0.0014 0.300 Brachial DBP, mm Hg 81.7±8.9 84.0±8.4 84.7±9.3 87.4±7.5 88.3±6.8 87.2±10.4 0.0643 0.537 Central SBP, mm Hg 120.1±9.4 124.0±11.1 126.1±11.5 125.7±12.9 133.5±12.3 130.1±13.6 0.0014 0.274 Central DBP, mm Hg 81.9±8.9 84.4±8.1 85.1±9.4 87.7±7.4 88.6±6.7 87.5±10.6 0.0583 0.561 Central PP, mm Hg 38.2±4.5 39.6±4.6 41.1±5.8 37.9±7.4 44.9±6.2 42.7±5.3 0.0014 0.0246 HR, beats/min 70.0±6.7 68.7±4.2 71.7±7.2 68.8±6.9 71.1±6.1 71.4±7.4 0.585 0.326 AP, mm Hg 6.9±1.1 7.3±1.1 9.2±1.2 8.4±1.5 11.7±1.6 11.6±1.6 <0.0014 <0.0014 PWV, m/s 7.7±1.6 7.2±1.1 10.8±1.7 11.4±1.8 14.2±2.0 14.6±1.6 <0.0014 <0.0014 Gensini 0 (0-5.5) 4.5 (0-10) 11 (3.3-13.8) 18.5 (15-24) 34 (10.5-68) 52 (44-90) <0.0012 <0.0014
AIx - augmentation index; ALT - alanine aminotransferase; AP - augmentation pressure; AST - aspartate aminotransferase; BUN - blood urea nitrogen; DBP - diastolic blood pressure; Hb - hemoglobin; HR - heart rate; GGT - gamma-glutamyl transferase; MPV - mean platelet volume; N/L - neutrophil-to-lymphocyte ratio; PWV - pulse wave velocity; SBP - systolic blood pressure; WBC - white blood cell count 1- significant difference between AIx tertile I - AIx tertile III, AIx tertile II - AIx tertile III. 2: significant difference between AIx tertile I - AIx tertile II, AIx tertile I - AIx tertile III. 3: significant difference between AIx tertile I - AIx tertile III. 4: significant difference between AIx tertile I - AIx tertile II, AIx tertile I - AIx tertile III, AIx tertile II - AIx tertile III. 5: significant difference between AIx tertile I - AIx tertile II. 6: significant difference between AIx tertile II- AIx tertile III. 7: significant difference between AIx tertile I - AIx tertile II, AIx tertile II-AIx tertile III. p<0.05 is considered significant. For the parameters expressed in medians, Bonferroni’s correction was applied, and p<0.017 is considered significant
Table 3. Complete blood count, biochemical and hemodynamic analysis, including serum uric acid and total bilirubin levels, according to tertiles of AIx, separate for stable angina pectoris and acute coronary syndrome patients
stiffness. Endothelial adhesion of inflammatory cells is an early step in the development of vascular disease and causes subse-quent local vascular inflammation (19). Stimulated leukocytes adhere and penetrate vascular intima more easily and release hydrolytic enzymes, growth factors, and cytokines, thus causing vascular damage (20). In addition, it was suggested that a higher N/L ratio indicated a higher ratio of sympathetic-to-parasympa-thetic activity, because adrenergic receptors are abundant on granulocytes, whereas cholinergic receptors predominate on lymphocytes (20). The sympathetic nervous system plays a
major role in the vascular tone by releasing neurotransmitters on arterial smooth muscle (21), and sympathetic overactivation is associated with endothelial dysfunction (22). Renal denerva-tion has recently been shown to cause a decrease in AIx inde-pendently of the blood pressure-lowering effects (23).
Significant associations between PWV, Aix, and N/L were found to disappear after adjustments according to possible con-founders in SAP patients in contrast to ACS. Inflammation is important in all stages of coronary atherosclerosis, and N/L has recently been shown to be significantly associated with more
Entire study population Unadjusted Adjusted
Blood analysis r P r P
N/L 0.38 <0.001 0.34 <0.001
AIx Uric acid 0.57 <0.001 0.46 <0.001
T. bilirubin -0.59 <0.001 -0.49 <0.001
SAP Unadjusted Adjusted
Blood analysis r P r P
N/L 0.27 0.014 0.16 0.187
AIx
Uric acid 0.48 <0.001 0.22 0.058
T. bilirubin -0.54 <0.001 -0.43 <0.001
ACS Unadjusted Adjusted
Blood analysis r P r P
N/L 0.36 0.014 0.37 0.005
AIx
Uric acid 0.53 <0.001 0.25 0.047
T. bilirubin -0.60 <0.001 -0.38 0.037
AIx - augmentation index; N/L - neutrophil-to-lymphocyte ratio; T. bilirubin - total bilirubin. P<0.05 is considered significant
Table 4a. Correlation coefficients for the association between augmentation index and neutrophil-to-lymphocyte ratio, serum uric acid, and total bilirubin levels, unadjusted and after adjustments for age, gender, systolic blood pressure, diabetes, heart rate, and height
Entire study population Unadjusted Adjusted
Blood analysis r P r P
N/L 0.33 <0.001 0.24 0.005
PWV Uric acid 0.50 <0.001 0.34 <0.001
T. bilirubin -0.53 <0.001 -0.44 <0.001
SAP Unadjusted Adjusted
Blood analysis r P r P
N/L 0.23 0.041 -0.03 0.169
PWV
Uric acid 0.44 <0.001 0.33 0.004
T. bilirubin -0.48 <0.001 -0.11 0.035
ACS Unadjusted Adjusted
Blood analysis r P r P
N/L 0.30 0.016 0.28 0.040
PWV
Uric acid 0.42 0.001 0.38 0.004
T. bilirubin -0.53 <0.001 -0.47 <0.001
N/L - neutrophil-to-lymphocyte ratio; PWV - pulse wave velocity; T. bilirubin- total bilirubin. P<0.05 is considered significant
Table 4b. Correlation coefficients for the association between pulse wave velocity and neutrophil-to-lymphocyte ratio, serum uric acid, and total bilirubin levels, unadjusted and after adjustments for age, gender, systolic blood pressure, and diabetes
extensive CAD both in SAP and ACS (24). In the present study, we also found a significant correlation between Gensini score and N/L, which is more powerful in ACS. In SAP, the inflamma-tory process is less active than in ACS, which is tentatively the reason why N/L loses its significance after correlations for PWV and AIx were adjusted for possible confounders.
Study limitations
The main limitation of this study is the cross-sectional design, which prevents us from inferring an exact mechanistic explanation for the relation between arterial stiffness and serum bilirubin, uric acid concentrations, and N/L ratio. In addition, arterial stiffness is influenced by hypertension, diabetes, and medications, which could confound the analysis. Especially, uric acid has a well-studied rela-tion with hypertension. However, we performed the appropriate statistical adjustments, considering the possible confounders that could lead to bias. Finally, this is a single-center study including a relatively limited number of patients. We did not have the opportu-nity to measure serum levels of other inflammatory markers, like hs-CRP, or more investigational biomarkers of inflammation, like interleukins, adhesion molecules, selectins, and TNF-α.
Conclusion
Although this study can not provide information about cau-sality, the hypothesis is that N/L ratio, serum uric acid, and bili-rubin levels might be used to further risk-stratify patients with CAD with respect to arterial wave reflection and arterial stiff-ness, especially in patients with ACS. Prospective large-scale studies may show if such an approach provides any clinical benefit in terms of predicting morbidity and mortality.
Conflict of interest: None declared. Peer-review: Externally peer-reviewed.
Authorship contributions: Concept - A.T., A.F.E.; Design - A.T., A.A.; Supervision - A.T., H.F.T.; Resource - H.F.T.; Materials - A.T., A.F.E.; Data collection &/or processing - A.T., A.A.; Analysis&/or Interpretation -
A.T., A.F.E.; Literature search - A.T.; Writing - A.T., A.F.E., H.F.T.; Critical review - A.T., A.F.E.; Other - A.A., H.F.T.
References
1. Stoner L, Young JM, Fryer S. Assessments of arterial stiffness and endothelial function using pulse wave analysis. Int J Vasc Med 2012; 2012: 903107.
2. Reference Values for Arterial Stiffness’ Collaboration. Determinants of pulse wave velocity in healthy people and in the presence of cardiovascular risk factors: ‘establishing normal and reference values’. Eur Heart J 2010; 31: 2338-50. [CrossRef]
3. Fantin F, Mattocks A, Bulpitt CJ, Banya W, Rajkumar C. Is augmen-tation index a good measure of vascular stiffness in the elderly? Age Ageing 2007; 36: 43-8. [CrossRef]
4. O’Rourke MF, Pauca A, Jiang XJ. Pulse wave analysis. Br J Clin Pharmacol 2001; 51: 507-22. [CrossRef]
5. Wu ML, Ho YC, Yet SF. A central role of heme oxygenase-1 in car-diovascular protection. Antioxid Redox Signal 2011; 15: 1835-46.
[CrossRef]
6. Kanbay M, Segal M, Afsar B, Kang DH, Rodriguez-Iturbe B, Johnson RJ. The role of uric acid in the pathogenesis of human cardiovascular disease. Heart 2013; 99: 759-66. [CrossRef]
7. Thygesen K, Alpert JS, Jaffe AS, Simoons ML, Chaitman BR, White HD; Joint ESC/ACCF/AHA/WHF Task Force for the Universal Definition of Myocardial Infarction, Third universal definition of myocardial infarction. Circulation 2012; 126: 2020-35. [CrossRef]
8. Pauca AL, O’Rourke MF, Kon ND. Prospective evaluation of a method for estimating ascending aortic pressure from the radial artery pressure waveform. Hypertension 2001; 38: 932-7. [CrossRef]
9. Delles C, Zimmerli LU, McGrane DJ, Koh-Tan CH, Pathi VL, McKay AJ, et al. Vascular stiffness is related to superoxide generation in the vessel wall. J Hypertens 2008; 26: 946-55. [CrossRef]
10. Oda E, Kawai R. A possible cross-sectional association of serum total bilirubin with coronary heart disease and stroke in a Japanese health screening population. Heart Vessels 2012; 27: 29-36. [CrossRef]
11. Canpolat U, Aytemir K, Yorgun H, Hazırolan T, Kaya EB, Şahiner L, et al. Association of serum total bilirubin levels with the severity, extent and subtypes of coronary atherosclerotic plaques detected by coronary CT angiography. Int J Cardiovasc Imaging 2013; 29: 1371-9. [CrossRef]
12. Zhu C, Xiong Z, Zheng Z, Chen Y, Chen X, Qian X. Association of arterial stiffness with serum bilirubin levels in established coro-nary artery disease. Intern Med 2012; 51: 2083-9. [CrossRef]
13. Li Y, Meng SY, Meng CC, Yu WG, Wang RT. Decreased serum biliru-bin is associated with arterial stiffness in men. Nutr Metab Cardiovasc Dis 2013; 23: 375-81. [CrossRef]
14. Basiglio CL, Arriaga SM, Pelusa F, Almará AM, Kapitulnik J, Mottino AD. Complement activation and disease: protective effects of hyperbilirubinaemia. Clin Sci (London) 2010; 118: 99-113. [CrossRef]
15. Pae HO, Son Y, Kim NH, Jeong HJ, Chang KC, Chung HT. Role of heme oxygenase in preserving vascular bioactive NO. Nitric Oxide 2010; 23: 251-7. [CrossRef]
16. Ishizaka N, Ishizaka Y, Toda E, Hashimoto H, Nagai R, Yamakado M. Higher serum uric acid is associated with increased arterial stiff-ness in Japanese individuals. Atherosclerosis 2007; 192: 131-7.
[CrossRef]
17. Sun N, Zhang Y, Tian JL, Wang H. Relationship between uric acid and arterial stiffness in the elderly with metabolic syndrome com-ponents. Chin Med J 2013; 126: 3097-102.
r P SAP N/L 0.296 0.007 Uric acid 0.565 <0.001 T. bilirubin -0.327 <0.001 r P ACS N/L 0.556 <0.001 Uric acid 0.646 <0.001 T. bilirubin -0.491 <0.001
N/L - neutrophil-to-lymphocyte ratio; T. bilirubin - total bilirubin. P<0.05 is considered significant
Table 5. Correlation coefficients for the association between Gensini score and neutrophil-to-lymphocyte ratio, serum uric acid, and total bilirubin levels
18. Hsu PF, Chuang SY, Cheng HM, Sung SH, Ting CT, Lakatta EG, et al. Associations of serum uric acid levels with arterial wave reflec-tions and central systolic blood pressure. Int J Cardiol 2013; 168: 2057-63. [CrossRef]
19. Ross R. Atherosclerosis--an inflammatory disease. N Engl J Med 1999; 340: 115-26. [CrossRef]
20. Park BJ, Shim JY, Lee HR, Lee JH, Jung DH, Kim HB, et al. Relationship of neutrophil-lymphocyte ratio with arterial stiffness and coronary calcium score. Clin Chem Acta 2011; 412: 925-9. [CrossRef]
21. Zacharia J, Mauban JR, Raina H, Fisher SA, Wier WG. High vascu-lar tone of mouse femoral arteries in vivo is determined by sympa-thetic nerve activity via α1A- and α1D-adrenoceptor subtypes. PLoS One 2013; 8: e65969. [CrossRef]
22. Tycinska AM, Mroczko B, Musial WJ, Sawicki R, Kaminski K, Borowska H, et al. Blood pressure in relation to neurogenic, inflam-matory and endothelial dysfunction biomarkers in patients with treated essential arterial hypertension. Adv Med Sci 2011; 56: 80-7.
[CrossRef]
23. Hering D, Lambert EA, Marusic P, Ika-Sari C, Walton AS, Krum H, et al. Renal nerve ablation reduces augmentation index in patients with resistant hypertension. J Hypertens 2013; 31: 1893-900. [CrossRef]
24. Tanındı A, Erkan AF, Ekici B, Alhan A, Töre HF. Neutrophil to lympho-cyte ratio is associated with more extensive, severe and complex coronary artery disease and impaired myocardial perfusion. Turk Kardiyol Dern Ars 2014; 42: 125-30. [CrossRef]