i
INVESTIGATION OF ELECTROCHROMISM PROCESS
THROUGH ULTRAFAST BROADBAND
SPECTROELECTROCHEMISTRY
A THESIS SUBMITTED TO
THE GRADUATE SCHOOL OF ENGINEERING AND SCIENCE
OF BILKENT UNIVERSITY
IN PARTIAL FULFILLMENT OF THE REQUIREMENTS FOR
THE DEGREE OF
MASTER OF SCIENCE
IN
CHEMISTRY
By
Musah Zakaria
January 2021
iii
ABSTRACT
INVESTIGATION OF ELECTROCHROMISM PROCESS
THROUGH ULTRAFAST BROADBAND
SPECTROELECTROCHEMISTRY
Musah Zakaria
M.S. in Chemistry
Advisor: Burak Ülgüt January 2021
Electrochromism is the reversible change in color of an electroactive material due to a redox reaction induced by the application of voltage. Electrochromic materials have gained much research attention since the discovery of organic conducting polymers in the late 1970s, with high prospects for diverse applications. Color change in electrochromic materials involves two processes. First, a redox reaction that leads to the oxidation or the reduction of the EC material. Then the intercalation of counter-ions into the material for charge balancing. For instance, to effect a color change in a neutral conducting polymer through oxidation, first, an oxidizing potential is applied and the polymer loses electrons in a heterogeneous electron transfer leading to a net positive charge creation. To achieve further oxidation, electroneutrality is partially
iv
restored by anions that diffuse from the bulk solution into the polymer. Since the diffusion rate of counter-ions is much slower than electron transfer, it is widely assumed that the oxidation process is rate-limited by ion transport.
The main aim of this work is to put this assumption to test. Relying on the fact that heterogeneous electron transfer is much faster than ionic charge transfer, experiments at very short time scales down to a few microseconds are performed. Under such experimental conditions, counter-ions do not have enough time to move into the electrochromic material and any sign of electrochromism is due to electron transfer. Through Ultrafast Cyclic Voltammetry with online iR compensation, sweep rates in the order of kV/s to MV/s are reached. We used thin films of poly(3,4-ethylenedioxythiophene) polystyrene sulfonate (PEDOT:PSS) used as the electrochromic material in this work. In monitoring the color change of the polymer film, we employ in situ UV-visible spectroscopy. To keep up with the rapid conversion of the polymer between its redox forms, we collect spectra in aggregate mode where several spectra are averaged into a single spectrum. By using a principal component analysis algorithm, the compound spectra are decomposed and we calculate the time that the polymer spends in each of its redox forms during the Ultrafast Cyclic Voltammetry experiments.
Keywords: Electrochromism, Conducting Polymers, Broadband Spectroelectrochemistry,
v ÖZET
YÜKSEK HIZLI GENİŞ BANT SPEKTROELEKTROKİMYA
ÖLÇÜMLERİ İLE ELEKTROKROMİZM SÜREÇLERİNİN
İNCELENMESİ
Musah Zakaria Kimya, Yüksek Lisans Tez Danışmanı: Burak Ülgüt
Elektrokromizm, elektrik potansiyeli uygulanmasıyla bir elektroaktif malzemedeki başlatılan
redoks reaksiyonu nedeniyle tersinir olarak renk değişimidir. 1970'lerin sonlarında iletken polimerlerin keşfiyle, elektrokromik malzemelerin üzerindeki araştırma ilgisi büyüdü ve çeşitli kullanım alanları gittikçe önem kazanıyor. Elektrokromik malzemelerdeki renk değişimi süreci iki basamakta gerçekleşir. İlk olarak, elektrokromik maddennin yükseltgenmesi veya indirgenmesin için bir redoks reaksiyonu ve ardından, karşı iyonların yük dengeleme için
difüzyon ile malzeme içerisine geçer. Örneğin, nötr bir iletken polimerin yükseltgenerek renk değiştirebilmesi için, önce uygun bir pozitif potansiyeli uygulanır. Polimer, heterojen elektron transferinden sonra elektronları kaybedip net bir pozitif yük kazanır. Oluşan bu pozitif yükü polimerin yükseltgenme devamlılığını engellenir. Bu pozitif yükü dengelemek için, çözeltiden
vi
çok yavaş olduğundan, oksidasyon işleminin iyon taşınmasıyla hız sınırlı olduğu yaygın bir şekilde varsayılmaktadır.
Çalışmanın temel amacı, bu varsayımı sorgulamaktır. Heterojen elektron transferinin iyon transferinden çok daha hızlı olduğu gerçeğine dayanarak, birkaç mikrosaniye kadar çok kısa zaman ölçeklerinde deneyler yapılmaktadır. Böyle kısa sürelerde, karşı iyonların elektrokromik malzemeye geçmesi için yeterli zaman olmayıp herhangi bir elektrokromizm belirtisi elektron transferinden kaynaklanmalıdır. Pozitif geri besleme direnç dengelenmesi eşliğinde yüksek hızlı dönüşümlü voltametri kullanarak, kV ila MV/s tarama hızlarına ulaşımaktadır. Bu çalışmada elektrokromik malzeme olarak poli (3,4-etilendioksitiofen) polistiren sülfonat (PEDOT:PSS) ince filmleri kullanılmaktayız. Polimer filmin renk değişiminin izlenmesinde, in situ UV-görünür spektroskopisi kullanılmaktayız. Polimerin redoks formları arasında çok hızlı dönüşülmekte olup, spektrumları ortalama modunda toplanmaktadır. Temel bileşen analiz algoritması kullanarak, bileşik spektrumları ayrıştırılır ve yüksek hızlı dönüşümlü voltametri deneyleri sırasında polimerin her bir redoks formundaki harcadığı zamanı hesaplanacak.
Anahtar Kelimeler: Elektrokrmizm, İletken Polimerler, Geniş bantlı Spektroelektrokimya,
vii
Acknowledgement
First and foremost, I am very grateful to Almighty Allaah for seeing me through this chapter of life.
I would like to express my deepest appreciation to Assist. Prof. Dr. Burak Ülgüt for his supervision, support, and patience throughout my master’s studies. I would like to thank Muhammed A. Zabara, Dr. Hamza Kahri, Can Berk Uzundal who helped me to learn the basic skills and techniques in electrochemical experimentation.
Special thanks to all my family members and friends who supported and encouraged me throughout my entire education. Also to my dear wife, Hafsat, whose encouragement has been very vital to me in all the difficulties I have encountered during this studies.
Finally, I acknowledge TÜBİTAK for providing financial support under the project number, 118Z739.
viii
TABLE OF CONTENT
CHAPTER 1
INTRODUCTION ... 1
1.1 General Overview ... 1
1.2 Conducting polymers (Conjugated Polymers) ... 1
1.3 Doping Mechanism in Conducting Polymers. ... 2
1.4 Electrochromism ... 4
1.4 Electrochemistry... 4
1.4.1 Electrode/Electrolyte Interface and the Electrical Double Layer ... 4
1.4.2 The Diffusion Layer ... 5
1.4.3 Chronoamperometry ... 6
1.4.4 Cyclic Voltammetry ... 7
1.4.5 Ultrafast Cyclic Voltammetry ... 8
1.5 Spectroscopy ... 12 1.5.1 Ultraviolet-Visible spectroscopy ... 12 1.5.2 Spectral Averaging ... 12 1.6 Spectroelectrochemistry ... 13 CHAPTER 2 ... 15 EXPERIMENTAL SECTION ... 15 2.1 Materials ... 15
2.2 Cleaning the electrodes ... 15
2.3 Cleanliness of the electrodes prior to the preparation of PEDOT:PSS thin films... 15
2.4 Preparation of PEDOT:PSS thin films ... 17
2.5 Stability of UV-Vis source ... 18
2.6 Spectroelectrochemical experiments. ... 19
2.7 Open Circuit Spectra ... 20
2.8 Potential Window and Spectro Cyclic Voltammetry at Conventional Sweep Rate ... 21
2.9 Stability of PEDOT and PEDOT:PSS films ... 21
2.10 Reversibility of color switching in the PEDOT:PSS films as a means for studying stability. ... 22
ix
2.12 Spectrochronoamperometry ... 25
2.13 Electrochemical Impedance Spectroscopy ... 25
CHAPTER 3 ... 26
3. RESULTS AND DISCUSSION ... 26
3.1 The redox forms of PEDOT:PSS and UV-Vis spectral curves averaging. ... 26
3.2 Suitable electrode for spectroelectrochemistry experiments on PEDOT:PSS films ... 26
3.3 Spectro cyclic voltammetry at sweep rates below 2V/s and spectrochronoamperometry experiments ... 29
3.3.1 Effect of the extent of the potential window on the reversibility of electroactivity and color switching in PEDOT:PSS thin films ... 30
3.3.2 Effect of sweep rate on the absorbance of PEDOT:PSS thin films ... 31
3.4 Ultrafast CV experiments on PEDOT:PSS thin films ... 34
3.5 Ultrafast spectroCV experiments ... 34
3.6 Principal Component Analysis (PCA) ... 36
3.6.1 Basis set spectra for PCA ... 36
3.6.2 Preliminary PCA results of ultrafast spectroCV spectra ... 39
CHAPTER 4 ... 42
CONCLUSION AND FUTURE WORK ... 42
4.1 Conclusions ... 42
4.2 Future work ... 43
x
LIST OF FIGURES
Figure 1. 1: The structure of the electrochemical double layer showing a) compact layer, b) the diffuse layer, and c) the bulk solution. WE denotes the working electrode ... 5 Figure 1. 2: (a) Potential steps applied in chronoamperometry experiments. (b) Current response in a typical chronoamperometry experiment. ... 6 Figure 1. 3: a) Applied potential in a cyclic voltammetric experiment; A, initial potential where there is usually no electrode reaction; B, voltage polarity switching point; C, potential at the end of the cycle. b) a typical cyclic voltammogram (i-E curve). Adapted from [47] ... 7 Figure 1. 4: Square scheme showing how electron transfer and ion transfers are coupled during redox switching in CPs [54] ... 9 Figure 1. 5: The effect of sweep rate on the position of the diffusion layer. Here, the electroactive species are conducting polymer molecules adsorbed on the surface of the working electrode. Adapted from [56]. ... 10 Figure 1. 6: The circuitry of the homemade potentiostat with an in-built iR compensation circuit (circled). ... 11 Figure 1. 7: Averaging of UV-Vis spectra as the sweep rate of the cyclic voltammetry experiments is increased. ... 13
Figure 2. 1: a) Cyclic voltammogram on a cleaned blank Pt mesh electrode in 0.5M H2SO4
aqueous solution at 100mV/s. b) Cyclic voltammogram at 20 mV/s on a blank FTO glass electrode. ... 16 Figure 2. 2: a) The current response and b) accompanying UV-Vis spectra in a spectrochronoamperometry experiment in 0.1 M in 0.1 M TBAClO4 in acetonitrile on a blank
FTO glass electrode coated with epoxy. In the chronoamperometry scan, potential steps of magnitudes: -0.6 and +0.6V were applied. ... 17
xi
Figure 2. 3: Schematic showing the procedure for preparing PEDOT:PSS thin film on an FTO electrode. Except for the electrode cleaning process, the same protocol is followed when working with a Pt mesh electrode ... 18 Figure 2. 4: UV-Vis spectra showing the variation in the intensity of radiation from spectrometer lamps over a 24hr period. a) Change in intensity when the lamps are first turned on at the onset of the experiments. b) The intensity of radiation over a 10hr period. ... 19 Figure 2. 5: Top: Schematic of the setup for spectroelectrochemical experiments showing the three-electrode electrochemical cell configuration. Bottom left: The actual experimental setup; the spectrometer is housed in a box to reduce interferences from stray light. Bottom right: A close view of the UV-Vis spectrometer with the ultrafast potentiostat ... 20 Figure 2. 6: Open circuit UV-Vis spectra of a 2 mm2 PEDOT:PSS film on an FTO glass electrode recorded at the onset of the SEC experiments. The set contains a total of 40 spectral curves each of which is an average of 2000 spectra. ... 22 Figure 2. 7: Spectro cyclic voltammetry results on a 2 mm2 PEDOT:PSS film showing the reversibility of color change. a) selected UV-Vis representing the most oxidized form (bleached state) and the most reduced form (colored state) of the PEDOT:PSS thin film during each the voltage scan cycle. b) Cyclic voltammogram of the PEDOT:PSS film c) Voltammogram expressed in time to show the time at which the polymer is most oxidized/reduced. ... 24
Figure 3. 1: The difference between spectra at a) 2 mV/s and b) 180 V/s spectro CV experiments. Each spectrum is an average of 2000 spectra. The spectra in the 2 mV/s experiment show the variation for reduction CV scan. The absorbance of the PEDOT:PSS film increases with increasing reduction potential peaking at ca. 650 nm. At the same time, the absorbance of the oxidized form decreases. ... 27 Figure 3. 2: Results from a 2 mm2 PEDOT:PSS film on a Pt mesh electrode. Up) spectro CV experimental results, the scan rate of CV is 20 mV/s. Down) spectrochronoamperometry experimental results, first -400 mV then +550 mV potential step each for 200s were applied ... 29
xii
Figure 3. 3: SpectroCV experimental results for determining an optimum potential window for a PEDOT:PSS film, CV was performed between a) -200 mV and +500 mV b) -550 and +650 mV... 31 Figure 3. 4: Spectrochronoampetrometry experimental results showing the 3 principal redox forms of PEDOT:PSS. a) applied potential steps: first, -600mV then +700mV. b) UV-Vis spectra representing the 3 principal redox forms of PEDOT:PSS. During the application of the negative potential step, absorbance increases in the reduced form of the polymer increases while it decreases for the oxidized form. During the positive potential step, a second oxidized form of the polymer is observed with decreasing absorbance in time. ... 33 Figure 3. 5: Cyclic voltammetry at different sweep rates on a blank FTO electrode. The currents in these voltammograms are purely capacitive. The area of the electrode in contact with the electrolyte is 4 mm2. ... 34 Figure 3. 6: Ultrafast spectroCV results. a) Cyclic voltammograms from a set of iR experiments. b) Corresponding UV-Vis spectra. There is an increase in current as sweep rate is increased. At ca. 600 nm and 1000 nm, the spectra show an increase and a reduction in absorbance respectively. ... 35 Figure 3. 7: Ultrafast spectroCV results. a) Cyclic voltammograms from a set of iR compensated experiments. b) Corresponding UV-Vis spectra. There is an increase in current as sweep rate is increased. At ca. 600 nm and 1000 nm, the spectra show an increase and a reduction in absorbance respectively. ... 36 Figure 3. 8: a) A collection of spectra obtained from a 2mV/s spectroCV experiment. b) basis set generated from the collection of spectra; curves 0, 1, and 2 represent the oxide state, the reduced state and the reduced state of PEDOT:PSS respectively... 37 Figure 3. 9: Spectro ultrafastCV of a PEDOT:PSS film on a 2mm2 FTO coated glass electrode the ultrafastCV were performed at: 200V/s, 4kV/s and 40kV/s (a,b; c,d; and e,f). Spectra a, c, and e were acquired with no iR compensation while b, d, and f with iR compensation. In all the sweep rates presented, the absorbance of the film reduces as the ultrafast CV scan proceeds. ... 40
xiii
LIST OF TABLES
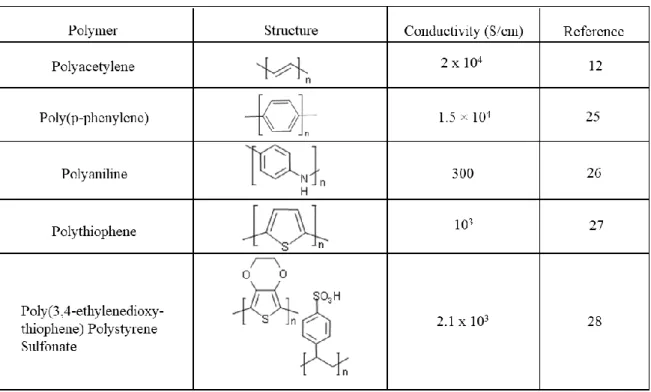
Table 1. 1 The molecular structures of some conducting polymers and their conductivities in the doped state. ... 2
Table 2. 1 The average potential at which the PEDOT:PSS film is most oxidized/reduced ... 23
Table 3. 1 The maximum absorbance of PEDOT:PSS films. ... 32 Table 3. 2: Coefficients of the spectra of the reduced and the oxidized towards the construction of the three principal components. ... 38 Table 3. 3: The coefficients of the ultrafastCV spectra at three different sweep rates with and without iR compensation... 41
xiv
LIST OF ABBREVIATIONS
CP: Conducting Polymer
CV: Cyclic Voltammetry
SEC: Spectroelectrochemistry
PEDOT:PSS: Poly(3,4-ethylenedioxythiophene) Polystyrene Sulfonate
UV-Vis: Ultraviolet-Visible Spectroscopy
TBAClO4: Tetrabutylammonium perchlorate
Ox: Oxidizable Species
Red: Reducible Species
ITO: Indium Tin Oxide
1 CHAPTER 1
INTRODUCTION
1.1 General Overview
Color changes arising from chemical reactions have fascinated scientists for many years. Usually reversible, such color changes are termed chromism and can be caused by chemical reactions initiated by an external stimulus such as temperature (thermochromism), electric field (electrochromism), solvent polarity (solvatochromism), and light (photochromism) [1,2]. Electrochromic materials gained increased research attention after the tunability that was brought by the discovery of conducting polymers by Shirakawa et al. [3-5]. Numerous improvements have been made in terms of stability, optical contrast, and electrical conductivity but the time for complete color change still ranges from seconds to some hundreds of milliseconds [6,7]. Most attempts made to shorten the color switching time have focused on the preparation of thinner and more porous films [8], the fabrication of composites, and the diffusion rates of various counterions [9,10]. This work approaches the issue by studying the two modes of charge transfer namely - electronic and ionic - that take place during electrochromism. Employing appropriate experimental techniques, experiments in time scales down to microseconds are performed. Since the heterogeneous electron transfer is much faster than ionic charge transfer, it implies that ions do not have enough time to diffuse into the polymer film. The short timescale of the experiment offers the ability to exclude any contribution of ionic charge transfer towards electrochromism. Thus electron transfer and ionic charge transfer are decoupled and studied independently.
1.2 Conducting polymers (Conjugated Polymers)
Conducting polymers (CPs) are a group of organic materials that were brought to light due to the work of Shirakawa et al. on polyacetylene [3]. Owing to alternating single and double bonds present in the chains of CPs, a conjugated system is formed. The π-electrons in the conjugated system are delocalized and thus serve as charge carriers for electrical conductivity. In their native form, CPs have low conductivities ranging from insulating to semiconducting but through doping even metallic level conductivities could be achieved [3,11-13]. Among the areas of application that CPs have gained prominence are secondary batteries [14,15],
2
electrochromic materials [16-20], artificial muscles [21-23]. Besides polyacetylene, many other conducting polymers have been discovered or synthesized with varying electrical conductivities.
Table 1. 1 The molecular structures of some conducting polymers and their conductivities in the doped state.
All conducting polymers are potentially electrochromic and in general offer high color contrast and an immense opportunity to fine tune the color via band gap modification [24]. Table 1.1 shows the molecular structures of some conducting polymers and their conductivities.
1.3 Doping Mechanism in Conducting Polymers.
The concept of doping in CPs is used analogously to doping in semiconductors (with n-type and p-type doping), though the doping processes in either type of material proceed with a different mechanism. Unlike semiconductor doping whereby an atom at a lattice site is replaced by a dopant atom that creates extra charge carriers, in doping a CP, first, the polymer matrix is
3
partially reduced/oxidized. This partial reduction or oxidation can be achieved by two different means: chemically through electron-donating species (for reduction) and electron-accepting species (oxidation) or electrochemically by the application of a suitable voltage. Considering oxidative doping of a CP, electron-accepting (electronegative) species like iodine (I2) is
introduced into the polymer matrix. The polymer loses electrons to the iodine atoms and gets oxidized (p-doped). The iodine atoms in turn become negatively charged and serve as counter-anions in the polymer matrix. On the other hand, electron-donating groups like metallic sodium can be used to partially reduce the polymer (n-doped) and the negative charge ensuing from the excess electrons in the polymer is countered by the Na+ ions. In both cases mentioned above, the counter-ions (dopants) are derived from the reducing/oxidizing agents though there are instances when the reducing/oxidizing agents and the dopants are chemically different. For example, Chiang et al. reported that when polyacetylene is placed in a solution of sodium naphthalide, the naphthalide anion serves as the reducing agent and Na+ is used as the counter-ion [29].
Another means for doping CPs is electrochemistry which is commonly used. Here, the polymer is first partially reduced/oxidized by the application of an electrical potential of relevant polarity. Take for instance the oxidation of a neutral CP; a positive potential is applied and the polymer loses electrons in a heterogenous electrons transfer and develops a net positive charge. Unlike in the chemical doping process outlined above, there are no readily available counter-ions in the matrix of the polymer. Therefore counter-ancounter-ions diffuse into the polymer to restore electroneutrality. Consider a CP thin film which is formed by deposition onto a working electrode surface. By the application of an appropriate oxidizing potential, the CP film becomes p-doped through the afore-discussed mechanism. The process of returning the polymer to its neutral form after oxidative doping is known as undoping. Undoping involves the application of a reducing potential that causes the polymer to accept electrons from the working electrode. The counter-anions that diffused into the polymer during the doping process are repelled from the polymer making the polymer neutral [30,31].
Doping a CP thin film electrochemically is of special interest in this thesis. In a full cyclic voltammetric scan, a CP film undergoes p-doping, undoping, and n-doping with counter-ions diffusing into or out of the polymer. The main focus of this work is to study the electrochromic behavior of a PEDOT:PSS thin film during ultrafast cyclic voltammetry whereby the duration for a full cycle of potential is far shorter than the time taken for the movement of ions in and out of the PEDOT:PSS film. The fabrication and optimization of optically transmitting and
4
electroactive thin films of PEDOT:PSS will be outlined in the second chapter of this thesis and the third chapter will present SEC experimental results on these films.
1.4 Electrochromism
Electrochromism is the reversible change in color of a material as a result of the application of an electrical potential typically via a reduction/oxidation (redox) reaction [32-35]. Since electrochromic materials absorb different wavelengths at different oxidation states, their optical properties can be tuned by applying a desired amount of voltage. Electrochromism is the underlying principle in the manufacturing of smart windows [36,37], anti-glare automobile rear mirrors [38], electrochromic display devices [39-42], and potentially, flexible color-changing textiles [43-45]. Electrochromic materials are classified into organic and inorganic. Inorganic electrochromic materials are mostly transition metal oxides whereas their organic counterparts fall into different classes of compounds. These include but not limited to conducting polymers, viologens, metallopolymers, and metallophthalocyanines [46].
1.4 Electrochemistry
1.4.1 Electrode/Electrolyte Interface and the Electrical Double Layer
In electrochemistry, species participating in a reaction do so by losing or gaining electrons. The electron transfer in an electrochemical reaction involves an electrode (usually a solid material and known as the working electrode) and electroactive species, usually present in an electrolyte solution. The electroactive species must be close enough to the electrode surface for a successful electron transfer to take place.
Consider an electrode dipped into an electrolytic solution. Upon the application of positive potential, negatively charged ions (along with some cations and solvent molecules) move to the electrode surface to counter the excess positive charge on the electrode. The movement of these ions constitutes a current that decays exponentially with time. This current is non-faradaic because it does not stem from an electron exchange. The presence of counter-ions at the electrode surface results in the formation of a layer of solution with a concentration different from the initial concentration – the bulk concentration – (to reflect the fact that electrolyte concentration stays unaffected a few nanometers beyond the surface of the electrode). This layer is termed as the electrochemical double layer or simply, the double layer. Reversal of the polarity of the applied voltage at the working electrode results in rearrangement of the double
5
layer with an accompanying current. The current that flows during the build-up of the double layer is termed the charging current. The behavior of the electrical double layer is analogous to that of a parallel plate capacitor and it is represented by a capacitor in equivalent circuit modelling. Figure 1.1 shows a model of the electrical double layer.
Figure 1. 1: The structure of the electrochemical double layer showing a) compact layer, b) the diffuse layer, and c) the bulk solution. WE denotes the working electrode
1.4.2 The Diffusion Layer
It has been mentioned in the previous section that electroactive species must move to the electrode/electrolyte interface before they can undergo reduction or oxidation. Assuming both Ox and Red (where Ox is a reducible species and Red is the reduction product) in equation 1.1 are soluble and there is no Red in the reaction medium before the application of voltage, upon the application of a reducing potential at the working electrode, the concentration of Ox in the region immediate to the electrode surface drops while the concentration of Red begins to rise. This leads to the creation of a layer of solution immediate to the surface of the electrode with different concentrations of Ox and Red than the initial concentrations in the bulk solution. This layer is known as the diffusion layer. The diffusion layer, unlike the electrical double layer described earlier, originates from chemical reactions taking place at the working electrode. The extent to which the diffusion layer grows into the electrolyte solution depends on the amount
6
of time of voltage application. In long experiments, it grows thicker into the solution while the converse holds for short experiments.
Ox + ne
⇌
Red (1.1)The time dependence of the thickness of the diffusion layer is a useful tool that is heavily relied upon in electrochemistry. A depiction of the diffusion layer is shown in figure 1.1 under the discussion of ultrafastCV.
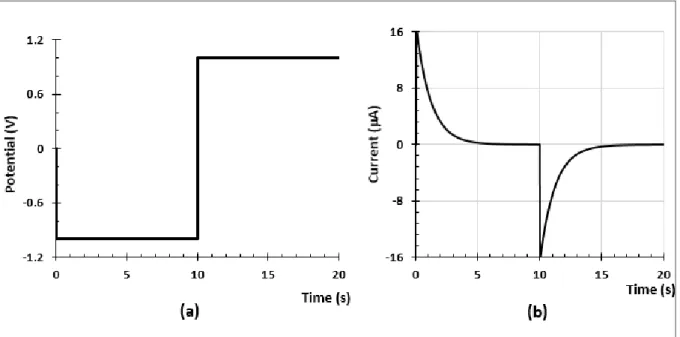
1.4.3 Chronoamperometry
Chronoamperometry is a simple yet very informative technique in electrochemistry. In chronoamperometry, a potential step as shown in figure 1.2(a) is applied at the working electrode and the current response in time is measured. The electrode at which the potential is applied is the working electrode. The potential of the working electrode is measured against a reference electrode. The reference electrode is a half-cell with a constant and known voltage which serves as the reference point for measuring the potential of the working electrode. The current behavior is described by the Cottrell equation shown in equation 1.2 [55] (Bard).
Figure 1. 2: (a) Potential steps applied in chronoamperometry experiments. (b) Current response in a typical chronoamperometry experiment.
7 𝑖(𝑡) =𝑛𝐹𝐴𝐶√𝐷
√𝜋𝑡 (1.2)
where;
n = number of electrons transferred F = the Faraday constant
A = area of the working electrode
C = bulk concentration of the electroactive species D = diffusion coefficient of the electroactive species
1.4.4 Cyclic Voltammetry
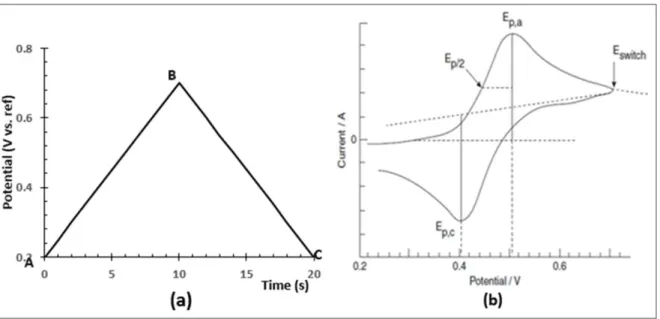
In cyclic voltammetry, an excitation potential that increases linearly is applied to a system while the current of the system is monitored. The applied potential is a triangular wave that is set to vary at a fixed amount per unit time. This constant potential variation in time is defined as the sweep rate, v. The magnitude of the sweep of a CV is determined from the slope of the applied potential ramp as seen in figure 1.3b.
Figure 1. 3: a) Applied potential in a cyclic voltammetric experiment; A, initial potential where there is usually no electrode reaction; B, voltage polarity switching point; C, potential at the end of the cycle. b) a typical cyclic voltammogram (i-E curve). Adapted from [47]
8
The magnitude of the applied potential at the working electrode reversible system is given in equation 1.3.
𝐸 = 𝐸𝑖+ 𝑣𝑡 (1.3)
Where:
Ei = initial voltage and t = time.
According to equation 1.3, the duration (or the timescale) of a CV experiment can be controlled by the magnitude of the sweep rate of the applied voltage. The ability to control the timescale in cyclic voltammetry by means of sweep rate thus gives us the power to tune the thickness of the diffusion layer. Information about reaction reversibility [48] of the electrode process, electron transfer kinetics [49], the presence of intermediate(s) in an electrochemical reaction [50] can all be determined through cyclic voltammetry.
1.4.5 Ultrafast Cyclic Voltammetry
Cyclic voltammetry is a versatile technique that has gained diverse use in many research areas. Its applicability is further extended when performed at sweep rates ranging from hundreds of volts per second to megavolts per second. Experiments at this range of sweep rate are termed ultrafast cyclic voltammetry (ultrafast CV). The implication of high sweep rates in ultrafast CV is that the potential perturbations (as shown in figure 1.3a above) are applied in very short timescales. This short timescale leads to the formation of a very thin diffusion layer at the electrode surface. Diffusion layers with thicknesses on the order of nanometers have been reported by Amatore et al. [51]. The short timescale and very thin diffusion layers characteristic of ultrafast CV allows the study of transient events that are occurring at nanometer scales. It is well established in the literature that electron transfer and ion transfer are coupled during electrochromism as shown in the square scheme in figure 1.4. There are few experimental attempts to study these two modes of charge transfer independent of each other. Liu et al. reported the effect of the transport of three different cations when a poly(3-octylthiophene) thin film is oxidized/reduced by CV [52]. Ion-selective membranes with ionophores for specific counter-ions (namely: Li+, Na+, and K+) were spin-coated onto the polymer film to control the type ion that can diffuse into the polymer matrix. In situ UV-Vis spectroscopy was used to
9
establish the effect of the different cations on the dynamic absorbance of the polymer film. Though their results show experimentally the electron transfer is coupled with ionic transfer during electrochromism, it is difficult to distinctively isolate them (electron and ion transfer) from each due to their experimental design.
Owing to the vast difference in the mobilities of electrons and ions [53], in ultrafast CV experiments on a CP film where the experimental time scale can be reduced down to microseconds (due to the high sweep rates achievable). Since counter-ions do not have enough time to reach the polymer on a s time scale only electron transfer takes place. Employing in situ UV-Vis spectroscopy as a complementary technique, these two modes of charge transfer can be decoupled and studied independently.
Figure 1. 4: Square scheme showing how electron transfer and ion transfers are coupled during redox switching in CPs [54]
In any electrochemical cell, there is a loss in voltage due to the resistance of the solution. Equation 1.4 shows that part of the applied potential is used to drive current through the solution in the electrochemical cell known as iR drop. At low sweep rates, the current through the solution is low which causes minimal losses in potential. At high sweep rates, however, large charging currents arise with significant iR drops that must be compensated for. The compensation for iR drop can be achieved by two methods. First, the magnitude of the iR drop is determined and added the measured electrode potential point-by-point. The second method and the more efficient way of correcting for iR drop in an electrochemical cell is an in-built
10
circuitry that can determine the quantity of potential loss and add it to the applied potential. This is known as on-line iR compensation and is described in detail in [55].
𝐸𝑎𝑝𝑝𝑙𝑖𝑒𝑑 = 𝐸𝑒𝑙𝑒𝑐𝑡𝑟𝑜𝑑𝑒/𝑒𝑙𝑒𝑐𝑡𝑟𝑜𝑙𝑦𝑡𝑒+ 𝑖𝑅𝑠𝑜𝑙𝑢𝑡𝑖𝑜𝑛 (1.4)
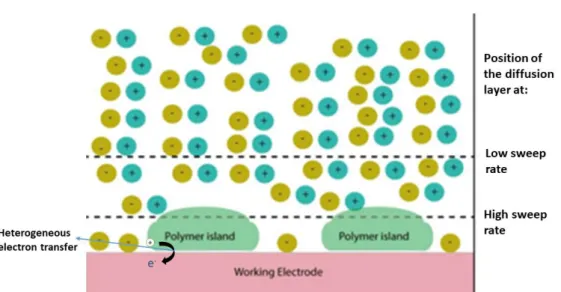
Another important factor that needs to be addressed in ultrafast CV is the dimensions of the electrodes. All ultrafast CV work reported in the literature so far used ultramicroelectrodes. Because potentials are swept very rapidly in ultrafast CV, RC time constants are very short. This gives rise to very huge charging currents that can be well beyond the current limit of the potentiostat being used in the experiment. In this work, the PEDOT:PSS thin films used have thicknesses in the micrometer range. During an ultrafast CV experiment at kV/s sweep rate, the diffusion layer that is formed is comparable to the thickness of the film. Counter-ions are therefore prevented from reaching the film as shown in figure 1.5. The schematic of the homemade potentiostat with an in-built circuitry that compensates for the ohmic potential drop due to solution resistance during ultrafast CV experiments is shown in figure 1.6.
ddd
Figure 1. 5: The effect of sweep rate on the position of the diffusion layer. Here, the electroactive species are conducting polymer molecules adsorbed on the surface of the working electrode. Adapted from [56].
11
Figure 1. 6: The circuitry of the homemade potentiostat with an in-built iR compensation circuit (circled).
12 1.5 Spectroscopy
1.5.1 Ultraviolet-Visible spectroscopy
Ultraviolet-Visible (UV-Vis) spectroscopy is a type of absorption spectroscopy used that employed for both qualitative and quantitative analytical studies. In terms of wavelength, the radiations used in UV-Vis spectroscopy range from 350 to 1050nm – covering the entire visible region and a portion of the near-infrared region. The energy in this region of the electromagnetic spectrum corresponds prominently to electronic transitions in transition metal complexes, π-conjugated organic polymers, and organic macromolecules such as proteins. In UV-Vis spectroscopy, a beam of incident radiation with intensity I0 is passed through a sample
(this could be a solution with a dissolved analyte or a thin film on a transparent substrate). After interacting with the sample, the intensity of the attenuated beam I is measured at a detector. The ratio, I/I0, termed as transmittance and denoted by T shows how much of the
incident beam emerges from the sample after interacting with the sample particles. By taking the logarithm of the ratio I0/I (the inverse of transmittance) absorbance of the sample is
determined. Absorbance expresses the amount of radiation that is absorbed by the sample.
𝐴 = log10𝐼0
𝐼 = 𝑙𝑜𝑔10 1
𝑇 (1.3)
1.5.2 Spectral Averaging
Considering the very high sweep rates at which ultrafast cyclic CV experiments are performed, the rate at which the polymer film is converted from one redox form to another could be very fast. For instance, it takes only 20s to complete a cycle in an ultrafast CV experiment performed at 50kV/s within a potential window of 1V. No commercial broadband UV-Vis spectrometer can record the quality of spectrum in such a short timescale. Therefore, to keep up with the rapid conversion rate (rate of color change), spectra are directly averaged into a compound spectral curve. This average is effectively a time weighted average of all the states that the film experienced during the experiment.
13
Figure 1. 7: Averaging of UV-Vis spectra as the sweep rate of the cyclic voltammetry experiments is increased.
1.6 Spectroelectrochemistry
The combination of an electrochemical technique with a spectroscopic technique to study a system is referred to as spectroelectrochemistry (SEC). A major advantage of SEC is the ability to simultaneously study the effect of charge transfer on the physical properties of materials such as optical absorption and nuclear magnetic resonance [57]. Pioneering work in SEC was carried out by McCreery and Robinson. Their study involved monitoring electro-generated chromophores [58]. They carried out their SEC experiments by focusing a laser beam on a carbon fiber ultramicroelectrode and collected the reflected light with a fiber optic probe. Since the electrodes in their work were not optically transmitting, absorption spectroscopy measurements were made in reflection mode.
SEC is uniquely suitable for studying the mechanism of charge transfer processes in electrochromic materials as the charge transfer process can be followed electrochemically as well as optically [59].
Transmission SEC was made possible by the development of optically transparent electrodes (OTEs). Metal meshes, glass coated with indium tin oxide (ITO), or fluorine-doped tin oxide (FTO) are among the most commonly used OTEs [60]. In terms of electrical conductivity, mesh electrodes are more advantageous but they offer less contact surface for thin films. ITO and FTO are both modified semiconductors. Unlike metal meshes, glass substrates coated with FTO or ITO are more convenient for thin film fabrication. ITO and FTO have comparable electrical conductivities. A study by Aouaj et al. showed that at similar film thickness, the surface resistivities of ITO and FTO were 8 × 10⁻⁴ and 6 × 10⁻⁴ Ω cm respectively [61]. In our case, fluorine-doped tin oxide coated glass electrodes (FTO) are employed. This choice is based on the fact that FTO is more thermally stable and transparent than ITO.
14
One of the main drawbacks in the work by McCreery and Robinson mentioned above is that a full absorption full spectrum was difficult to obtain since each SEC experiment was done at one wavelength. In our work,full spectra are measured by a fiber optic UV-Vis spectrometer while ultrafast CV experiments are conducted.
15 CHAPTER 2
EXPERIMENTAL SECTION
2.1 Materials
3,4-Ethylenedioxythiophene (EDOT, Sigma-Aldrich) Poly(3,4-ethylenedioxythiophene) polystyrene sulfonate (PEDOT:PSS, Sigma-Aldrich, 2-3%wt), Tetrabutylammonium perchlorate (TBAClO4,Sigma-Aldrich, 99.0%, electrochemical grade) Acetonitrile
(Sigma-Aldrich, 99.9%, analytical grade), 3,4-Ethylenedioxythiophene (EDOT), (Sigma-Aldrich), fluorine-doped tin oxide coated glass electrode (FTO electrode) (Aldrich) Silver wire (Alfa Aesar, 1.0mm in diameter, 99.9%) platinum wire (Alfa Aesar, 0.25mm diameter, 99.9%) and platinum mesh (Sigma-Aldrich) were obtained and used with no chemical modification unless otherwise stated.
2.2 Cleaning the electrodes
For the Pt mesh electrode, to remove any old film, (if it has been previously used) it is heated in a 3 M NaOH solution for 1 hour and then heated in de-ionized water (resistivity of 18.2 MΩ∙cm) for 10 hours at near boiling point. Then it is dried in an oven at 60 0C before usage.
The FTO coated glass electrodes are cleaned through ultrasonication in the sequence: first, in de-ionized water, in isopropyl alcohol, and then in acetone for 10 minutes each.
2.3 Cleanliness of the electrodes prior to the preparation of PEDOT:PSS thin films
It is important to ascertain that the surfaces of the electrodes are clean before the preparation of thin films of PEDOT:PSS and the subsequent performance of any experiment. After cleaning the Pt mesh electrodes (through the protocol above), they are used to perform cyclic voltammetry in 0.5 M H2SO4 aqueous solution. The voltammogram obtained from this
experiment should feature peaks for H adsorption-desorption and oxide formation-reduction characteristic of a polycrystalline Pt surface as described in [62-64]. This indicates the efficacy of the procedure used for cleaning the Pt mesh electrodes. The FTO coated glass electrodes (after coating with epoxy) are subjected to a spectrochronoamperometry and spectro CV scan in 0.1 M TBAClO4 in acetonitrile.
16
Figure 2. 1: a) Cyclic voltammogram on a cleaned blank Pt mesh electrode in 0.5M H2SO4 aqueous
solution at 100mV/s. b) Cyclic voltammogram at 20 mV/s on a blank FTO glass electrode.
The voltammogram shows only capacitive current during the forward and reverse scan and most importantly the corresponding UV-Vis spectra show no variation in absorbance during the chronoamperometry scan on the blank FTO electrode. The lack of color change on the blank electrode proves that any variations in absorbance during the SEC experiments are due to the PEDOT:PSS films. Figures 2.1 and 2.2 present the results of experiments performed to establish the purity of electrodes’ surfaces.
17
Figure 2. 2: a) The current response and b) accompanying UV-Vis spectra in a spectrochronoamperometry experiment in 0.1 M in 0.1 M TBAClO4 in acetonitrile on a blank FTO
glass electrode coated with epoxy. In the chronoamperometry scan, potential steps of magnitudes: -0.6 and +0.6V were applied.
2.4 Preparation of PEDOT:PSS thin films
PEDOT:PSS films were made through spin coating (on only FTO glass) and drop-casting (on both FTO and platinum mesh electrode). The procedure for the film fabrication according to the method of preparation is given below.
For both the Pt mesh and FTO glass electrodes, PEDOT:PSS films were made by drop-casting. For the Pt mesh electrode, the PEDOT:PSS dispersion was used as supplied without dilution. In the case of the FTO, the concentration of the dispersion was diluted by the addition of 2 parts deionized water to 3 parts PEDOT:PSS to ensure optimal optical transmittance. Drying
18
of the film is carried out in two stages: first, under atmospheric conditions then followed by baking at ca. 80 – 900C in an inert environment created by nitrogen gas stream for approximately 30 minutes. The baked film is then kept in an electrolyte solution, purged with nitrogen gas, to allow diffusion of ions into the film for the improvement of color switching contrast. Figure 2.3 illustrates the protocol followed for preparing a film on an FTO glass electrode.
Figure 2. 3: Schematic showing the procedure for preparing PEDOT:PSS thin film on an FTO electrode. Except for the electrode cleaning process, the same protocol is followed when working with a Pt mesh electrode
2.5 Stability of UV-Vis source
The change in absorbance as a function of sweep rate in the spectro ultrafast CV experiments is minute, therefore any factor that can cause a variation in absorbance should be eliminated or kept at bay. One such factor is the change in the intensity of the UV-Vis spectrophotometer lamps (a deuterium lamp and a tungsten lamp). To study the stability of the radiation sources, the output of the lamp was recorded for 24 hours with no electrochemical cell in the sample holder. The results from this experiment show that it takes about 1 hour 30 minutes for the intensity of the lamps to stabilize after turn on. After that, it stays stable for about 10 hours. Figure 2.4 details the changes observed in the intensity of radiation from the spectrometer sources.
19
Figure 2. 4: UV-Vis spectra showing the variation in the intensity of radiation from spectrometer lamps over a 24 hour period. a) Reduction in intensity of radiation when the lamps are first turned on. b) The intensity of radiation over a period of 10 hours.
2.6 Spectroelectrochemical experiments.
All electrochemical experiments except for the ultrafast cyclic voltammetry experiment were performed with Gamry Interface 1000E potentiostat. In situ UV-Visible measurements were performed with Gamry UV-Visible fiber-optic spectrophotometer (Gamry Instruments) in a 12.5x12.5x45mm UV-Vis quartz cuvette (ISO LAB, “es quartz”). 2000 spectra were averaged for each plotted spectrum. Ultrafast Cyclic Voltammetry experiments were carried out with a homemade potentiostat. All experiments were performed in 0.1M TBAClO4 in acetonitrile.
20
Figure 2. 5: Top: Schematic of the setup for spectroelectrochemical experiments showing the three-electrode electrochemical cell configuration. Bottom left: The actual experimental setup; the spectrometer is housed in a box to reduce interferences from stray light. Bottom right: A close view of the UV-Vis spectrometer with the ultrafast potentiostat
2.7 Open Circuit Spectra
UV-Vis spectra are collected under no potential bias for 30 minutes. These spectra give information about the stability of the polymer film and show the range of wavelengths that can be reliably used during data analysis.
21
2.8 Potential Window and Spectro Cyclic Voltammetry at Conventional Sweep Rate
Cyclic voltammetry experiments at low sweep rate were performed on prepared films (PEDOT or PEDOT:PSS) for two purposes. Firstly, to determine the potential window for the film in hand (mostly at a sweep rate of 20 mV/s). Secondly, CV experiments at sweep rates ranging from 1 mV/s to 1.5 V/s were performed with in situ UV-Vis spectroscopy to follow electrochromic color changes in the polymer films.
Both the potential window determination experiments and the slow Spectro CV experiments were performed in three-electrode mode. To ensure that no water is introduced to the electrochemical cell, a silver wire was used as a quasi reference electrode [55] and graphite as the counter electrode.
2.9 Stability of PEDOT and PEDOT:PSS films
Though most organic polymers are known to be remarkably stable, most CPs undergo degradation easily. The alternating double bonds that form the conjugation systems in CPs can undergo irreversible oxidation in the presence of atmospheric oxygen at slightly elevated temperatures or even at ambient temperature in the case of polyacetylene. Work by Evangelos et al. showed that when PEDOT:PSS films are heated in air, they undergo degradation and show a reduction in electrical conductivity [65]. To avoid this thermal degradation, PEDOT:PSS films should be dried in an inert environment after drop-casting.
Another important factor that affects the stability of PEDOT:PSS films is voltage. According to Kamensky et al. subjecting PEDOT films to potentials between 1.3 to 1.5V (vs. Ag/AgCl reference) leads to oxidation. Over-oxidation of PEDOT (or any PEDOT based conducting polymer) involves the conversion of the sulfur atom in the thiophene ring into SO2 and thus the
breakage in conjugation in the polymer backbone chain [66].
Since the variation in absorbance as a function of sweep rate in the order of kV/s is very small, the spectra of a film at open circuit should stay constant. At the onset of the experiments, open circuit spectra are taken for at least 30 minutes. If there is variation in absorbance, the cell is allowed to stand for about 1 hour then open circuit spectra are taken again. Also during the course of spectro ultrafast CV experiments, open circuit spectra are taken after each measurement at a particular sweep rate to ensure the film is stable. Figure 2.6 shows the open
22
circuit spectra of a 2 mm2 PEDOT:PSS film on an FTO electrode before slow spectro CV experiments were performed.
Figure 2. 6: Open circuit UV-Vis spectra of a 2 mm2 PEDOT:PSS film on an FTO glass electrode recorded at the onset of the SEC experiments. The set contains a total of 56 spectral curves each of which is an average of 2000 spectra.
The spectra in figure 2.6 show no significant variation in absorbance between 450 nm and 950 nm. This range of wavelengths is therefore the reliable region for analyzing spectra from the spectro ultrafast CV experiments.
2.10 Reversibility of color switching in the PEDOT:PSS films as a means for studying stability.
The very definition of electrochromism requires that the color change in any material that can be classified as electrochromic should be reversible. The reversibility of color change in an electrochromic material gives information about the stability of that material. Stable electrochromic materials can be oxidized and reduced many times without breaking down. PEDOT:PSS is one of the organic electrochromic materials that show remarkable stability under ambient conditions. Using routine electrochemical techniques such as cyclic voltammetry in conjunction with UV-Vis spectroscopy, the stability of PEDOT:PSS films can be studied. A stable film shows a constant degree of color change (constant absorbance) over
23
many cycles during slow spectro CV experiments. The spectra presented in figure 3.3 are from a 2 mV/s spectro CV experiment. The oxidized and the reduced spectra represent the most bleached and the most colored forms of the polymer respectively.
According to figure 2.7b, the change in color of the films is periodic. The experiment was done with a potential window of 1.3 V at a sweep rate of 2 mV/s. At this sweep rate, it takes 1300 s for a full potential sweep to be completed. The UV-Vis spectra in figure 2.7b below represent the most oxidized and the most reduced forms of the polymer. It must take approximately 650 s (half the duration for a complete potential sweep) for the film to move from the most oxidized state to the most reduced state. This means that for the color change in the film to be reversible, the time taken for the polymer to return to any initial color state should be 1300 s. The time difference between the most colored state and the most bleached state is ca. 656 s. Also, the time-lapse between any two spectra representing the bleached state is about 1311 s and the same holds for the colored state spectra. There is a very good agreement between the expected time lapses between spectra and the time lapses between the measured spectra.
The slight difference observed is due to a 1 s delay between the measurement of spectra during the experiment. Figure 2.7c shows the potential scan in time. By correlating the time at which the spectra were recorded to the time scale of the voltammetric scan, the potentials at which the polymer was most oxidized/reduced can be determined. Table 2.1 shows the time the corresponding potentials at which the spectra for most oxidized/reduced forms of the polymer were recorded. Colored voltage
Cycle of CV experiment Most colored at (s) Colored voltage (mV) Most colored at (s) Bleached voltage (mV) 1st 542 -440.5 1220 684.0 2nd 1853 -419.0 2486 752.0 3rd 3165 -395.0 3884 678.0 Average = -417.2 Average = 705
24
Figure 2. 7: Spectro cyclic voltammetry results on a 2 mm2 PEDOT:PSS film showing the reversibility
of color change. a) selected UV-Vis representing the most oxidized form (bleached state) and the most reduced form (colored state) of the PEDOT:PSS thin film during each the voltage scan cycle. b) Cyclic voltammogram of the PEDOT:PSS film c) Voltammogram expressed in time to show the time at which the polymer is most oxidized/reduced.
25 2.11 Ultrafast Spectro Cyclic Voltammetry
Ultrafast cyclic voltammetry experiments of sweep rates up to the order of kV/s were performed by using a custom-built potentiostat. Tektronix AG1022 function generator was used to generate the applied triangular potential wave and the response signals were followed by a Tektronix DPO 2002B Digital Phosphor Oscilloscope. The same cell used in slow CV experiments was used for the ultrafast CV experiments. Raw data of ultrafast voltammograms were collected from the oscilloscope and plotted with an open source python 3.8 software package.
2.12 Spectrochronoamperometry
Spectrochronoamperometry experiments were performed to study the behavior of the polymer films during extended periods of applied potential. Two potential steps were applied for the duration; first, a negative potential to reduce the film followed by a positive potential step to oxidize. The potential steps applied are chosen from the potential values of a voltammogram obtained from a potential window determination experiment.
2.13 Electrochemical Impedance Spectroscopy
Electrochemical impedance spectroscopy (EIS) measurements of the cell allow for the determination of parameters such as the solution resistance, film capacitance, and electron transfer resistance. These parameters can be used to create a model of the electrochemical cell for simulation purposes. EIS experiments were performed in potentiostatic mode from 0.1 to 1000Hz on Gamry Interface 1000E potentiostat.
26 CHAPTER 3
3. RESULTS AND DISCUSSION
3.1 The redox forms of PEDOT:PSS and UV-Vis spectral curves averaging.
Besides its principal redox forms namely, reduced, neutral and oxidized forms, PEDOT:PSS exhibits numerous intermediates forms. With spectro CV experiment at low sweep rate, numerous intermediate forms of PEDOT:PSS become spectroscopically visible. UV-Visible spectra of PEDOT:PSS films show distinct spectra representing the various redox forms but beyond 50mV/s (dependent on the potential window and the number of spectra that are set to be averaged) the spectra get averaged into indistinguishable curves. Figure 3.1 shows the distinction between the UV-Visible spectra of PEDOT:PSS films at low sweep and high sweep rates.
3.2 Suitable electrode for spectroelectrochemistry experiments on PEDOT:PSS films
As mentioned earlier in section 1.6, one major requirement for a spectroelectrochemical experiment is the availability of optically transparent electrodes (OTEs). For absorption spectroelectrochemistry, the commonly used OTEs are metal meshes, fluorine-doped tin oxide coated glass (FTO) and indium tin oxide coated glass (ITO). Metal meshes have the advantage of high electrical conductivity but they are difficult to form thin films on. FTO and ITO glass electrodes, on the other hand, have low electrical conductivity but they are easy to be used as a substrate for the fabrication of thin films. Though ITO glass electrodes have higher conductivity than FTO glass, FTO is more transparent than ITO. It is therefore more advantageous to choose FTO coated glass electrodes.
Thin films of PEDOT:PSS with a surface area of 4 mm2 on platinum mesh electrodes show color change in both spectroCV and spectrochoronoamperometry experiments. Films of surface area below 2 mm2 on a Pt mesh though demonstrate a change in color visually, they tend to be undetectable by the UV-Vis spectrometer during the spectroelectrochemistry experiments.
27
Figure 3. 1: The difference between spectra at a) 2 mV/s and b) 180 V/s spectro CV experiments. Each spectrum is an average of 2000 spectra. The spectra in the 2 mV/s experiment show the variation for reduction CV scan. The absorbance of the PEDOT:PSS film increases with increasing reduction potential peaking at ca. 650 nm. At the same time, the absorbance of the oxidized form decreases.
Figure 3.2 shows the results from a spectroCV and a spectrochronoamperometry experiment. Considering the spectra from both experiments, it is obvious that the change in absorbance is a mere shift in the position of the spectra and not from a color change taking place in the film due to a redox reaction.
28
This shift can be attributed to the movement of the Pt mesh electrode mechanically during a change in voltage polarity in both experiments. There is thus a minimum spectroscopic limit on the film area that is detectable by the UV-Vis spectrometer.
Another setback posed by PEDOT:PSS films fabricated on Pt mesh electrode is the current limit of the potentiostat used for the ultrafast CV experiments. Films with a surface area of 2 mm2 reach the current limit (40 mA) at ca. 2 kV/s. To achieve higher sweep rates, the film size
should be reduced. But the reduction in size below 2 mm2 renders color change undetectable
by the spectrometer. The undetectability of color changes in the small PEDOT:PSS film could be due to the sample not being in the light path.
PEDOT:PSS thin films on FTO glass electrodes on the other hand show better color change detection in comparison with films on a Pt mesh electrode. This is due to the ease with which the film position in the light path can be controlled and the fact that the FTO glass is transparent and thus causes minimal optical interference to the incident UV-Vis beam even in films below 2 mm2. The main issue with an FTO coated glass electrode is the low level of electrical conductivity. To improve the conductivity of the FTO coated glass electrode and reduce the excessive charging current that arises due to the exposed surface of the electrode, an FTO/Ag wire composite electrode was fabricated.
A pre-defined area for the PEDOT: PSS thin film is inscribed on the FTO glass, the glass is cleaned according to the cleaning protocol elaborated in chapter 2. Then the PEDOT:PSS film is formed by drop-casting and dried through the drying process (also described in chapter 2). A locally purchased epoxy resin is then used to cover the exposed area of the FTO glass. Color changes in PEDOT:PSS films on the FTO/Ag wire composite electrode are detectable and sweep rates up to 100 kV/s can be achieved without reaching the current limit of the potentiostat.
29
Figure 3. 2: Results from a 2 mm2 PEDOT:PSS film on a Pt mesh electrode. Up) spectro CV experimental results, the scan rate of CV is 20 mV/s. Down) spectrochronoamperometry experimental results, first -400 mV then +550 mV potential step each for 200s were applied
3.3 Spectro CV at sweep rates below 2 V/s and spectrochronoamperometry experiments
SpectroCV experiments at sweep rates below 2 V/s in this work are classified as slow whereas those performed at 2V/s and beyond are classified as ultrafast CV experiments. The slow CV experiments were performed on a Gamry Interface 1000 potentiostat and the ultrafast CV experiments were performed on a homemade potentiostat. The slow CV experiments are carried out for three main reasons namely
:
to (i) determine a workable and safe potential window for the spectro CV and spectrochronamperometry experiments, to (ii) ascertain that there is a reversible color change in the PEDOT:PSS films, and to (iii) obtain a group of UV-Vis spectra representing as many color states of the polymer as possible to form basis sets for principal component analysis of averaged spectra from the ultrafast spectro CV experiments. Another significance of the slow experiments is the establishment of the relationship between the sweep rate and the absorbance of the PEDOT:PSS films. Results for the reversibility of color change have been presented in section 2.10 under the discussion of the stability of the PEDOT:PSS film30
3.3.1 Effect of the extent of the potential window on the reversibility of electroactivity and color switching in PEDOT:PSS thin films
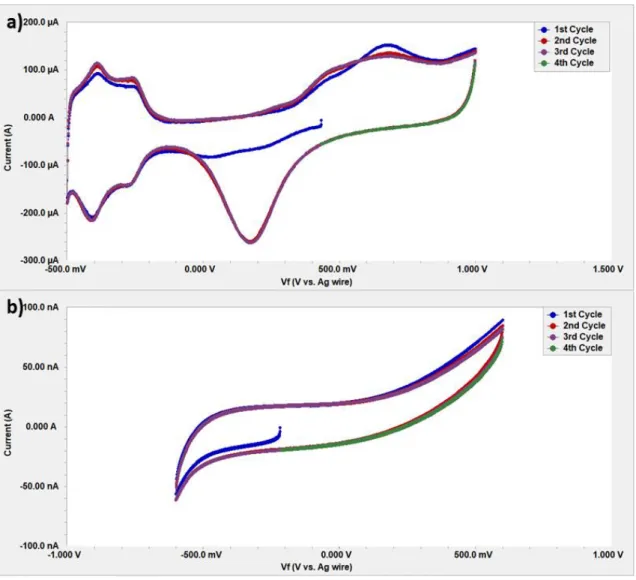
The PEDOT:PSS films used in this work are prepared by drop-casting. It is very difficult to obtain the same thickness for any two films through this method. Therefore each film has a different potential window within which it gets sufficiently reduced/oxidized for an appreciable level of color contrast to be obtained. However, a general potential window from -600 to +800mV can be deduced since all films were made from PEDOT:PSS. Kamensky et al. reported that PEDOT films when subjected to a potential of 1.3 to 1.5 (vs. g/AgCl) in a cyclic voltammetric scan, get over-oxidized [36]. During the process of over-oxidation, there is a sharp increase in anodic current in the first cycle. In subsequent cycles, the current drops signaling a reduction in electroactivity and the degradation of the polymer. The foregoing discussion suggests that PEDOT based conducting polymer films should not be subjected to extreme positive potentials. Results from potential window determination experiments in this work however show that to achieve reversibility in the redox activity (and color switching) in PEDOT:PSS films, the extremes of the potential should be extended to a point where the anodic and the cathodic currents just begin to increase sharply. The cyclic voltammograms and UV-Vis spectra in figure 3.3 demonstrates the effect of the extent of the potential window on the reversibility of electroactivity and color change in PEDOT:PSS films.
From figure 3.2a, the oxidization and reduction peaks occur at ca. +450 mV and +200 mV (vs. Ag quasi reference electrode) respectively. To avoid possible degradation of the film, it is intuitively correct to limit the potential window to a few millivolts from the positions of the oxidation/reduction peaks. Contrary to expectation, as shown in figure 3.3b, when the potential window is reduced, the polymer film shows no electroactivity. The oxidation/reduction peaks are lost when the potential window is reduced. The voltammogram in figure 3.3b shows only the double layer charging current. Besides, the magnitude of the anodic current gets reduced in the second and third cycles of the experiment. One possible explanation for this observation is that the polymer gets activated when the experiment is performed with an extended potential window.
31
Figure 3. 3: SpectroCV experimental results for determining an optimum potential window for a PEDOT:PSS film, CV was performed between a) -200 mV and +500 mV b) -550 and +650 mV
3.3.2 Effect of sweep rate on the absorbance of PEDOT:PSS thin films
The absorbance of a PEDOT:PSS film when it is most oxidized/reduced during a series of spectroCV experiments at different sweep rates can be used to establish the degree of oxidation/reduction of the film. In 2 mV/s spectro CV experiment, it was determined that the most oxidized form of the PEDOT:PSS film occurs at +736 mV and the most reduced form at -42 mV. The film shows maximum absorbance at 625 nm and 900 nm for the most reduced and the most oxidized forms of the polymer respectively.
32
Table 3.1 shows the maximum absorbance of the film at the most colored state and bleached state. For the oxidized polymer, absorbance increases as sweep rate is increased at 625 nm as well as at 900 nm. The absorbance of the reduced form on the other hand shows a decrease as the sweep rate is increased at 625 nm and relatively stays constant at 900 nm. These observations suggest that there are two forms of the bleached state (oxidized state) of the polymer.
Sweep rate (mV/s)
Oxidized film absorbance (a.u) Reduced film absorbance (a.u)
at 625nm at 900nm at 625nm at 900nm 2 0.392 0.508 1.314 0.847 10 0.416 0.565 1.220 0.866 50 0.595 0.755 0.690 0.808 100 0.606 0.770 0.670 0.801 500 0.613 0.817 0.614 0.819 1000 0.610 0.832 0.609 0.830
Table 3. 1 The maximum absorbance of PEDOT:PSS films.
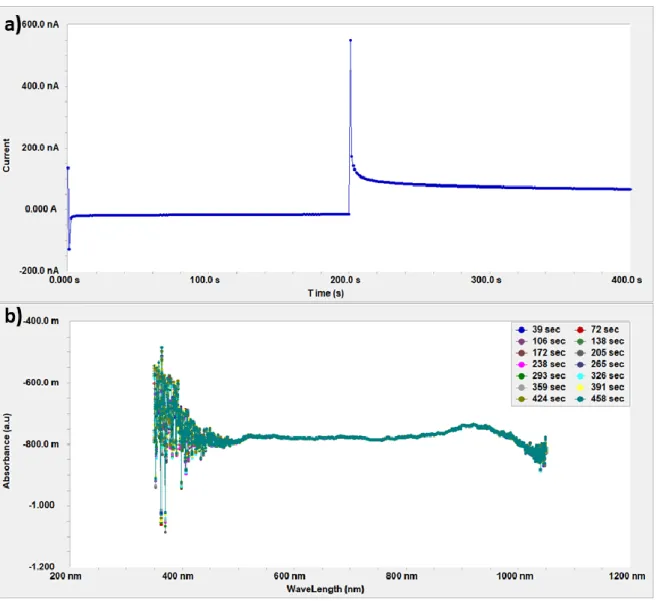
Results from spectrochronoamperometry also suggest that PEDOT:PSS has two oxidized forms as pointed out by Marzocchi et al. [67]. Spectra of the polymer during the cathodic scan as shown in figure 3.4, feature an isosbestic point. This highlights the conversion of the polymer from a bleached (oxidized) state to a colored (reduced) state.
33
Figure 3. 4: Spectrochronoampetrometry experimental results showing the 3 principal redox forms of PEDOT:PSS. a) applied potential steps: first, -600mV then +700mV. b) UV-Vis spectra representing the 3 principal redox forms of PEDOT:PSS. During the application of the negative potential step, absorbance increases in the reduced form of the polymer increases while it decreases for the oxidized form. During the positive potential step, a second oxidized form of the polymer is observed with decreasing absorbance in time.
In the case of a polymer with two redox states, when the polarity of the applied potential step is switched to positive, the magnitude of absorbance for the reduced state decrease while that for the oxidized state increases. On the contrary, when polarity was switched to positive, there was a transition to a different set of spectra with lower absorbance than the first oxidized state mention above.
34
3.4 Ultrafast CV experiments on PEDOT:PSS thin films
Experiments at sweep rates of 2 V/s and above are classified as ultrafast CV in this thesis. As mentioned earlier, the ultrafast CV experiments were performed with a custom-made potentiostat that has an in-built circuitry that compensates for potential drops at high sweep rates due to solution resistance. Ultrafast cyclic voltammetry on a blank FTO glass electrode gives the highest sweep rate achievable. Since the currents generated in these experiments are purely capacitive current, the results show the contribution of charging currents during the ultrafast spectro CV experiments. From figure 3.4, the current limit of the potentiostat was reached at a sweep rate of 1.6 kV/s on a 4 mm2 FTO electrode.
Figure 3. 5: Cyclic voltammetry at different sweep rates on a blank FTO electrode. The currents in these voltammograms are purely capacitive. The area of the electrode in contact with the electrolyte is 4 mm2.
3.5 Ultrafast spectroCV experiments
Figure 3.6 and 3.7 show the voltammograms obtained from a series of ultrafast spectroCV experiments with their corresponding spectra. The highest sweep rate achieved in this series of experiments is 2.5 kV/s with a potential window of 1.25 V. It takes 1.00x10⁻³ s for the completion of a cycle at this sweep rate. Here, it should be noted that in calculating the period for a full voltammetric scan, the potential window is multiplied by two (2). The is due to the fact that two potential ramps are applied in a full cycle.
35
Figure 3. 6: Ultrafast spectroCV results. a) Cyclic voltammograms from a set of iR experiments. b) Corresponding UV-Vis spectra. There is an increase in current as sweep rate is increased. At ca. 600 nm and 1000 nm, the spectra show an increase and a reduction in absorbance respectively.
The variation in absorbance of the PEDOT:PSS film from 2 V/s to 2.5 kV/s is about 0.1. From figures 3.6 and 3.7, it can be noted that the absorbance of the PEDOT:PSS is similar in both the iR compensated and uncompensated experiments. This could be due to insufficient iR compensation. In both sets, absorbance increases with increasing sweep rates and then remains constant after 1000 V/s.
36
Figure 3. 7: Ultrafast spectroCV results. a) Cyclic voltammograms from a set of iR compensated experiments. b) Corresponding UV-Vis spectra. There is an increase in current as sweep rate is increased. At ca. 600 nm and 1000 nm, the spectra show an increase and a reduction in absorbance respectively.
3.6 Principal Component Analysis (PCA)
3.6.1 Basis set spectra for PCA
The spectra from ultrafast spectroCV are the average of spectral curves representing the principal redox forms as well as the intermediate forms of PEDOT:PSS. Using a collection of
37
spectra obtained from a 2 mV/s spectroCV experiment, three PCA curves are constructed. These three curves form a basis set that are used for the analysis of the ultrafastCV spectra.
Figure 3. 8: a) A collection of spectra obtained from a 2mV/s spectroCV experiment. b) basis set generated from the collection of spectra; curves 0, 1, and 2 represent the oxide state, the reduced state and the reduced state of PEDOT:PSS respectively.

![Figure 1. 4: Square scheme showing how electron transfer and ion transfers are coupled during redox switching in CPs [54]](https://thumb-eu.123doks.com/thumbv2/9libnet/5842130.119769/23.892.330.568.447.759/figure-square-showing-electron-transfer-transfers-coupled-switching.webp)