Simultaneous extraction of geometry and surface
properties of targets using simple infrared
sensors
Tayfun Aytac¸ Billur Barshan Bilkent University
Department of Electrical Engineering TR-06800 Bilkent, Ankara, Turkey E-mail: [email protected]
Abstract. We investigate the use of low-cost infrared (IR) sensors for the simultaneous extraction of geometry and surface properties of com-monly encountered features or targets in indoor environments, such as planes, corners, and edges. The intensity measurements obtained from such sensors are highly dependent on the location, geometry, and sur-face properties of the reflecting target in a way that cannot be repre-sented by a simple analytical relationship, therefore complicating the lo-calization and recognition process. We propose the use of angular intensity scans and present an algorithm to process them to determine the geometry and the surface type of the target and estimate its position. The method is verified experimentally with planes, 90-deg corners, and 90-deg edges covered with aluminum, white cloth, and Styrofoam pack-aging material. An average correct classification rate of 80% of both geometry and surface over all target types is achieved and targets are localized within absolute range and azimuth errors of 1.5 cm and 1.1 deg, respectively. Taken separately, the geometry and surface type of targets can be correctly classified with rates of 99 and 81%, respectively, which shows that the geometrical properties of the targets are more distinctive than their surface properties, and surface determination is the limiting factor. The method demonstrated shows that simple IR sensors, when coupled with appropriate processing, can be used to extract sub-stantially more information than that for which such devices are com-monly employed. ©2004 Society of Photo-Optical Instrumentation Engineers. [DOI: 10.1117/1.1789136]
Subject terms: pattern recognition; feature extraction; target differentiation; target localization; surface differentiation; surface localization; infrared sensors; position estimation; optical sensing.
Paper 030547 received Oct. 31, 2003; revised manuscript received Mar. 11, 2004; accepted for publication Mar. 28, 2004.
1 Introduction
Target differentiation and localization is of considerable in-terest for intelligent systems where it is necessary to iden-tify targets and their positions for autonomous operation. Differentiation is also important in industrial applications where different materials must be identified and separated. In this paper, we consider the use of a very simple IR sensing system consisting of one emitter and one detector for the purpose of differentiation and localization. These devices are inexpensive, practical, and widely available. The emitted light is reflected from the target and its inten-sity is measured at the detector. However, it is often not possible to make reliable distance estimates based on the value of a single intensity return because the return depends on both the geometry and surface properties of the reflect-ing target. Likewise, the properties of the target cannot be deduced from simple intensity returns without knowing its distance and angular location. In this paper, we propose a scanning technique and an algorithm that can simulta-neously determine the geometry and the surface type of the target, in a manner that is invariant to its location. Once the target type is determined, its position (r,) can also be
estimated. The method we propose is scalable in the sense that the accuracy can be increased by increasing the num-ber of reference scans without increasing the computational complexity of the differentiation and localization process. Our results show that by properly processing data obtained from such simple IR sensors, it is possible to extract a significantly greater amount of information than is com-monly expected from such sensors.
Most work on pattern recognition involving IR deals with recognition or detection of features or targets in con-ventional 2-D images. Examples of work in this category include face identification,1 automatic target recognition,2 target tracking,3 automatic vehicle detection,4 remote sensing,5 detection and identification of targets in back-ground clutter,6,7and automated terrain analysis.8Note that the position-invariant pattern recognition and position esti-mation achieved in this paper are different from such op-erations performed on conventional images9in that here we work not on direct ‘‘photographic’’ images of the targets obtained by some kind of imaging system, but rather on angular intensity scans obtained by rotating a point sensor. The targets we differentiate are not patterns in a 2-D image
whose coordinates we try to determine, but rather objects in space, exhibiting depth, whose position with respect to the sensing system we must estimate. As such, position-invariant differentiation and localization is achieved with an approach quite different than those employed in invari-ant pattern recognition and localization in conventional images.10–16
IR sensors are used in robotics and automation, process control, remote sensing, and safety and security systems. More specifically, they have been used in simple object and proximity detection,17 counting,18 distance and depth monitoring,19 floor sensing, position measurement, and control,20,21 obstacle/collision avoidance,22,23 and map building.24IR sensors are used in door detection and map-ping of openings in walls,25 as well as monitoring doors/ windows of buildings and vehicles, and ‘‘light curtains’’ for protecting an area. In Ref. 26, the properties of a planar surface at a known distance were determined using the Phong illumination model, and using this information, the IR sensor employed was modeled as an accurate range finder for surfaces at short ranges. In Ref. 27, an IR-sensor-based system that can measure distances up to 1 m is de-scribed. References 28, 29, and 30 deal with optical deter-mination of depth information. In Ref. 31, simulation and evaluation of the recognition abilities of active IR sensor arrays are considered for autonomous systems using a ray-tracing approach. Reference 32 describes a passive IR sens-ing system that identifies the locations of the people in a room. IR sensors have also been used for automated sorting of waste objects made of different materials.33 In Ref. 34, we considered targets with different geometrical properties but made of the same surface material 共wood兲. A correct classification rate of 97% was achieved with absolute range and azimuth errors of 0.8 cm and 1.6 deg. A rule-based approach to the same problem can be found in Ref. 35. In Ref. 36, targets made of different surface materials but of the same planar geometry were differentiated with a correct differentiation rate of 87% and absolute range and azimuth errors of 1.2 cm and 1.0 deg. In this paper, we deal with the problem of differentiating and localizing targets whose ge-ometry and surface properties both vary, generalizing and unifying the results of Refs. 34 and 36.
2 Target Differentiation and Localization
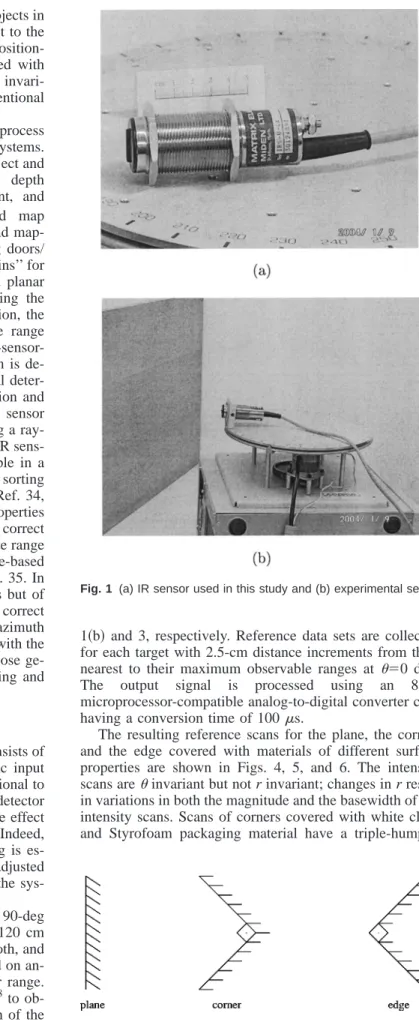
The IR sensor37used in this study关see Fig. 1共a兲兴 consists of an emitter and detector, works with 20 to 28-V dc input voltage, and provides analog output voltage proportional to the measured intensity reflected off the target. The detector window is covered with an IR filter to minimize the effect of ambient light on the intensity measurements. Indeed, when the emitter is turned off, the detector reading is es-sentially zero. The sensitivity of the device can be adjusted with a potentiometer to set the operating range of the sys-tem.
The targets employed in this study are a plane, a 90-deg corner, and a 90-deg edge, each with a height of 120 cm
共Fig. 2兲. They are covered with aluminum, white cloth, and
Styrofoam packaging material. Our method is based on an-gularly scanning each target over a certain angular range. The IR sensor is mounted on a 12-in. rotary table38to ob-tain angular scans from these targets. A photograph of the experimental setup and its schematics can be seen in Figs.
1共b兲 and 3, respectively. Reference data sets are collected for each target with 2.5-cm distance increments from their nearest to their maximum observable ranges at ⫽0 deg. The output signal is processed using an 8-bit microprocessor-compatible analog-to-digital converter chip having a conversion time of 100s.
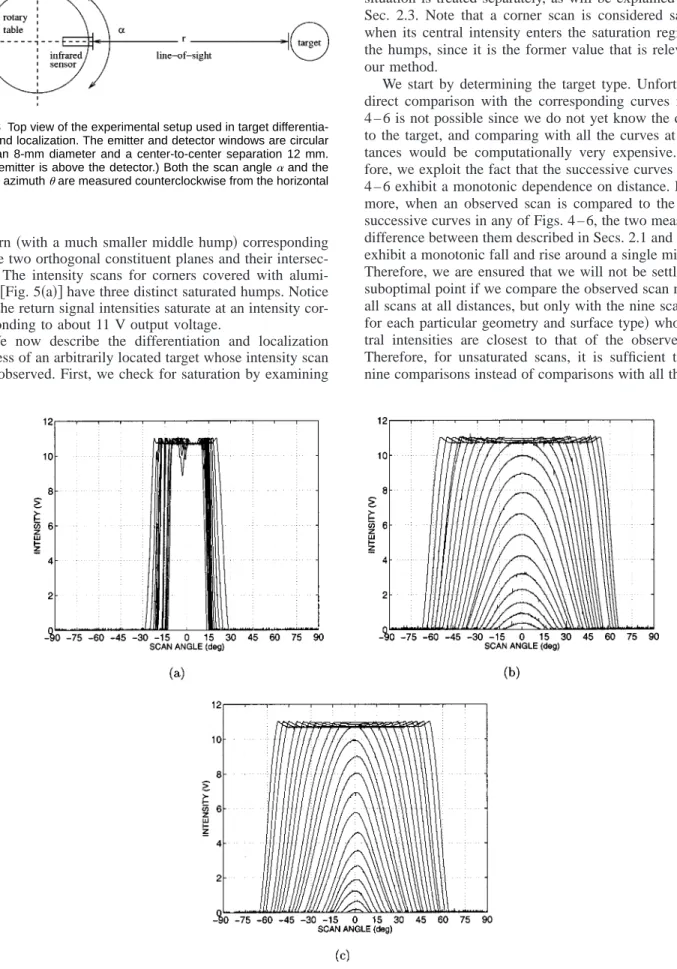
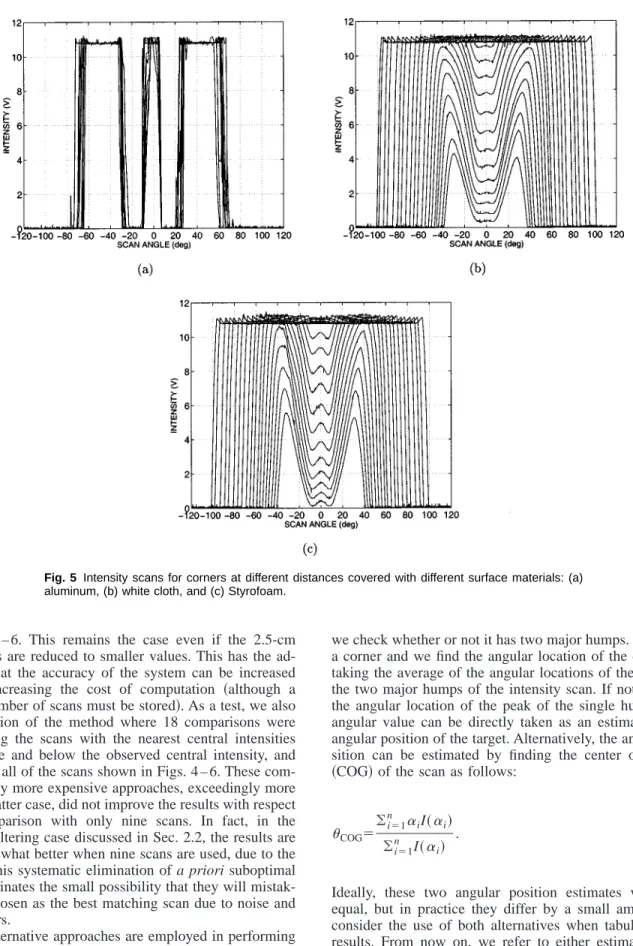
The resulting reference scans for the plane, the corner, and the edge covered with materials of different surface properties are shown in Figs. 4, 5, and 6. The intensity scans areinvariant but not r invariant; changes in r result in variations in both the magnitude and the basewidth of the intensity scans. Scans of corners covered with white cloth and Styrofoam packaging material have a triple-humped
Fig. 1 (a) IR sensor used in this study and (b) experimental setup.
pattern共with a much smaller middle hump兲 corresponding to the two orthogonal constituent planes and their intersec-tion. The intensity scans for corners covered with alumi-num关Fig. 5共a兲兴 have three distinct saturated humps. Notice that the return signal intensities saturate at an intensity cor-responding to about 11 V output voltage.
We now describe the differentiation and localization process of an arbitrarily located target whose intensity scan was observed. First, we check for saturation by examining
the central intensity value of the observed scan I(␣). This situation is treated separately, as will be explained later in Sec. 2.3. Note that a corner scan is considered saturated when its central intensity enters the saturation region, not the humps, since it is the former value that is relevant for our method.
We start by determining the target type. Unfortunately, direct comparison with the corresponding curves in Figs. 4 – 6 is not possible since we do not yet know the distance to the target, and comparing with all the curves at all dis-tances would be computationally very expensive. There-fore, we exploit the fact that the successive curves in Figs. 4 – 6 exhibit a monotonic dependence on distance. Further-more, when an observed scan is compared to the several successive curves in any of Figs. 4 – 6, the two measures of difference between them described in Secs. 2.1 and 2.2 also exhibit a monotonic fall and rise around a single minimum. Therefore, we are ensured that we will not be settling at a suboptimal point if we compare the observed scan not with all scans at all distances, but only with the nine scans共one for each particular geometry and surface type兲 whose cen-tral intensities are closest to that of the observed scan. Therefore, for unsaturated scans, it is sufficient to make nine comparisons instead of comparisons with all the scans Fig. 3 Top view of the experimental setup used in target
differentia-tion and localizadifferentia-tion. The emitter and detector windows are circular with an 8-mm diameter and a center-to-center separation 12 mm. (The emitter is above the detector.) Both the scan angle␣and the target azimuthare measured counterclockwise from the horizontal axis.
Fig. 4 Intensity scans for planes at different distances covered with different surface materials: (a)
in Figs. 4 – 6. This remains the case even if the 2.5-cm increments are reduced to smaller values. This has the ad-vantage that the accuracy of the system can be increased without increasing the cost of computation 共although a greater number of scans must be stored兲. As a test, we also ran a version of the method where 18 comparisons were made using the scans with the nearest central intensities both above and below the observed central intensity, and also using all of the scans shown in Figs. 4 – 6. These com-putationally more expensive approaches, exceedingly more so in the latter case, did not improve the results with respect to a comparison with only nine scans. In fact, in the matched filtering case discussed in Sec. 2.2, the results are even somewhat better when nine scans are used, due to the fact that this systematic elimination of a priori suboptimal scans eliminates the small possibility that they will mistak-enly be chosen as the best matching scan due to noise and other errors.
Two alternative approaches are employed in performing the nine comparisons. These are discussed in the following two subsections.
2.1 Least-Squares Approach
First, we estimate the angular position of the target as fol-lows. Assuming the observed scan pattern is not saturated,
we check whether or not it has two major humps. If so, it is a corner and we find the angular location of the corner by taking the average of the angular locations of the peaks of the two major humps of the intensity scan. If not, we find the angular location of the peak of the single hump. This angular value can be directly taken as an estimate of the angular position of the target. Alternatively, the angular po-sition can be estimated by finding the center of gravity
共COG兲 of the scan as follows:
COG⫽ 兺i⫽1 n ␣ iI共␣i兲 兺i⫽1 n I共␣ i兲 . 共1兲
Ideally, these two angular position estimates would be equal, but in practice they differ by a small amount. We consider the use of both alternatives when tabulating our results. From now on, we refer to either estimate as the ‘‘center angle’’ of the scan.
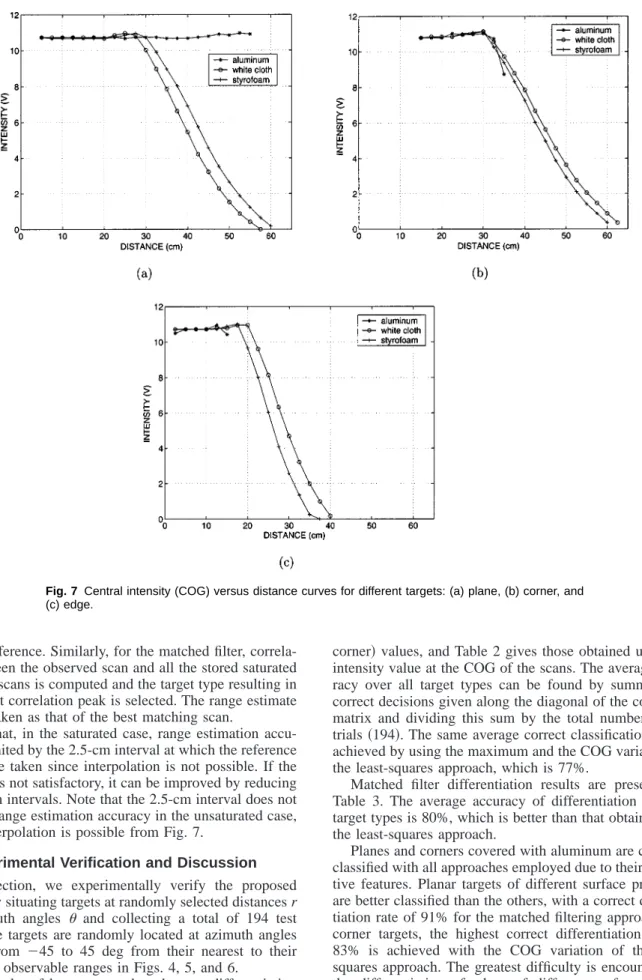
Plots of the intensity at the center angle of each scan in Figs. 4 – 6 as a function of the distance at which that scan was obtained, play an important role in our method. Figure 7 shows these plots for the intensity value at the COG for planes, corners, and edges.
Fig. 5 Intensity scans for corners at different distances covered with different surface materials: (a)
In this approach, we compare the intensity scan of the observed target with the nine reference scans by computing their least-squares differences after aligning their centers with each other. The mean-square difference between the observed scan and the nine scans is computed as follows:
Ej⫽
1
ni
兺
⫽1 n关I共␣i⫺␣align兲⫺Ij共␣i兲兴2, 共2兲
where Ij, j⫽1,...,9, denotes the nine scans. Here, ␣alignis
the angular shift that is necessary to align both patterns. The geometry-surface combination resulting in the smallest value of E is declared as the observed target. Once the geometry and surface type are determined, the range can be estimated by using linear interpolation on the appropriate curve in Fig. 7. Note that, in this way, the accuracy of the method is not limited by the 2.5-cm spacing used in col-lecting the reference scans.
2.2 Matched Filtering Approach
As an alternative, we also considered the use of matched filtering39 to compare the observed and reference scans. The output of the matched filter is the cross-correlation
between the observed intensity pattern and the j’th refer-ence scan normalized by the square root of its total energy:
yj共l兲⫽ 兺kI共␣k兲Ij共␣k⫺l兲 兵兺i⫽1 n 关I j共␣i兲兴2其1/2 , 共3兲
where l⫽1,...,2n⫺1 and j⫽1,...,9. The geometry-surface combination corresponding to the maximum cross-correlation peak is declared as the correct target type, and the angular position of the correlation peak directly pro-vides an estimate of the azimuth angle of the target. Then, the distance is estimated by using linear interpolation on the appropriate curve in Fig. 7 using the intensity value at the azimuth estimate.
2.3 Saturated Scans
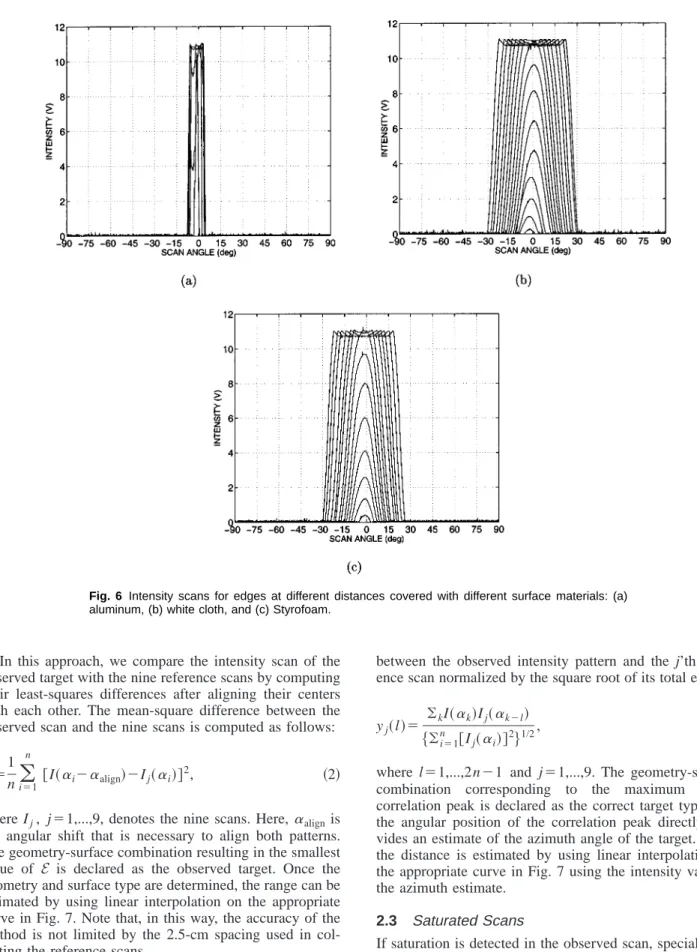
If saturation is detected in the observed scan, special treat-ment is necessary. In the least-squares approach, the mean square differences between the aligned observed scan and all the saturated reference scans are computed and the tar-get type with the minimum mean square difference is cho-sen. The range estimate of the target is taken as the distance corresponding to the scan resulting in the minimum mean Fig. 6 Intensity scans for edges at different distances covered with different surface materials: (a)
square difference. Similarly, for the matched filter, correla-tion between the observed scan and all the stored saturated reference scans is computed and the target type resulting in the highest correlation peak is selected. The range estimate is again taken as that of the best matching scan.
Note that, in the saturated case, range estimation accu-racy is limited by the 2.5-cm interval at which the reference scans were taken since interpolation is not possible. If the accuracy is not satisfactory, it can be improved by reducing the 2.5-cm intervals. Note that the 2.5-cm interval does not limit the range estimation accuracy in the unsaturated case, where interpolation is possible from Fig. 7.
3 Experimental Verification and Discussion
In this section, we experimentally verify the proposed method by situating targets at randomly selected distances r and azimuth angles and collecting a total of 194 test scans. The targets are randomly located at azimuth angles varying from ⫺45 to 45 deg from their nearest to their maximum observable ranges in Figs. 4, 5, and 6.
The results of least-squares-based target differentiation are displayed in Tables 1 and 2 in the form of confusion matrices. Table 1 gives the results obtained using the maxi-mum intensity共or the middle-of-two-maxima intensity for
corner兲 values, and Table 2 gives those obtained using the intensity value at the COG of the scans. The average accu-racy over all target types can be found by summing the correct decisions given along the diagonal of the confusion matrix and dividing this sum by the total number of test trials共194兲. The same average correct classification rate is achieved by using the maximum and the COG variations of the least-squares approach, which is 77%.
Matched filter differentiation results are presented in Table 3. The average accuracy of differentiation over all target types is 80%, which is better than that obtained with the least-squares approach.
Planes and corners covered with aluminum are correctly classified with all approaches employed due to their distinc-tive features. Planar targets of different surface properties are better classified than the others, with a correct differen-tiation rate of 91% for the matched filtering approach. For corner targets, the highest correct differentiation rate of 83% is achieved with the COG variation of the least-squares approach. The greatest difficulty is encountered in the differentiation of edges of different surfaces, which have the most similar intensity patterns. The highest correct differentiation rate of 60% for edges is achieved with the maximum intensity variation of the least-squares approach. Fig. 7 Central intensity (COG) versus distance curves for different targets: (a) plane, (b) corner, and
Taken separately, the geometry and surface type of targets can be correctly classified with rates of 99 and 81%, re-spectively, which shows that the geometrical properties of the targets are more distinctive than their surface properties, and surface determination is the limiting factor.
The average absolute range and azimuth estimation er-rors for the different approaches are presented in Table 4 for all test targets. As we see in the table, using the maxi-mum and COG variations of the least-squares approach, the target ranges are estimated with average absolute range er-rors of 1.8 and 1.7 cm, respectively. Matched filtering re-sults in an average absolute range error of 1.5 cm, which is better than the least-squares approach. The greatest contri-bution to the range errors comes from targets which are incorrectly differentiated and/or whose intensity scans are saturated. If we average over only correctly differentiated targets共regardless of whether they lead to saturation兲, the average absolute range errors are reduced to 1.2, 1.0, and 0.7 cm for the maximum and COG variations of the least-squares and the matched filtering approaches, respectively. As for azimuth estimation, the respective average absolute errors for the maximum and COG variations of least-squares and the matched filtering approaches are 1.6, 1.5, and 1.1 deg, with matched filtering resulting in the smallest error. When we average over only correctly differentiated targets, these errors are reduced to 1.5, 1.2, and 0.9 deg, respectively.
To explore the boundaries of system performance and to assess the robustness of the system, we also tested the sys-tem with targets of either unfamiliar geometry, unfamiliar surface, or both, whose scans are not included in the refer-ence data sets. Therefore, these targets are totally new to the system. First, tests were done for planes, corners, and edges covered with five new surfaces: brown, violet, black, and white paper, and wood. The results of these tests are presented in Tables 5, 6, and 7. Planes are classified as planes100% of the time using both variations of the least-squares method and 99.3% of the time using the matched filtering approach. Corners are classified as corners 100% of the time using any of the three approaches. Edges are correctly classified 89.1% of the time using the maximum
variation of the least-squares approach, 88.2% of the time using the COG variation of the least-squares approach, and 87.3% of the time using the matched filtering approach. In these tests, no target type is mistakenly classified as a cor-ner due to the unique characteristics of the corcor-ner scans. For the same reason, corners of the preceding five surface types are never classified as planes or edges. The range and azimuth errors are comparable or slightly larger than before
共not shown兲.
We also tested the system with cylinders, which were not among the three geometries in the original data sets, with the same surface types as used in the reference data sets: aluminum, white cloth, and Styrofoam. The results are given in Table 8 and indicate that cylindrical targets are most likely to be classified as edges. In this case, correct surface classification rate drops to 35%. We have also con-sidered cylinders whose surface properties are different than the surface types considered in the reference data sets. These are brown, violet, black, and white paper and wood. That is, both the geometry and surface type of this target is
Table 1 Confusion matrix: least-squares-based classification (maxi-mum variation). Actual Detected P C E AL WC ST AL WC ST AL WC ST AL 24 — — — — — — — — P WC — 25 4 — — — — — — ST — 9 20 — — — — — — AL — — — 22 — — — — — C WC — — — — 10 12 — — — ST — — — — — 20 — — — AL — — — — — — 9 — 1 E WC — — — — — — — 11 9 ST — — 1 — — — — 8 9
AL, aluminum; WC, white cloth; ST, Styrofoam; WO, wood; BR, brown paper; VI, violet paper; BL, black paper; WH, white paper; P, plane; C, corner; E, edge; CY, cylinder.
Table 2 Confusion matrix: least-squares based classification (COG variation). Actual Detected P C E AL WC ST AL WC ST AL WC ST AL 24 — — — — — — — — P WC — 25 4 — — — — — — ST — 9 20 — — — — — — AL — — — 22 — — — — — C WC — — — — 13 9 — — — ST — — — — 2 18 — — — AL — — 1 — — — 7 — 2 E WC — — — — — — — 14 6 ST — 1 1 — — — — 10 6
AL, aluminum; WC, white cloth; ST, Styrofoam; WO, wood; BR, brown paper; VI, violet paper; BL, black paper; WH, white paper; P, plane; C, corner; E, edge; CY, cylinder.
Table 3 Confusion matrix: matched filter based classification.
Actual Detected P C E AL WC ST AL WC ST AL WC ST AL 24 — — — — — — — — P WC — 27 2 — — — — — — ST — 5 24 — — — — — — AL — — — 22 — — — — — C WC — — — — 14 8 — — — ST — — — — 4 16 — — — AL — — — — — — 9 1 — E WC — — — — — — — 11 9 ST — — 2 — — — — 8 8
AL, aluminum; WC, white cloth; ST, Styrofoam; WO, wood; BR, brown paper; VI, violet paper; BL, black paper; WH, white paper; P, plane; C, corner; E, edge; CY, cylinder.
totally unfamiliar to the system. Again, cylinders are most likely to be classified as edges with Styrofoam surface type
共see Table 9兲. In these two cases, average range estimation
error increases to about 9 to 11 cm, but the azimuth error is of the same order of magnitude as before, since our azi-muth estimation method is independent of target type.
These results indicate that geometrical properties of the targets are more dominant and distinctive compared to their surface properties. When the geometry is familiar but the surface type is not, as in the cases in Tables 5, 6, and 7, the correct classification rate of the geometry is very high
共about 96% on the average兲. However, when the surface
type is familiar but the geometry is not, the correct classi-fication rate of the surface type is lower 共35%兲, as in Table 8.
Among the three approaches, the maximum variation of the least-squares approach is slightly more robust to devia-tions from targets included in the reference sets.
In the remainder of this section, we discuss the effect of varying the orientation of the targets from their head-on
positions. This constitutes a separate degree of freedom than the range and azimuth of the targets. Varying the ori-entation for planes does not make any difference since a complete scan is acquired. The acquired scan will still be that of a plane, with its peak shifted to the azimuthal value, which corresponds to the direction where the sensor line of sight is perpendicular to the plane. In other words, varying the orientation of planes does not lead to any deterioration in performance since such planes are already included in the reference set. Variation of orientation is not an issue for cylinders to begin with, since they are rotation invariant.
Change of orientation will make a difference when the target geometry is a corner or an edge, leading to scans not existing in the reference set. Unlike with the case of planes and cylinders, varying the orientation of corners and edges leads to asymmetric scans. If the scan is symmetric, it is either a plane or a cylinder, or a corner or an edge with nearly 0 deg orientation, and the described algorithm can handle it. If the scan is asymmetric, we know that the target is either a corner or an edge with nonzero orientation.
Table 4 Absolute range and azimuth estimation errors over all test targets.
Method P C E Average Error AL WC ST AL WC ST AL WC ST LS-max r(cm) 2.2 2.3 1.0 2.1 0.8 0.5 2.4 1.9 2.7 1.8 (deg) 0.9 2.3 0.8 2.4 1.7 1.3 1.1 2.0 1.7 1.6 LS-COG r(cm) 2.2 0.6 1.0 2.1 0.6 0.6 3.8 1.4 3.2 1.7 (deg) 0.9 1.0 0.8 2.4 1.4 1.1 1.2 2.2 2.3 1.5 MF r(cm) 1.7 0.5 0.7 1.5 0.6 0.6 2.2 1.7 4.2 1.5 (deg) 0.8 0.9 0.7 1.0 1.1 1.0 1.1 2.6 0.9 1.1 LS: least-squares, MF: matched filter.
Table 5 Confusion matrix for planar targets with unfamiliar surface.
Actual Detected P C E AL WC ST AL WC ST AL WC ST WO — 16 14 — — — — — — BR — 20 10 — — — — — — P VI — 22 8 — — — — — — (LS-max) BL — 24 6 — — — — — — WH — 18 11 — — — — — — WO — 15 15 — — — — — — BR — 20 10 — — — — — — P VI — 22 8 — — — — — — (LS-COG) BL — 24 6 — — — — — — WH — 16 13 — — — — — — WO — 19 11 — — — — — — BR — 22 8 — — — — — — P VI — 23 6 — — — — — 1 (MF) BL 1 25 4 — — — — — — WH — 18 11 — — — — — —
AL, aluminum; WC, white cloth; ST, Styrofoam; WO, wood; BR, brown paper; VI, violet paper; BL, black paper; WH, white paper; P, plane; C, corner; E, edge; CY, cylinder.
Table 6 Confusion matrix for corner targets with unfamiliar surface.
Actual Detected P C E AL WC ST AL WC ST AL WC ST WO — — — — 9 13 — — — BR — — — 1 3 17 — — — C VI — — — 1 20 — — — — (LS-max) BL — — — — 12 10 — — — WH — — — — 12 9 — — — WO — — — — 10 12 — — — BR — — — 1 3 17 — — — C VI — — — 1 2 18 — — — (LS-COG) BL — — — — 13 9 — — — WH — — — — 13 8 — — — WO — — — — 14 8 — — — BR — — — 1 4 16 — — — C VI — — — 1 3 17 — — — (MF) BL — — — — 13 9 — — — WH — — — — 13 8 — — —
AL, aluminum; WC, white cloth; ST, Styrofoam; WO, wood; BR, brown paper; VI, violet paper; BL, black paper; WH, white paper; P, plane; C, corner; E, edge; CY, cylinder.
While it is possible to deal with this case by extending the reference set to include targets with nonzero orientation, the introduction of a simple rule enables us to handle such cases with only minor modification of the already presented algorithm. We can determine whether the asymmetric scan comes from a corner or an edge by checking whether or not it has two humps. Thus, even with arbitrary orientations, the target geometry can be determined. Furthermore, we observe that variations in orientation have very little effect on the central intensity of the asymmetric scans共see Fig. 8 for some examples兲. This means that the central intensity value can be used to determine the distance in the same
manner as before by using linear interpolation on the cen-tral intensity versus distance curves for a particular target. To summarize, with the preceding observations and mi-nor modifications to the algorithm, the same geometry and surface recognition and position estimation objectives can be achieved even when the targets do not have 0-deg ori-entations. Note, however, that while this approach enables us to accomplish the desired objectives in an orientation-invariant manner, it does not determine the orientation of the target. If determination of target orientation is also de-sired, this can be accomplished either by storing corre-sponding scans in the reference set共increasing storage re-quirements兲, or more efficiently by constructing orientation angle versus measure-of-asymmetry plots based on suitable measures of asymmetry共for instance, ratios of characteris-tics of the left- and right-hand sides of the scans兲.
To demonstrate this, we performed additional experi-ments with corners and edges. These targets were placed at random orientation angles at randomly selected distances. A total of 100 test scans were collected. Using the orientation-invariant approach already described, 100% correct differ-entiation and absolute mean range errors of 1.02 and 1.47 cm for corners and edges respectively, were achieved.
We also tested the case where reference scans corre-sponding to different orientations are acquired. Reference data sets were collected for both targets with 5-cm distance increments at⫽0 deg, where the orientation of the targets are varied between⫺35 to 35 deg with 2.5-deg increments. A total of 489 reference scans were collected. For each test scan, the best-fitting reference scan was found by matched filtering. This method also resulted in 100% correct differ-entiation rate. Absolute mean range and orientation errors
Table 7 Confusion matrix for edge targets with unfamiliar surface.
Actual Detected P C E AL WC ST AL WC ST AL WC ST WO — 1 5 — — — — 9 7 BR — — 2 — — — — 12 8 E VI — — 2 — — — — 10 8 (LS-max) BL — — — — — — — 14 9 WH — — 2 — — — — 12 9 WO — 2 4 — — — 1 11 4 BR — — — — — — 1 15 6 E VI — 1 3 — — — — 15 1 (LS-COG) BL — 1 — — — — — 16 6 WH — 2 — — — — — 13 8 WO — — 6 — — — — 12 4 BR — — 3 — — — — 10 9 E VI — — 1 — — — — 17 2 (MF) BL — — 2 — — — — 15 6 WH — — 2 — — — — 12 9
AL, aluminum; WC, white cloth; ST, Styrofoam; WO, wood; BR, brown paper; VI, violet paper; BL, black paper; WH, white paper; P, plane; C, corner; E, edge; CY, cylinder.
Table 8 Confusion matrix for cylindrical targets with familiar sur-face. Actual Detected P C E AL WC ST AL WC ST AL WC ST AL — — — — — — 1 — 12 CY WC 7 — 1 — — — — 5 12 (LS-max) ST 4 — — — — — 1 4 16 AL — — — — — — — — 13 CY WC 7 1 — — — — — 4 13 (LS-COG) ST 4 1 1 — — — — 5 14 AL — — — — — — 1 — 12 CY WC 8 — 2 — — — — 2 13 (MF) ST 5 — 1 — — — — 5 14
AL, aluminum; WC, white cloth; ST, Styrofoam; WO, wood; BR, brown paper; VI, violet paper; BL, black paper; WH, white paper; P, plane; C, corner; E, edge; CY, cylinder.
Table 9 Confusion matrix for cylindrical targets with unfamiliar sur-face. Actual Detected P C E AL WC ST AL WC ST AL WC ST WO 8 — — — — — — 4 13 BR 7 — — — — — — 5 13 CY VI 7 1 1 — — — — 5 12 (LS-max) BL 5 — — — — — — 3 16 WH 8 — — — — — — 5 13 WO 8 — — — — — — 3 14 BR 7 — 1 — — — — 4 13 CY VI 7 2 1 — — — — 5 11 (LS-COG) BL 5 — — — — — 1 7 11 WH 8 1 — — — — — 3 14 WO 8 — — — — — — 5 12 BR 7 — 2 — — — — 4 12 CY VI 8 — 3 — — — — 3 12 (MF) BL 7 — 2 — — — — 3 12 WH 8 — — — — — — 5 13
AL, aluminum; WC, white cloth; ST, Styrofoam; WO, wood; BR, brown paper; VI, violet paper; BL, black paper; WH, white paper; P, plane; C, corner; E, edge; CY, cylinder.
for corners and edges were 1.13 and 1.26 cm and 4.48 and 5.53 deg, respectively.
4 Discussion and Conclusion
In this study, differentiation and localization of commonly encountered indoor features or targets such as planes, cor-ners, and edges with different surfaces was achieved using an inexpensive IR emitter and detector pair. Different ap-proaches were compared in terms of correct target differen-tiation rate, and range and azimuth estimation accuracy. The matched filtering approach in general gave better re-sults for both differentiation and localization. The robust-ness of the methods was investigated by presenting the sys-tem with targets of either unfamiliar geometry, unfamiliar surface type, or both. These targets were not included in the reference sets so they were completely new to the system. The accomplishment of this study is that even though the intensity scan patterns are highly dependent on target location, and this dependence cannot be represented by a simple relationship, we realize position-invariant target dif-ferentiation. An average correct target differentiation rate of 80% over all target types was achieved and targets were localized within absolute range and azimuth errors of 1.5 cm and 1.1 deg, respectively. The method we propose is scalable in the sense that the accuracy can be increased by increasing the number of reference scans without increas-ing the computational cost. The results reported here repre-sent the outcome of our efforts to explore the limits of what is achievable in terms of identifying information with only a simple emitter-detector pair. Such simple sensors are usu-ally put to much lower information-extracting uses.
We saw that the geometrical properties of the targets are more distinctive than their surface properties, and surface determination is the limiting factor. In this paper, we dem-onstrated target differentiation for three target geometries and three different surfaces. Based on the data we collected and on our previous works,34 –36 it seems possible to in-crease the vocabulary of different geometries, provided they are not too similar. However, the same cannot be said for the number of different surfaces. For a given total
num-ber of distinct targets, increasing the numnum-ber of surfaces and decreasing the number of geometries will, in general, worsen the results. On the other hand, decreasing the num-ber of surfaces and increasing the numnum-ber of geometries will, in general, improve the results.
This paper demonstrated that simple IR sensors, when coupled with appropriate processing, can be used to extract substantially more information than such devices are com-monly employed for. We expect this flexibility to signifi-cantly extend the range of applications in which such low-cost single-sensor-based systems can be used. Specifically, we expect that it will be possible to go beyond relatively simple tasks such as simple object and proximity detection, counting, distance and depth monitoring, floor sensing, po-sition measurement, obstacle/collision avoidance, and deal-ing with tasks such as differentiation, classification, recog-nition, clustering, position estimation, map building, perception of the environment and surroundings, autono-mous navigation, and target tracking. The approach pre-sented here would be more useful where a self-correcting operation is possible due to repeated observations and feed-back.
A typical application of the demonstrated system would be in mobile robotics in surveying an unknown environ-ment composed of eleenviron-mentary features or targets. Many artificial environments fall into this category. Industrial ap-plications where different targets and/or materials must be identified and separated may also benefit from this ap-proach. We plan to test and evaluate the developed system on a small mobile robot in our laboratory for map building in a test room composed of the primitive features consid-ered in this study.
Current work involves identifying more generally shaped targets共such as a vase or a bottle兲 by using several scans from each target obtained at different heights. Also being considered is the parametric modeling and represen-tation of intensity scans rather than the use of the intensity scan vectors themselves.
Fig. 8 Intensity scans for a wooden (a) corner at 65 cm and (b) edge at 35 cm for orientations
between 0 and 35 deg with 2.5-deg increments. The curves with the dotted lines indicate 0-deg orientation.
Acknowledgments
This research was supported by TU¨ BI˙TAK under BDP and 197E051 grants. The authors would like to thank the De-partment of Engineering Science of the University of Ox-ford for donating the IR sensors.
References
1. P. J. Phillips, ‘‘Matching pursuit filters applied to face identification,’’ IEEE Trans. Image Process. 7, 1150–1164共Aug. 1998兲.
2. H. Kwon, S. Z. Der, and N. M. Nasrabadi, ‘‘Adaptive multisensor target detection using feature-based fusion,’’ Opt. Eng. 41, 69– 80
共Jan. 2002兲.
3. T. Tsao and Z. Q. Wen, ‘‘Image-based target tracking through rapid sensor orientation change,’’ Opt. Eng. 41, 697–703共Mar. 2002兲. 4. I. Pavlidis, P. Symosek, B. Fritz, M. Bazakos, and N.
Papanikolopou-los, ‘‘Automatic detection of vehicle occupants: the imaging problem and its solution,’’ Mach. Vision Appl. 11, 313–320共Apr. 2000兲. 5. P. M. Tag, R. L. Bankert, and L. R. Brody, ‘‘An AVHRR multiple
cloud-type classification package,’’ J. Appl. Meterol. 39, 125–134
共Feb. 2000兲.
6. A. K. Jain, N. K. Ratha, and S. Lakshmanan, ‘‘Object detection using Gabor filters,’’ Pattern Recogn. 30, 295–309共Feb. 1997兲.
7. Z. Zalevsky, D. Mendlovic, E. Rivlin, and S. Rotman, ‘‘Contrasted statistical processing algorithm for obtaining improved target detec-tion performances in infrared cluttered environment,’’ Opt. Eng. 39, 2609–2617共Oct. 2000兲.
8. B. Bhanu, P. Symosek, and S. Das, ‘‘Analysis of terrain using multi-spectral images,’’ Pattern Recogn. 30, 197–215共Feb. 1997兲. 9. F. T. S. Yu and S. Yin, Eds., Selected Papers on Optical Pattern
Recognition, Vol. MS 156 of SPIE Milestone Series, SPIE Optical Engineering Press, Bellingham, WA共1999兲.
10. D. Casasent and D. Psaltis, ‘‘Scale invariant optical correlation using Mellin transforms,’’ Opt. Commun. 17, 59– 63共Apr. 1976兲. 11. M. McDonnell, ‘‘Clarification on use of Mellin transform in optical
pattern recognition,’’ Opt. Commun. 25共3兲, 320–322 共1978兲. 12. H. H. Arsenault, Y. N. Hsu, and K. Chalasinska-Macukow,
‘‘Rotation-invariant pattern recognition,’’ Opt. Eng. 23, 705–709 共Nov./Dec. 1984兲.
13. F. T. S. Yu, X. Li, E. Tam, S. Jutamulia, and D. A. Gregory, ‘‘Rotation invariant pattern recognition with a programmable joint transform cor-relator,’’ Appl. Opt. 28, 4725– 4727共Nov. 1989兲.
14. G. Gheen, ‘‘Design considerations for low-clutter, distortion invariant correlation filters,’’ Opt. Eng. 29, 1029–1032共Sep. 1990兲.
15. C. Gu, J. Hong, and S. Campbell, ‘‘2-D shift invariant volume holo-graphic correlator,’’ Opt. Commun. 88, 309–314共Apr. 1992兲. 16. P. Refregier, ‘‘Optical pattern recognition—optimal trade-off circular
harmonic filters,’’ Opt. Commun. 86, 113–118共Nov. 1991兲. 17. E. Cheung and V. J. Lumelsky, ‘‘Proximity sensing in robot
manipu-lator motion planning: system and implementation issues,’’ IEEE Trans. Rob. Autom. 5, 740–751共Dec. 1989兲.
18. A. J. Hand, ‘‘Infrared sensor counts insects,’’ Photonics Spectra 32, 30–31共Nov. 1998兲.
19. H. C. Wikle, S. Kottilingam, R. H. Zee, and B. A. Chin, ‘‘Infrared sensing techniques for penetration depth control of the submerged arc welding process,’’ J. Mater. Process. Technol. 113, 228 –233共June 2001兲.
20. Y. Arai and M. Sekiai, ‘‘Absolute position measurement system for mobile robot based on incident angle detection of infrared light,’’ in Proc. of the IEEE/RSJ Int. Conf. on Intelligent Robots and Systems, pp. 986 –991, Las Vegas, NV共2003兲.
21. B. Butkiewicz, ‘‘Position control system with fuzzy microprocessor AL220,’’ Lect. Notes Comput. Sci. 1226, 74 – 81共1997兲.
22. V. J. Lumelsky and E. Cheung, ‘‘Real-time collision avoidance in teleoperated whole-sensitive robot arm manipulators,’’ IEEE Trans. Syst. Man. Cybern. 23, 194 –203共Jan./Feb. 1993兲.
23. T.-H. S. Li, S.-J. Chang, and Y.-X. Chen, ‘‘Implementation of autono-mous fuzzy garage-parking control by an FPGA-based car-like mobile robot using infrared sensors,’’ in Proc. IEEE Int. Conf. on Robotics and Automation, pp. 3776 –3781, Taipei, Taiwan共2003兲.
24. H.-H. Kim, Y.-S. Ha, and G.-G. Jin, ‘‘A study on the environmental map building for a mobile robot using infrared range-finder sensors,’’ in Proc. IEEE/RSJ Int. Conf. on Intelligent Robots and Systems, pp. 711–716, Las Vegas, NV共2003兲.
25. A. M. Flynn, ‘‘Combining sonar and infrared sensors for mobile robot navigation,’’ Int. J. Robot. Res. 7, 5–14共Dec. 1988兲.
26. P. M. Novotny and N. J. Ferrier, ‘‘Using infrared sensors and the
Phong illumination model to measure distances,’’ in Proc. IEEE Int. Conf. on Robotics and Automation, pp. 1644 –1649, Detroit, MI
共1999兲.
27. G. Benet, F. Blanes, J. E. Simo´, and P. Pe´rez, ‘‘Using infrared sensors for distance measurement in mobile robots,’’ Robt. Auton. Syst. 40, 255–266共2002兲.
28. F. J. Cuevas, M. Servin, and R. Rodriguez-Vera, ‘‘Depth object recov-ery using radial basis functions,’’ Opt. Commun. 163, 270–277共May 1999兲.
29. P. Klysubun, G. Indebetouw, T. Kim, and T. C. Poon, ‘‘Accuracy of three-dimensional remote target location using scanning holographic correlation,’’ Opt. Commun. 184, 357–366共Oct. 2000兲.
30. J. J. Esteve-Taboada, P. Refregier, J. Garcia, and C. Ferreira, ‘‘Target localization in the three-dimensional space by wavelength mixing,’’ Opt. Commun. 202, 69–79共Feb. 2002兲.
31. B. Iske, B. Ja¨ger, and U. Ru¨ckert, ‘‘A ray-tracing approach for simu-lating recognition abilities of active infrared sensor arrays,’’ in Proc. 1st IEEE Int. Conf. on Sensors, Vol. 2, pp. 1227–1232, Orlando, FL
共2002兲.
32. K. Hashimoto, T. Tsuruta, K. Morinaka, and N. Yoshiike, ‘‘High per-formance human information sensor,’’ Sens. Actuators, A 79, 46 –52
共Jan. 2000兲.
33. D. M. Scott, ‘‘A 2-color near-infrared sensor for sorting recycled plas-tic waste,’’ Meas. Sci. Technol. 6, 156 –159共Feb. 1995兲.
34. T. Aytac¸ and B. Barshan, ‘‘Differentiation and localization of targets using infrared sensors,’’ Opt. Commun. 210, 25–35共Sep. 2002兲. 35. T. Aytac¸ and B. Barshan, ‘‘Rule-based target differentiation and
posi-tion estimaposi-tion based on infrared intensity measurements,’’ Opt. Eng. 42, 1766 –1771共June 2003兲.
36. B. Barshan and T. Aytac¸, ‘‘Position-invariant surface recognition and localization using infrared sensors,’’ Opt. Eng. 42, 3589–3594共Dec. 2003兲.
37. Matrix Elektronik, AG, Kirchweg 24 CH-5422 Oberehrendingen, Switzerland, IRS-U-4A Proximity Switch Datasheet共1995兲. 38. Arrick Robotics, P.O. Box 1574, Hurst, Texas, 76053 URL:
www.robotics.com/rt12.html, RT-12 Rotary Positioning Table共2002兲. 39. J. W. Goodman, Introduction to Fourier Optics, 2nd ed., pp. 246 –249,
McGraw-Hill, New York共1996兲.
Tayfun Aytac¸ received his BS degree in electrical engineering in 2000 from Gazi University, Ankara, Turkey, and his MS de-gree in electrical engineering in 2002 from Bilkent University, Ankara, Turkey, where he is currently working toward his PhD de-gree. His current research interests include intelligent sensing, optical sensing, pattern recognition, sensor data fusion, target dif-ferentiation, and sensor-based robotics.
Billur Barshan received her BS degrees in both electrical engineering and physics from Bog˘azic¸i University, Istanbul, Turkey, and her MS and PhD degrees in electrical engineering from Yale University, New Ha-ven, Connecticut, in 1986, 1988, and 1991, respectively. Dr. Barshan was a research assistant at Yale University from 1987 to 1991, and a postdoctoral researcher with the Robotics Research Group at University of Oxford, United Kingdom, from 1991 to 1993. In 1993, she joined Bilkent University, Ankara, where she is currently a professor in the Department of Electrical Engineering and where she is the founder of the Robotics and Sensing Labora-tory. She is the recipient of the 1994 Nakamura Prize awarded to the most outstanding paper at the 1993 IEEE/RSJ Intelligent Robots and Systems International Conference, the 1998 TU¨ BI˙TAK Young Investigator Award, and the 1999 Mustafa N. Parlar Foundation Re-search Award. Dr. Barshan’s current reRe-search interests include in-telligent sensors, sonar and inertial navigation systems, sensor-based robotics, and multisensor data fusion.