... a forum for manufacturers to describe the
current and potential applications of new
research instruments or products.
Multiplex Systems for the Amplification of
Short Tandem Repeat Loci: Evaluation of
Laser Fluorescence Detection
Bi0Teclmiq11es 23:742-747 (Ocrober 1997)
Marie D. Ricciardone
1•2,Ann M. Lins
3,James W. Schumm
3and Mitchell M. Holland
1 1Armed Forces Institute of Pathology, Rockville, MD, USA;
2Bilkent University,
Bilkent-Ankara, Turkey;
3Promega Corporation, Madison, WI, USA
ABSTRACT
Short tandem repeat (STR) loci are ideal markers for personal identification and for genomic mapping. Tivo fluoresce/If multiplex systems, each designed for si111ulta11eo11s PCR amplification of four polymorphic STR loci (HUMCSFJPO, HUMTPOX, HUMTHOJ and HUMVWFAJJ, and HUMFJ3A0I, HUMFESFPS, HUMBFXl/l and HUMLIPOL), were evaluated 011 three laserj111oresce11ce detection instruments. Co11corda11t DNA typing results were obtained with all three detection methods. These fluorescent multiplex STR systems of-fer an accurate, rep1vducible and versatile method of DNA profiling
that is well-suited for forensic identity testing and other genetic analyses.
INTRODUCTION
Short tandem repeat (STR) loci consist of tandemly re-peated sequence motifs, 3-7 bp in length, that are widely dis-tributed throughout the human genome (2,4,5, 16-18,24). Since the number of repeat motifs present at a particular locus within a population of individuals is highly polymorphic, STRs are ideal genetic markers for personal identification.
In-dividual profiles are generated by polymerase chain reaction (PCR) amplification of the STR loci using specific primers that flank the repeat motif. The amplified fragments, each with a discrete length that reflects the number of repeat mo-tifs, are separated by denaturing gel electrophoresis and sub-sequently detected by silver stain or fluorescence methods. STR profiles have been used for personal identification in forensic DNA typing (4,6-8,10,11), parentage determination
(1) and genetic mapping (14). 742 BioTechniques
STR analysis offers several advantages for personal identi-fication. Whereas conventional DNA typing methods, such as restriction fragment length polymorphism (RFLP) analysis, require relatively large amounts of intact DNA, PCR typing methods are often successful when the quantity of DNA is limited (15) or when the DNA is highly degraded (3,9). Al-though individual STR loci are only moderately discriminat-ing, multiple STR loci can be highly discriminating (10,12,23). The optimal STR profiling system should be ac-curate, sensitive, discriminating and robust. With these goals in mind, we have evaluated two multiplex STR systems, each designed for the simultaneous amplification of four polymor-phic STR loci (12,21), on three laser fluorescence detection-instruments: the Model 373 DNA Sequencer, the Fluor-Imager™ Scanner and the FMBIO® Fluorescent Scanner.
The Model 373 DNA Sequencer detects fluorescent PCR fragments as they migrate through the gel past a scanning laser. The DNA fragments are automatically sized by the in-tegrated GENESCAN™ software using co-electrophoresed standards labeled with a second fluorescent dye (13,25). This method offers a precise, accurate, sensitive and reproducible method of DNA fragment detection that has been successfully used with several STR systems for personal identification (6,7,10,22,23). The Fluorlmager and FMBIO instruments de-tect fluorescent PCR fragments by scanning the gel after elec-trophoresis is completed. The DNA fragments are sized by vi-sual or automated comparison with adjacent allelic ladders (19,21). Because the fluorescence detection is independent of electrophoresis, several gels can be analyzed rapidly with the same instrument. This study evaluated the consistency and ac-curacy of the STR profiles obtained using the three fluores-cence detection methods.
Table 1. STR Precision Data
Multiplex No.of
eve
Ranged(Dye) Locus Alleles (%) (bp)
CTTV (FL)a CSF1PO 9 0.07 1.10 TPOX 5 0.11 1.30 TH01 7 0.06 0.62 VWF 8 0.13 0.85 CTTV (HEx)b CSF1PO 9 0.07 0.97 TPOX 8 0.10 1.20 TH01 7 0.06 0.60 VWF 8 0.14 0.92 FFFL (FL)b F13A 12 0.08 1.20 FESFPS 8 0.10 1.20 F13B 6 0.07 0.45 LPL 7 0.14 0.67
acTTV (FL) data represent 90 replicate samples and 12 electrophoretic runs.
bCTTV (HEX) and FFFL (FL) data represent 49 replicate samples and 8 electrophoretic runs.
ccv or coefficient of variation is the ratio of the standard deviation to the mean. Values represent the maximum CV observed for all the alleles tested at that locus.
dRange is the difference in length between the longest and shortest fragments observed for an individual allele. Table values represent the maximum range observed for all the alleles tested at the locus.
MATERIALS AND METHODS STRSystems
The CTTV multiplex (Promega, Madison, WI, USA) con-tained the HUMCSFlPO, HUMTPOX, HUMTHOl and HUMVWFA3 l primer pairs. Both fluorescein-labeled and HEX-labeled CTTV primers were evaluated. The FFFL mul
-134 154 114 194 214 34 54 74 294 314 334 600 400 200 600 400 200 600 400 200 182 02 F13B
Figure 1. GENESCAN analysis of fluorescent multiplex STR allelic la d-ders. Top panel: electropherogram of tluorescein-labeled CTIV allelic lad-ders (TPOX ladder contains alleles 8-12). Center panel: electropherogram of HEX-labeled CTIV allelic ladders (TPOX ladder contains alleles 6-13). Bottom panel: electropherogram of fluorescein-labeled FFFL allelic ladders. Values along x-axis represent the size of DNA fragments; values along y-axis represent the intensity of fluorescence.
Vol. 23, No. 4 ( 1997)
The Model 2000
Micro Hybridization Incubator
Robbins Scientific just expanded your options for
hybridization incubators!
The new Model 2000 is for
laboratorie
s
with occa
s
ional blot processing requirements
,
fo
r
tho
s
e
th
a
t need severa
l
unit
s
operating at diff
e
rent temperatures and for
all labora
t
or
ies
w
i
th a limited budget
.
Compact and rugged in
des
i
gn, the Mod
e
l 2000 offe
r
s the following standard features
:
...
Generou
s
capacity, hold
s
4
-
35
x
300 mm or 8
-
35
x
150 mm tube
s
.,.
Tri-directional tube rotation for efficient washing
w
ithout separating me
s
hes
...
T
e
mperature control to 99
°
C
+/
-
0
.
1
°
[
...
Smaller than mo
s
t micro
w
ave ovens
,
occupie
s<
1
.
5 sq
.
ft
.
...
Durable design and construction
..
. two year
w
arranty
Expand your options even when faced wit
h
limited space or
l
i
mited budget. For more informatio
n
o
r
demonstration, contact
Robbins Scie
n
tific at
:
(800) 7S2
-
8S8S.
R..qbbins Scientific
Robbins Scientific Corporation 814 San Aleso Ave., Sunnyvale, CA 94086-1411
(408) 734-8500 (800) 752-8585 FAX (408) 734-0300
Table 2. FFFL STR Fragments: GENESCAN Analysis and Allele Assignment
LPL F13B FESFPS F13A01
Sample Sizea Alleleh Sizea Alleleh Sizea Alleleb Size8 Alleleh
6 117.32 10 177.67 8 239.27 11 287.10 5 125.29 12 181.97 9 242.87 12 290.95 6 8 125.01 12 182.04 9 239.00 11 290.96 6 186.00 10 294.83 7 10 117.30 10 169.50 6 235.77 10 291.23 6 124.91 12 186.00 10 243.06 12 295.11 7
afragment size (bp) determined by GS analysis.
hAllele assigments according to band size measurements determined by precision studies (Table 1 ).
tiplex (Promega) contained the HUMF13A01, HUMFESFPS, HUMBFXIII and HUMLIPOL fluorescein-labeled primer pairs. Allelic ladders (19,21) containing a mixture of DNA fragments representing most or all of the known alleles at each locus were used to assist with allele size determination and measurement precision.
PCR Amplification of STR Loci
Model 373 DNA Sequencer. STR loci were co-amplified in a 25-µL reaction mixture containing approximately 2 ng of genomic DNA, four primer pairs, STR buffer (Promega), I U
Taq DNA Polymerase (from either Perkin-Elmer, Norwalk,
240 160 80 240 160 80 103 123 143 LPL 10 12 • Lane7: Promega-06, FFFL • Lane9: Promega-08, FFFL LPL 10 12 • Lane11: Promega-10, FFFL 163 183 203 8 Fl3B 9 Fl3B 9 JO Fl3B 6 JO
CT, USA or Boehringer Mannheim, Indianapolis, IN, USA) and overlaid with mineral oil. Amplifications were performed in 0.5-mL Thin-Walled GeneAmp® PCR Tubes in a Gene-Amp 9600 System (Perkin-Elmer) as follows: denaturation at 96°C for 2 min; 10 cycles of 94°C for 1 min, 60°C for 1 min and 70°C for 1.5 min; 20 cycles of90°C for 1 min, 60°C for I min and 70°C for 1.5 min; and final extension at 70°C for 10 min.
FMBIO and Fluorlmager. STR loci were co-amplified as described above except that the reactions contained ap-proximately 10 ng template DNA; amplifications were per-formed in 0.5-mL GeneAmp PCR Reaction Tubes in a DNA
223 10 243 FESFPS II 12 FESFPS 11 FESFPS 12 263 283 Fl3A 5 6 Fl3A 6 l-'13A 6 7 303 323
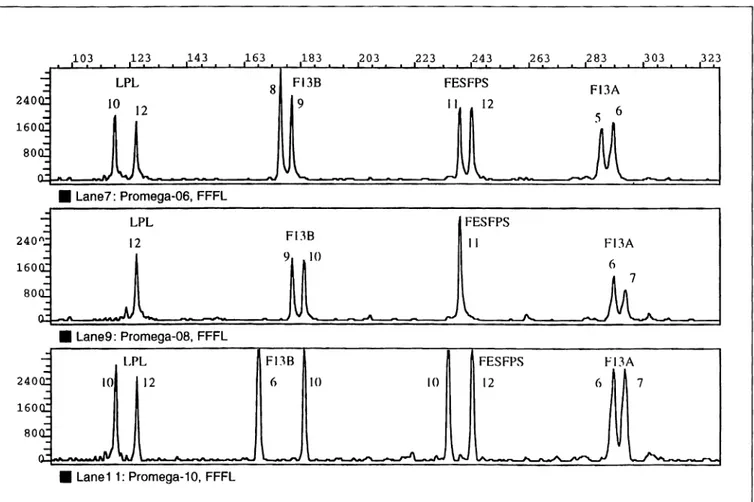
Figure 2. Fluorescence detection ofFFFL-amplified DNA fragments using the Model 373 DNA Sequencer with GENESCAN software. Three
represen-tative electropherogram tracings for DNA samples 6 (top), 8 (center) and IO (bottom).
Thermal Cycler 480 (Perkin-Elmer); the final extension at 70°C for IO min was omitted.
Fluorescence Detection of Amplified Products
Model 373 DNA Sequencer. Amplified fragments were
separated by gel electrophoresis on a Model 373 DNA Se-quencer equipped with GENESCAN 672 Fragment Analysis Software (both from PE Applied Biosystems, Foster City, CA, USA). The 0.4-mm denaturing gel contained 6% poly-acrylamide (19 poly-acrylamide: 1 bispoly-acrylamide; Bio-Rad, Her-cules, CA, USA), 8 M urea (Mallinckrodt, Paris, KY, USA) and Ix Tris-borate EDTA buffer (AMRESCO, Solon, OH, USA). Two microliters of the amplification reaction were mixed with 3 fmol of GENESCAN-2500 [ROX] Lane Stan-dard (PE Applied Biosystems) and an equal volume of
for-A L 12 L3 4 L 56 L 7 8 L9IOLlll2Ll314Ll516L
- I
=
a
1-1
i
~
=
e· ::~
E
i ; , -~
=
FBA=·
-=
=
.c.... - ....=
--- -...- ,.0,- -... ---- --..
~ ~=
"'"'""=-"- -~=·. - -
sal
--
-
---
_____.___-
---
--
...
---=-·
--=--=
-=--
-
__
..--
-
--
--- ---
-
-·-·-
-
-
-
--
-
-· -
-
--
-
-
-
..
-
-
--
..
- -
-
..
...
-FESFPS F13BLPL
mamide, denatured at 95°C for 2 min, chilled on ice and loaded on the gel. Electrophoresis was at 30 W constant pow-er for approximately 4 h.
Fluorlmager and FMBIO. Amplified fragments were
separated by electrophoresis in a 0.4-mm denaturing gel con-taining 4% polyacrylamide (19 acrylamide: 1 bisacrylamide; Promega), 7 M urea (Promega) and 0.5x Tris-borate EDTA buffer. A 2.5-µL portion of the amplification reaction was mixed with 2.5 µL loading solution (10 mM NaOH, 95% for-mamide, 0.05% bromophenol blue), denatured at 95°C for 2 min and chilled on ice. A 3-µL portion was loaded on the gel. Electrophoresis was at 40 W constant power for 50-60 min. After electrophoresis, DNA fragments were detected using the Fluorlmager Scanner (Molecular Dynamics, Sunnyvale, CA, USA) or the FMBIO Fluorescent Scanner (Hitachi Soft-ware Engineering America, San Bruno, CA, USA).
B LI 2 L 3 4 L 5 6 L 78L9IOLlll2Ll314Ll516L
---
-- --
..
-
-
- -
-..
..,..-·-
-
-
-F13A FESFPS FI3B
LPL
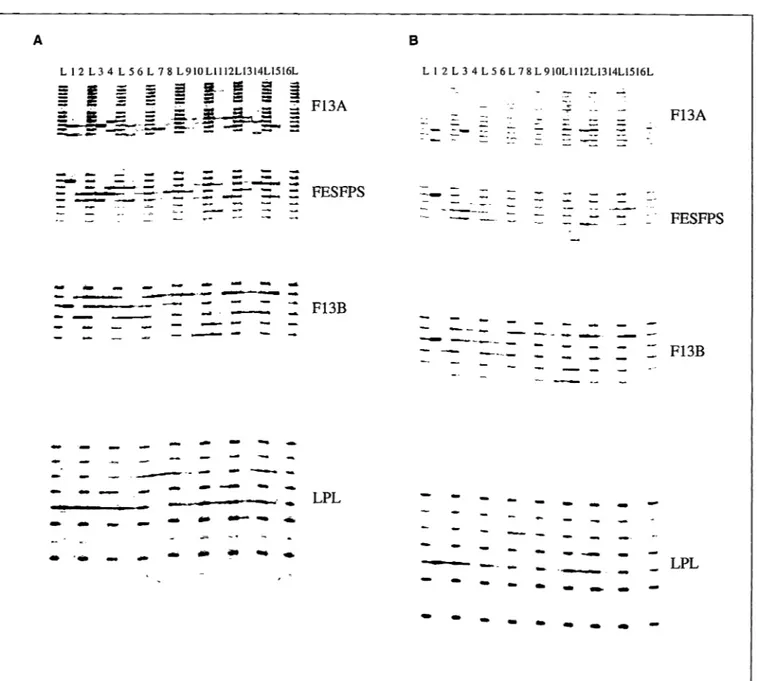
Figure 3. Fluorescence detection of FFFL-amplified DNA fragments. (a) Fluorescence detection using the Fluorlmager. Lanes labeled L contain locus-spe-cific allelic ladders. Lanes numbered 1-14 contain individual-amplified DNA samples. Lane 15 contains amplified DNA from the K562 cell line. Lane 16 c?n-tains negative-control amplification reaction (no template DNA). (b) Fluorescence detection using the FM BIO scanner. Lanes labeled L contain locus-specific allelic ladders. Lanes numbered lanes 1-14 contain individual-amplified DNA samples. Lane 15 contains amplified DNA from the K562 cell line. Lane 16 con-tains negative-control amplification reaction (no template DNA).
RESULTS AND DISCUSSION Model 373 DNA Sequencer Precision
The precision of DNA fragment-length s1zmg by the GENESCAN software on the Model 373 DNA Sequencer was evaluated by performing replicate analysis of allelic
lad-ders. Figure 1 shows representative electropherogram tracings
for the CTIV ladder alleles (labeled with both fluorescein
[FL] and HEX) and the FFFL ladder alleles. Each allele is
re-solved as a discrete peak and, as expected, the size ranges of
the alleles of different loci do not overlap. Fragment-length
sizing is very reproducible, as indicated by the small
coeffi-cients of variation (CV) (Table 1 ). The maximum CV
ob-served was 0.14%. This value indicates a measurement
preci-sion of 99.86%, which is comparable to that observed by other investigators with this instrument (10). Another mea-sure of the precision of the method is the tight range of
frag-ment lengths observed for individual alleles. For most of the
alleles tested, this value was less than one base (Table 1). The
maximum range observed for any allele was 1.3 base, which
is sufficient to ensure unambiguous allele assignment based on the length of the DNA fragment.
Allele Assignments
For Model 373 DNA Sequencer analysis, band sizes were defined for each ladder allele by the mean fragment length of
the precision studies ±4 standard deviations. Statistically,
ap-Ideal for High-Throughput Screening
./ Substrates • PHAS-1 • GST-Jun(l-79) ./ Kinases •PKA •PKC • p38 • JNK • MAPK • ~-IRK •EGFRKD ./ Upstream Activators , JNK • Nonactivated MAPK • p38 ./ Pathway Determinations ·
• PathDetect'" In Vivo Reporting System
./ Drug Screening
• MAP l(jnase Assay l(jt • JNK Assay l(jt
• PathDetcct~ In Vivo Reporting System
./ Central Nervous System Studies
• Cultured human hNT Neurons • hNT BlueNeurons
• hNT-PF Neurons (Purified Frozen)
./ Specificity Studies
• In-Gel Protein Kina<oc Assay Kil
• TK Competent Cells ./ Ava/fable Soon
• Wild-type MEKI • Constitutively-activated MEKI
~TRATAOENE
0 (800) 424-5444Circle Reader Service No. 212
proximately 99.99% of all observations should fall between these boundary values. Allele assignments for fluorescent PCR fragments were then made by comparing the fragment lengths calculated by the GENESCAN software with the band sizes defined for the individual ladder alleles. When us-ing the Fluorlmager or FMBIO fluorescent scanners, alleles were assigned to the fluorescent PCR fragments by visual or software comparison of unknown samples to allelic ladders in adjacent lanes using Fragment Analysis Software and FMBIO Analysis Software supplied with the Fluorlmager and FMBIO instruments, respectively.
Inter-laboratory Validation
In an inter-laboratory validation study, 14 coded DNA
samples (representing both pristine specimens and casework specimens) were amplified in two laboratories using the
fluo-rescein-labeled CITY, HEX-labeled CITY and
fluorescein-labeled FFFL. The amplified DNA fragments were then ana-lyzed using the three laser fluorescence detection instruments. The Model 373 DNA Sequencer data can be viewed either as electropherograms (Figure 2), which display the amplified STR fragments as discrete peaks, or as tabulated data, which display the STR fragment length sizes in base pairs (Table 2). Data obtained with the Fluorlmager Scanner (Figure 3a) and the FMBIO Fluorescent Scanner (Figure 3b) are usually
rep-resented as gel images. A comparison of the FFFL data
ob-tained using the three fluorescence detection instruments
(Table 3; Figure 3, a and b; and data not shown) reveals
iden-C
U
STOM
P
OL
Y
CLONAL
A
IBOD
IIS
For approximately what the university charges for
board and care
,
we do all the work and de
l
iver
t
he product so you are free to concentrate
on research,
not rabbit
w
ra
n
gling
.
Using your peptide o
r
fusion protein,
w
e
will supply you with cus
t
om polyclonal ant
i
bodies
.
Lab Trak
™,our customized soft
w
are,
k
eeps you totally
i
nformed of
:
iniection dates
,
bl
e
ed da
t
es
,
and shipment dates. You will
a
l
so receive low antigen notices (one month before needed) and ho
l
d notices (monthly
when your an
i
ma
l
is inactive)
.
©1996Animol Phorm, In<ANIMA
L P
HARM
SE
R
VICES
I N C O R P O R A T E D
For pricing and delivery
'800) 808 0550
information call toll free:
\
J 1 ~ •USDA• NIH assurances• GLP available
tical FFFL allele assignments. Fluorescence detection of CITV fragments (both fluorescein-labeled and HEX-labeled) also resulted in identical CITV allele assignments for the three analytical methods (data not shown). Thus, for all four-teen samples at all eight STR loci, there was 100% concor-dance in allele assignment among the three fluorescence de-tection methods.
These fluorescent CITV and FFFL systems are well-suit-ed for forensic identity testing. They meet the criteria of an optimal STR profiling system: accuracy, sensitivity, discrimi-nation and robustness. In this study, we were able to distin-guish consistently and unambiguously the THOl-9.3 and THOl-10 alleles and the F13A-3.2 and F13A-4 alleles (Table 3; Figure 3, a and b), whose PCR products differ by one or two base pairs, respectively. Reliable STR profiles were ob-tained with as little as 2 ng of template DNA. An eight-locus STR match using only moderately polymorphic markers of-fers significant power of discrimination. The combined matching probability of the CITV and FFFL systems exceeds 1 in 17 000 000 in all groups tested to date (20).
Finally, this study demonstrates that the fluorescent CITV and FFFL systems are compatible with a variety of instru-mentation. The allelic ladders provide precise and repro-ducible results both within and across formats. Thus, electro-phoretic gel conditions and fragment detection methods can vary considerably without compromising the accuracy of the genetic profile. The inter-laboratory comparison exhibited the consistency, reliability and robustness of the GenePrint™ STR systems (Promega) when detected using the Model 373 DNA Sequencer, Fluorlmager and FMBIO instruments.
Note added in proof. Dming the preparation, review and modification of this work, software available with the Hitachi FMBIO instrument has been expanded to allow line trace dis-plays of individual bands as peaks, peak measurement, three-color detection and automated sizing in addition to the gel display format shown in this work. Also, updated versions of allelic ladders for the CSFlPO and VWF loci now contain 10 alleles each rather than the 9 and 8, respectively, included in Table 1.
ACKNOWLEDGMENTS
This study was supported by the Armed Forces Institute of Pathology (Research Protocol No. UBHF-ACC-CODE-31 M26), the American Registry of Pathology and Promega Corporation. The opinions and assertions contained herein are solely those of the authors and are not to be construed as offi-cial views of the United States Department of Defense or the United States Department of the Almy.
REFERENCES
l.Alford, R.L., ff.A. Hammond, I. Coto and C.T. Caskey. 1994. Rapid and efficient resolution of parentage by amplification of short tandem re-peats. Am. J. Hum. Genet. 55:190-195.
2.Beckman, J.S. and .J,L. Weber. 1992. Survey of human and rat mi-crosatellites. Genomics / 2:627-631.
3.Clayton, T.M., D.L. Fisher, M.M. Holland, D.A. Lee, C.N. Maguire, V.W. Weedn, J.P. Whitaker and P. Gill. 1995. Further validation of the Quad I STR DNA typing system: a collaborative effort to identify victims of a mass disaster. Forensic Sci. Int. 76: 17-25.
4.Edwards, A., A. Civitello, ff.A. Hammond and C.T. Caskey. 1991. DNA typing and genetic mapping with trimeric and tetrameric tandem re-peats. Am. J. Hum. Genet. 49:746-756.
Vol. 23, No. 4 (1997)
5.Edwards, A., ff.A. Hammond, L. Jin, C.T. Caskey and R. Chakra-borty. 1992. Genetic variation at five trimeric and tetrameric tandem re-peat loci in four human population groups. Genomics 12:241-253.
6.Fregeau, C.J. and R.M. Fourney. 1993. DNA typing with fluorescently tagged short tandem repeats: a sensitive and accurate approach to human identification. BioTechniques 15: 100-119.
7.Gill, P., P.L. Ivanov, C. Kimpton, R. Piercy, N. Benson, G. Tully, I. Evett, E. Hagelberg and K. Sullivan. 1994. Identification of the remains of the Romanov family by DNA analysis. Nat. Genet. 6:130-135.
8.Hammond, ff.A., L. Jin, Y. Zhong, C.T. Caskey and R. Chakraborty.
1994. Evaluation of 13 short tandem repeat loci for use in personal identi-fication applications. Am. J. Hum. Genet. 55: 175-189.
9.Holland, M.M., D.L. Fisher, R.K. Roby, J. Ruderman, C. Bryson and V.W. Wecdn. 1995. Mitochondrial DNA sequence analysis of human re-mains. Crime Lab. Dig. 22: 109-115.
IO.Kimpton, C.P., P. Gill, A. Walton, A. Urquhart, E.S. Millican and M. Adams. 1993. Automated DNA profiling employing multiplex amplifica-tion of short tandem repeat loci. PCR Methods Appl. 3: 13-22.
11.Kul'Osakl, K., T. Matsushita and S. Ueda. 1993. Individual DNA identi-fication from ancient human remains. Am. J. Hum. Genet. 53:638-643.
12.Lins, A.M., C.J. Sprecher, C. Puers and J.W. Schumm. 1996. Multi-plex sets for the amplification of polymorphic short tandem repeat loci-silver stain and fluorescent detection. BioTechniques 20:882-889.
13.Mayrand, P.E., K.P. Corcoran, J.S. Ziegle, J.M. Robertson, L.B. Hoff and M.N. Kronick. 1992. The use of fluorescence detection and internal lane standards to size PCR products automatically. Appl. Theor. Elec-trophor. 3: 1-11.
14.Murray, J.C., K.H. Buetow, J.L. Weber, S. Ludwigsen, T. Schcrpbier-Heddema, F. Manion, J. Quillen, V.C. Sheffield et al. 1994. A compre-hensive human linkage map with centimorgan density. Science 265:2049-2054.
15.Parsons, T.J. and V. W. Wcedn. 1997. Preservation and recovery of DNA in postmortem specimens and trace evidence, p. 109-138. /11 W. Hagland and M. Sorg (Eds.), Forensic Taphonomy: The Postmortem Fate of Hu-man Remains, CRC Press. Boca Raton.
16.Polymeropoulos, M.H., D.S. Rath, H. Xiao and C.R. Merl'il, 1991. Tetranucleotide repeat polymorphism at the human c-fes/fps proto-onco-gene (FES). Nucleic Acids Res. /9:4018.
17.Polymeropoulos, M.H., D.S. Rath, H. Xiao and C.R. Merril. 1991. Tetranucleotide repeat polymorphism at the human coagulation factor XIII A subunit gene (Fl3Al). Nucleic Acids Res. 19:4306.
18.Polymeropoulos, M.H., H. Xiao, D.S. Rath and C.R. Merril. 1991. Tetranucleotide repeat polymorphism at the human tyrosine hydroxylase gene (TH). Nucleic Acids Res. 19:3753.
19.Puers, C., ff.A. Hammond, L. Jin, C.T. Caskey and J.W. Schumm.
1993. identification of repeat sequence heterogeneity at the polymorphic short tandem repeat locus HUMTHOl [AATG]0 and reassignment of
alle-les in population analysis by using a locus-specific allelic ladder. Am. J. Hum. Genet. 53:953-958.
20.Schumm, J.W., A.M. Lins, K.A. Micka, C.J. Sprecher, D.R. Rabbach and J. Bacher. 1997. Automated fluorescent detection of STR multiplex-es: Development of the GencPrintrn PowerPlexTM and FFFL multiplexes for forensic and paternity applications, p. 90-104. Proceedings from the First European Symposium on Human Identification, 1996. Promega Cor-poration, Madison, WI.
21.Sprechei·, C.J., C. Puers, A.M. Lins and J. W. Schumm. 1996. A gener-al approach to angener-alysis of polymorphic short tandem repeat loci. BioTech-niques 20:266-276.
22.Sullivan, K.M., S. Pope, P. Gill and J.M. Robertson. 1992. Automated DNA profiling by fluorescent labeling of PCR products. PCR Methods Appli. 2:34-40.
23.Urquhart, A., N.J. Oldroyd, C.P. Kimpton and P. Gill. 1995. Highly discriminating hcptaplex short tandem repeat PCR system for forensic identification. BioTechniques 18:116-121.
24.Weber, J.L. and P.E. May. 1989. Abundant class of human DNA poly-morphisms which can be typed using the polymerase chain reaction. Am. J. Hum. Genet. 44:388-396.
25.Ziegle, ,J.S., Y. Su, K.P. Corcoran, I,. Nie, P.E. Mayrand, L.B. Hoff, L.J. McBride, M.N. Kronick and S.R. Diehl. 1992. Application of au-tomated DNA sizing technology for genotyping microsatellite loci. Ge-nomics 14: 1026-1031.
Address correspondence to Marie D. Ricciardone, Depart-ment of Molecular Biology and Genetics, Faculty of Science, Bilkent University, 06533 Bilkent-Ankara, Turkey. lntemet: [email protected]