References
1. Addington, M. and Schodek, D.: Smart Materials and Technologies for the Architecture and Design Professions. Routledge (2005)
2. Doumpioti, C., Greenberg, E. and Karatzas, K.: Embedded Intelligence: Material Responsiveness in Facade Systems, in: LIFE in:formation, On Responsive Information and Variations in Architecture, pp. 258–262, New York (2010)
3. Duerig, T., Melton, K., Stockel, D. and Wayman, C.: Engineering Aspects of Shape Memory Alloys, Butterworth-Heinemann (1990)
4. Fiorito, F., Sauchelli, M., Arroyo, D., Pesenti, M., Imperadori, M., Masera, G. and Ranzi, G.: Shape Morphing Solar Shadings: A Review, Renew. Sustain. Energy Rev. 55, 863–884 (2015)
5. Gonzalez, N. and More, S.: Self-Adaptive Membrane: Kinetic Passive System. Institute for Advanced Architecture of Catalonia (2015)
6. Grinham, J., Blabolil, R. and Haak, J.: Harvest Shade Screens: Programming Material for Optimal Energy Building Skins. In: Design Agency. pp. 281–290, Los Angeles (2014) 7. Kolarevic, B.: Actualising (Overlooked) Material Capacities, (2015)
8. Kolarevic, B. and Parlac, V.: Adaptive, Responsive Building Skins. In: Building Dynamics: Exploring Architecture of Change. pp. 69–88. Routledge (2015)
9. Mokhtar, S.: Material-Based Actuation of Facades: An Adaptive Performative Approach. University College London (2016)
10. Otsuka, K. and Wayman, C.: Shape Memory Materials. Cambridge (1998)
11. Ritter, A.: Smart Materials in Architecture, Interior Architecture and Design. Birkhäuser (2007)
12. Robaa, S.M.: A Study of Solar Radiation Climate at Cairo Urban Area, Egypt and its Environs. Int. J. Climatol. 26 (13), 1913–1928 (2006)
13. Roudsari, M. and Pak, M.: Ladybug: A Parametric Environmental Plugin for Grasshopper to Help Designers Create an Environmentally-Conscious Design. In: Proceedings of BS2013. pp. 3128–3135, France (2013)
14. Speck, T., Knippers, J. and Speck, O.: Self-X Materials and Structures in Nature and Technology, (2015)
15. Verma, S. and Devadass, P.: Adaptive Skins: Responsive Building Skin Systems based on Tensegrity Principles. AA School of Architecture (2013)
16. The Air Flower, LIFT Architects, http://www.liftarchitects.com/air-flower/, accessed on June 28, 2016
Investigating the role of Entropy in Design Evaluation
Process
A Case Study on Municipality Buildings
Orkan Zeynel Güzelci1
1 İstanbul Kültür University [email protected]
Abstract. The concept of entropy, which can be used to measure physical disorder, has been rediscovered by Shannon to measure the irregularity in information. Entropy measurements are made by considering one or more factors. Specific features such as color, shape, element type, height, material related with architectural compositions can be considered as factors and the amount of information carried by the building depending on one or more of these factors can be measured. In this study, it is questioned whether there is a relationship between entropy values of municipal building competition projects, which are measured in relation to the factors, and the building is considered successful by the competition jury. In order to conduct this examination, the entropy values of the projects, which respected to the same architectural program and won various awards in the project competitions were calculated. Before making comparisons, measurements were made according to solid-void ratios on the plan layout, the shapes of closed and discrete spaces, and the distribution of functions. A discussion was made on the usability of entropy method in the design phase, which gave solid and precise results according to the results of the comparisons.
Keywords: Entropy, Architectural Competition, Municipality Buildings.
1
Introduction
1.1 Aim and Methodology
The rapid development in information and communication technologies has triggered the emergence of innovative design and analysis methods. New techniques and technologies provide a better understanding of the spatial and topological qualities of built environments. It is possible to compute and visualize the various types of information embedded in built environments or buildings using methods such as entropy. Entropy can also be used as an objective measurement method for meaningful comparison of different abstract or concrete architectural compositions.
This study aims to question whether there were optimum entropy values for a certain architectural program such as municipality buildings through architectural competition projects. The second aim of the study was to investigate whether there was a relationship between the achievement of the project in the competition and the calculated entropy value of the project. In order to fit the measurements to be made within the scope of the study to a specific standard, the buildings were first remodeled in computer environment then entropy calculations of each project were made on same 3 factors.
Within the scope of the study, 9 municipality building projects that have attended to 3 national architectural project competitions in Turkey were selected for entropy calculations. According to the quantitative entropy values obtained from measurements based on solid-void, shape and color(function) factors, different municipality buildings were compared and the findings were explained.
2
Main Concepts of Entropy and Basic Entropy Equation
Although the entropy concept was introduced to measure physical disorder, it was rediscovered by Shannon and Weaver [1] to measure the irregularity in information in 1949. To be able to make an entropy measurement, it is necessary to have factor and levels related to the factors. For instance, the letter sequence "AAAAAAA" consists of 7 units. The only factor encountered in the example line is the "letter". In addition, the only level of this factor is the letter "A". All the units forming the sequence point to the uniformity and entropy takes the value of zero. On the other hand, when all units such as "ABCDEFG" are different, the level as much as units is encountered. Total diversity is dominant in this case and entropy has the highest value [2].
The basic equation that can be used to calculate the entropy is shown in Figure 2. In the equation, H correspondence to the entropy calculated according to a factor and is calculated in terms of bits; p is the level of probability of a factor occurrence. [2-3].
Fig. 1. Basit entropy equation [4]
In the example, string with ten elements made of letters were randomly generated with four elements (A, B, C, D). When the end product was ABBCCCDDDD, there was one A, two Bs, three Cs and four Ds in the string. In this case, the probability of finding the letters in the series was 1/10, 2/10, 3/10 and 4/10, respectively. The entropy value of the letter sequence was calculated as H = 1,84 bits via summing these probabilities in the order in place of the pi in the equation [4].
One of the difficulties encountered in entropy measurement studies are that the calculation has been performed based on multiple factors, all independent of each other. Where the factors are independent of one another, the total entropy equals the sum of the entropy values measured for each factor.
Fig. 2. Calculating the entropy value of a letter array
3
Measuring the Entropy of Architecture
Meaningful comparison of different buildings may be possible using a standard measurement method such as entropy. In this paper, we examined two studies that have different approaches to entropy calculations.
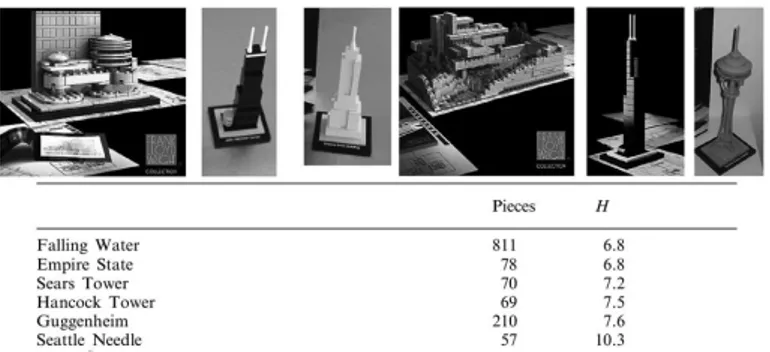
In his study, Crompton[3] focused on the question of whether the amount of information contained in the building carries a meaning. According to Crompton, the entropy of a structure consisting of repeated pieces can be found by measuring the entropies of the pieces and the entropy of a structure is the average of the amount of information measured in bits for parts.
In the Crompton [3]’s article, the building's information content was measured by modeling the building with LEGO blocks. The entropy values of the parts were calculated according to the frequency of usage between the LEGO parts produced until 2010. LEGO models can have high or low entropy values relative to ordinary or unique parts they contain. According to calculations, entropy values per piece of buildings well known in the architectural literature varies from 6 to 10 bits [3].
Fig. 3. Entropy calculations of LEGO Architecture sets [3]
In Figure 3, entropy calculations of LEGO Architecture sets of 6 different 20th century buildings were made by Crompton. Yet the two Frank Lloyd Wright’s building models are much smaller than others in scale, they are more complicated than the towers. According to Crompton[3]’s findings, the vocabulary of modern architecture can be elegant and simple; however, it plays a minor role in the growth of
This study aims to question whether there were optimum entropy values for a certain architectural program such as municipality buildings through architectural competition projects. The second aim of the study was to investigate whether there was a relationship between the achievement of the project in the competition and the calculated entropy value of the project. In order to fit the measurements to be made within the scope of the study to a specific standard, the buildings were first remodeled in computer environment then entropy calculations of each project were made on same 3 factors.
Within the scope of the study, 9 municipality building projects that have attended to 3 national architectural project competitions in Turkey were selected for entropy calculations. According to the quantitative entropy values obtained from measurements based on solid-void, shape and color(function) factors, different municipality buildings were compared and the findings were explained.
2
Main Concepts of Entropy and Basic Entropy Equation
Although the entropy concept was introduced to measure physical disorder, it was rediscovered by Shannon and Weaver [1] to measure the irregularity in information in 1949. To be able to make an entropy measurement, it is necessary to have factor and levels related to the factors. For instance, the letter sequence "AAAAAAA" consists of 7 units. The only factor encountered in the example line is the "letter". In addition, the only level of this factor is the letter "A". All the units forming the sequence point to the uniformity and entropy takes the value of zero. On the other hand, when all units such as "ABCDEFG" are different, the level as much as units is encountered. Total diversity is dominant in this case and entropy has the highest value [2].
The basic equation that can be used to calculate the entropy is shown in Figure 2. In the equation, H correspondence to the entropy calculated according to a factor and is calculated in terms of bits; p is the level of probability of a factor occurrence. [2-3].
Fig. 1. Basit entropy equation [4]
In the example, string with ten elements made of letters were randomly generated with four elements (A, B, C, D). When the end product was ABBCCCDDDD, there was one A, two Bs, three Cs and four Ds in the string. In this case, the probability of finding the letters in the series was 1/10, 2/10, 3/10 and 4/10, respectively. The entropy value of the letter sequence was calculated as H = 1,84 bits via summing these probabilities in the order in place of the pi in the equation [4].
One of the difficulties encountered in entropy measurement studies are that the calculation has been performed based on multiple factors, all independent of each other. Where the factors are independent of one another, the total entropy equals the sum of the entropy values measured for each factor.
Fig. 2. Calculating the entropy value of a letter array
3
Measuring the Entropy of Architecture
Meaningful comparison of different buildings may be possible using a standard measurement method such as entropy. In this paper, we examined two studies that have different approaches to entropy calculations.
In his study, Crompton[3] focused on the question of whether the amount of information contained in the building carries a meaning. According to Crompton, the entropy of a structure consisting of repeated pieces can be found by measuring the entropies of the pieces and the entropy of a structure is the average of the amount of information measured in bits for parts.
In the Crompton [3]’s article, the building's information content was measured by modeling the building with LEGO blocks. The entropy values of the parts were calculated according to the frequency of usage between the LEGO parts produced until 2010. LEGO models can have high or low entropy values relative to ordinary or unique parts they contain. According to calculations, entropy values per piece of buildings well known in the architectural literature varies from 6 to 10 bits [3].
Fig. 3. Entropy calculations of LEGO Architecture sets [3]
In Figure 3, entropy calculations of LEGO Architecture sets of 6 different 20th century buildings were made by Crompton. Yet the two Frank Lloyd Wright’s building models are much smaller than others in scale, they are more complicated than the towers. According to Crompton[3]’s findings, the vocabulary of modern architecture can be elegant and simple; however, it plays a minor role in the growth of
complexity. Crompton also claims that, as days go by in cities, architecturally interesting and unexpected buildings and parts of these buildings are encountered. In this case, many new cases increase the entropy of cities and structures [3].
Against the Crompton’s approach [3], which explains that entropy of a structure
can be calculated by considering the entire LEGO space, Stamps [6] claims that the information content of the building can only be calculated from the LEGO parts that make up the building. According to Stamps [6], counting only the different parts of a building is a more appropriate approach to calculate entropy.
Stamps [6] created a LEGO set containing 884 pieces while developing the method in the study. LEGO parts have two features as shape and color. For parts in the LEGO884 language, shape entropy and color entropy were calculated as 4.27 and 3.17, respectively, and the overall entropy of the set was calculated as 7.44 bits. LEGO100 set was formed with 100 pieces randomly selected from 884 pieces. The average entropy of the LEGO100 set was calculated as 1.87 bits per piece.
Fig. 4. Experimental design with LEGO bricks [6]
As illustrated in Figure 4, 12 LEGO models had 7 different shapes and 6 different colors. Entropies of 12 produced models vary between 0 bit and 6.23 bits. Stamps in his study [6] investigates the relationship between perceived diversity and entropy measured on the model. Stamps [6] showed the 12 LEGO models to participants and asked them to sort LEGO models from monotonous to diverse. As a result, while the correlation between color entropy and perceived diversity was r = 0.969, the correlation between shape entropy and perceived diversity was r = 0.015. As a result, visual diversity can be estimated by measuring the entropy of the parts and by calculating the total entropy.
4
Case Study: Measuring the Entropy of Municipality Building
Projects
Previous approaches emphasize that entropy is a method that can be used to analyze both abstract compositions and built environments. In Crompton's work, all calculations made through Lego models are only related to a single factor that is shape of the parts. On the other hand, Stamps make the entropy calculations of abstract compositions are based on color and shape factors, in the evaluation phase the factors are considered separate and independent from each other. In both studies, it is clear that there are no certain weights considered among the factors during calculations.
In the proposed model, entropy calculations are made according to 3 different factors. The first two factors, which are solid-void ratio and shape of perceived distinct spaces of the building, can be examined in all kind of building typologies. In this study, the third factor, color is used to represent the functional distribution in the building.
The proposed model first investigates whether there is an optimum entropy value for a specialized building typology. Prior to begin calculations, the design brief and architectural programs for 3 competitions were obtained and examined. In brief and architectural programs, the requested functional distribution and solid-void ratios are given to the architects who participate to the competition. These two ratios and the entropy values of all chosen projects were calculated for each factor. In the competition brief, instead of specifying the shapes of required spaces, the sizes of these spaces are specified in square meters. For example, edge lengths 3 to 8 meters or 4 to 6 meters can form a space of 24 square meters. In this case, it can be said that there is no definite information about the shape of the spaces in the competition brief. For this reason, it is not possible to calculate the optimum shape entropy. In this study, because of the limited content of the competition briefs, factors such as facade shape, facade color, height or solid-void ratio of facade excluded
The model also measures the various entropy values of buildings that have been successful and unsuccessful in architectural competitions and questions the relationship between success/achievement and entropy value. In the scope of the research;
-Bornova Municipality Building (2015) -Efeler Municipality Building (2016)
-Inegol Municipality Building (2016) competitions were examined.
It is aimed to select 3 projects for each competition, to investigate different approaches for the same program and accordingly whether there are different entropy values. Factors such as solid-void ratio, building style, façade shape, building shape, window shape, scale, color, silhouette, material and articulation about which many studies conducted in the literature can be measured with entropy. In the study, the entropy of the buildings was measured by utilizing the modularity, form and color(function) characteristics that are the most basic features of a municipality building.
4.1 Solid-Void Entropy
The solid-void entropy is calculated by counting the solid and void cells in the floor plans remodeled on a grid. Firstly, according to the areas given in the brief of the competition, the optimum entropy calculation was made according to the solid-void ratios required by the organization committee of the competition. Afterwards, solid-void entropy was calculated for 3 projects from 3 different competitions. As a result, it was seen that project with the entropy closer to optimum entropy value was the most successful projects in the case of Bornova Municipality.
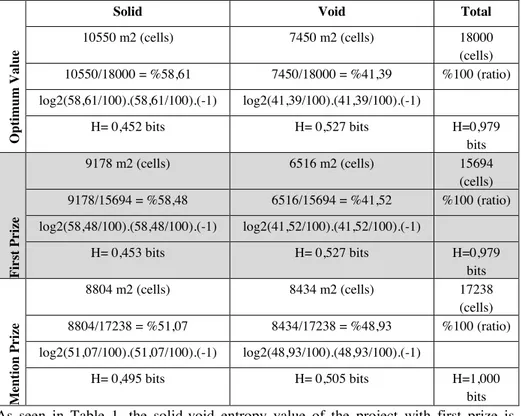
Table 1. Solid-void entropy values of projects from Bornova Municipality Competition. O ptim um Va lu e
Solid Void Total
10550 m2 (cells) 7450 m2 (cells) 18000 (cells) 10550/18000 = %58,61 7450/18000 = %41,39 %100 (ratio) log2(58,61/100).(58,61/100).(-1) log2(41,39/100).(41,39/100).(-1) H= 0,452 bits H= 0,527 bits H=0,979 bits Fi rst P rize 9178 m2 (cells) 6516 m2 (cells) 15694 (cells) 9178/15694 = %58,48 6516/15694 = %41,52 %100 (ratio) log2(58,48/100).(58,48/100).(-1) log2(41,52/100).(41,52/100).(-1) H= 0,453 bits H= 0,527 bits H=0,979 bits Menti on Priz e 8804 m2 (cells) 8434 m2 (cells) 17238 (cells) 8804/17238 = %51,07 8434/17238 = %48,93 %100 (ratio) log2(51,07/100).(51,07/100).(-1) log2(48,93/100).(48,93/100).(-1) H= 0,495 bits H= 0,505 bits H=1,000 bits As seen in Table 1, the solid-void entropy value of the project with first prize is exactly the same with the optimum value given in the brief. The solid-void entropy value of the mention prize winner project is unrelated to the optimum value.
Table 2. Optimum Solid-void entropy values of Efeler Municipality Competition.
O ptim um Va lu e
Solid Void Total
10620 m2 (cells) 4100 m2 (cells) 14720 (cells) 10620/14720 = %72,15 4100/14720= %27,85 %100 (ratio) log2(72,15/100).(72,15/100).(-1) log2(27,85/100).(27,85/100).(-1) H= 0,340 bits H= 0,514 bits H=0,853 bits
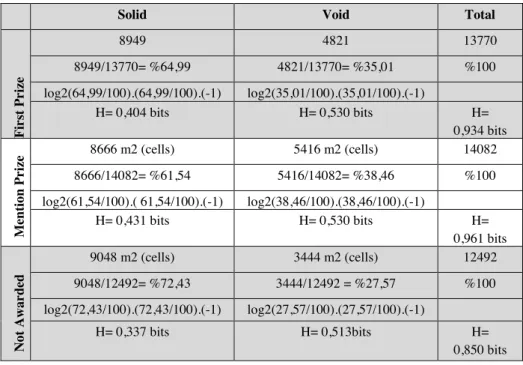
Table 3. Solid-void entropy values of projects from Efeler Municipality Competition.
Solid Void Total
Fi rst P rize 8949 4821 13770 8949/13770= %64,99 4821/13770= %35,01 %100 log2(64,99/100).(64,99/100).(-1) log2(35,01/100).(35,01/100).(-1) H= 0,404 bits H= 0,530 bits H= 0,934 bits Menti on Priz e 8666 m2 (cells) 5416 m2 (cells) 14082 8666/14082= %61,54 5416/14082= %38,46 %100 log2(61,54/100).( 61,54/100).(-1) log2(38,46/100).(38,46/100).(-1) H= 0,431 bits H= 0,530 bits H= 0,961 bits No t A wa rd ed 9048 m2 (cells) 3444 m2 (cells) 12492 9048/12492= %72,43 3444/12492 = %27,57 %100 log2(72,43/100).(72,43/100).(-1) log2(27,57/100).(27,57/100).(-1) H= 0,337 bits H= 0,513bits H= 0,850 bits Different from Bornova Municipality Building Competition, the entropy of the winner of the first prize in Efeler Municipality Building Competition does not correlate with optimum value. On the other hand, the results of calculations also show that a non-awarded project has the closest entropy to the optimum entropy value.
4.2 Shape Entropy
Before starting shape entropy calculations, the volumes that construct the buildings were redrawn as closed polygons and polygons with same sizes are clustered. After, the entropy values of each volume were calculated according to the usage frequency of the used parts in the whole building. By summing the entropy values of all the parts(volumes), the total shape entropy of the building was calculated(Table 4). This type of approach differs from the Stamps’s work [6], which creates abstract designs
with its own LEGO vocabulary, as well as from Crompton’s study [3], which
construct the building with a predefined LEGO set. In this study, shape of the parts are obtained from the analysis on buildings.
The equal distribution of the parts with same size can be construct the building that results with the maximum shape entropy. However, the equal distribution, shape and size of each piece will lead to meaningless spaces in building scale. Therefore, it is not possible to mention an optimum value for shape entropy. In the calculations made, it is seen that the shape entropies of the buildings are different according to both in all building and on the floor plans.
Table 1. Solid-void entropy values of projects from Bornova Municipality Competition. O ptim um Va lu e
Solid Void Total
10550 m2 (cells) 7450 m2 (cells) 18000 (cells) 10550/18000 = %58,61 7450/18000 = %41,39 %100 (ratio) log2(58,61/100).(58,61/100).(-1) log2(41,39/100).(41,39/100).(-1) H= 0,452 bits H= 0,527 bits H=0,979 bits Fi rst P rize 9178 m2 (cells) 6516 m2 (cells) 15694 (cells) 9178/15694 = %58,48 6516/15694 = %41,52 %100 (ratio) log2(58,48/100).(58,48/100).(-1) log2(41,52/100).(41,52/100).(-1) H= 0,453 bits H= 0,527 bits H=0,979 bits Menti on Priz e 8804 m2 (cells) 8434 m2 (cells) 17238 (cells) 8804/17238 = %51,07 8434/17238 = %48,93 %100 (ratio) log2(51,07/100).(51,07/100).(-1) log2(48,93/100).(48,93/100).(-1) H= 0,495 bits H= 0,505 bits H=1,000 bits As seen in Table 1, the solid-void entropy value of the project with first prize is exactly the same with the optimum value given in the brief. The solid-void entropy value of the mention prize winner project is unrelated to the optimum value.
Table 2. Optimum Solid-void entropy values of Efeler Municipality Competition.
O ptim um Va lu e
Solid Void Total
10620 m2 (cells) 4100 m2 (cells) 14720 (cells) 10620/14720 = %72,15 4100/14720= %27,85 %100 (ratio) log2(72,15/100).(72,15/100).(-1) log2(27,85/100).(27,85/100).(-1) H= 0,340 bits H= 0,514 bits H=0,853 bits
Table 3. Solid-void entropy values of projects from Efeler Municipality Competition.
Solid Void Total
Fi rst P rize 8949 4821 13770 8949/13770= %64,99 4821/13770= %35,01 %100 log2(64,99/100).(64,99/100).(-1) log2(35,01/100).(35,01/100).(-1) H= 0,404 bits H= 0,530 bits H= 0,934 bits Menti on Priz e 8666 m2 (cells) 5416 m2 (cells) 14082 8666/14082= %61,54 5416/14082= %38,46 %100 log2(61,54/100).( 61,54/100).(-1) log2(38,46/100).(38,46/100).(-1) H= 0,431 bits H= 0,530 bits H= 0,961 bits No t A wa rd ed 9048 m2 (cells) 3444 m2 (cells) 12492 9048/12492= %72,43 3444/12492 = %27,57 %100 log2(72,43/100).(72,43/100).(-1) log2(27,57/100).(27,57/100).(-1) H= 0,337 bits H= 0,513bits H= 0,850 bits Different from Bornova Municipality Building Competition, the entropy of the winner of the first prize in Efeler Municipality Building Competition does not correlate with optimum value. On the other hand, the results of calculations also show that a non-awarded project has the closest entropy to the optimum entropy value.
4.2 Shape Entropy
Before starting shape entropy calculations, the volumes that construct the buildings were redrawn as closed polygons and polygons with same sizes are clustered. After, the entropy values of each volume were calculated according to the usage frequency of the used parts in the whole building. By summing the entropy values of all the parts(volumes), the total shape entropy of the building was calculated(Table 4). This type of approach differs from the Stamps’s work [6], which creates abstract designs
with its own LEGO vocabulary, as well as from Crompton’s study [3], which
construct the building with a predefined LEGO set. In this study, shape of the parts are obtained from the analysis on buildings.
The equal distribution of the parts with same size can be construct the building that results with the maximum shape entropy. However, the equal distribution, shape and size of each piece will lead to meaningless spaces in building scale. Therefore, it is not possible to mention an optimum value for shape entropy. In the calculations made, it is seen that the shape entropies of the buildings are different according to both in all building and on the floor plans.
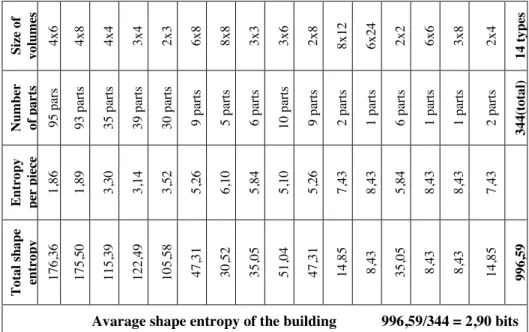
Table 4. Calculated Shape Entropy of the Mention Prize Winner Project in Efeler Municipality Building Competition Size o f vol ume s 4x6 4x8 4x4 3x4 2x3 6x8 8x8 3x3 3x6 2x8 8x12 6x24 2x2 6x6 3x8 2x4 14 t yp es Nu m ber of p ar ts 95 pa rs 93 pa rts 35 pa rts 39 pa rts 30 pa rts 9 p arts 5 p arts 6 p arts 10 p arts 9 p arts 2 p arts 1 p arts 6 p arts 1 p arts 1 p arts 2 p arts 344 (tot al ) En tr op y per p iec e 1, 86 1, 89 3, 30 3, 14 3, 52 5, 26 6, 10 5, 84 5, 10 5, 26 7, 43 8, 43 5, 84 8, 43 8, 43 7, 43 To ta l sh ap e en tro py 17 6, 36 17 5, 50 11 5, 39 12 2, 49 10 5, 58 47, 31 30, 52 35, 05 51, 04 47 ,3 1 14, 85 8, 43 35, 05 8, 43 8, 43 14, 85 99 6, 59
Avarage shape entropy of the building 996,59/344 = 2,90 bits The project information given in Table 4 has 2.90 bits average shape entropy while the all building is constructed only with 14 different volumes. Besides, the project that won the first prize in Efeler Municipality Building Competition used 45 different shapes in various numbers to create the building and has 4.68 bits shape entropy. 4.3 Color Entropy
The colors of the parts were used to express the functions of the spaces on the floors of the buildings were analyzed. Entropy can be calculated according to the proportions of the functional distributions of the spaces located on the floor as well as calculating the distribution of colors in an abstract composition. There are five very common functions in the brief and assignment of the projects examined. These functions can be listed as; offices, meeting rooms, service, archive and circulation. Buildings with the same number of functions can be compared in terms of functional distribution (color entropy). For example, in a building with 8 functions (colors) 3 bits are the maximum entropy value that reached as a result of equal distribution of functions. However, there are no instances where all functions are uniformly distributed in the buildings.
Fig. 5. Coloring different Bornova Municipality Projects according to the functions Table 5. Calculated Color Entropy of Bornova Municipality Project Competition
O ptim um Va lu e
office meeting service archive circulation total
7540 935 1495 580 7450 18000 7540/18000 935/18000 1495/18000 580/18000 7450/18000 %41,89 %5,19 %8,31 %3,22 %41,39 %100 log2(41,89/ 100). (41,89/100) .(-1) log2(5,19/1 00). (5,19/100). (-1) log2(8,31/1 00) (8,31/100). (-1) log2(3,22/1 00). (3,22/100).( -1) log2(41,39/ 100). (41,39/100) .(-1)
0,53 bits 0,22 bits 0,30 bits 0,16 bits 0,53 bits 1,73
Fi rst P rize %48,73 %8,13 %5,30 %3,38 %35,17 %100 log2(48,03/ 100). (48,03/100) .(-1) log2(8,13/1 00) (8,13/100). (-1) log2(5,30/1 00). (5,30/100). (-1) log2(3,38/1 00). (3,38/100). (-1) log2(35,17/ 100). (35,17/100) .(-1)
0,51 bits 0,29 bits 0,22 bits 0,17 bits 0,53 bits 1,73
Menti on Priz e %40,70 %11,19 %8,31 %0,44 %39,35 %100 log2(40,70/ 100). (40,70/100) .(-1) log2(11,19/ 100) (11,19/100) .(-1) log2(8,31/1 00). (8,31/100). (-1) log2(0,44/1 00). (0,44/100). (-1) log2(39,35/ 100). (39,35/100) .(-1)
0,53 bits 0,35 bits 0,30 bits 0,03 bits 0,53 bits 1,74
The optimum color(function) entropy of Bornova Municipality Building Competition is calculated as 1,73 bits according to the brief. The total entropy of the first prize winning project is also calculated as 1,73 bits. However, the optimum entropy values of various factors and values obtained from winner of first prize differ from each other. For instance, the optimum entropy value of the service function is calculated as 0,30 bits, on the other hand the service function of first prize carry 0,22 bits of information.
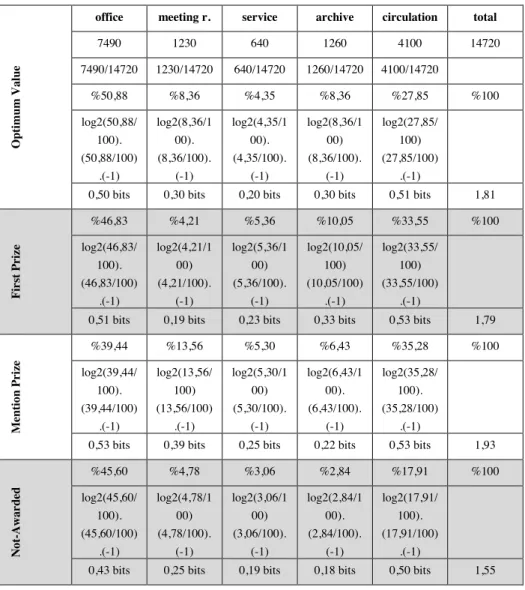
Fig. 6. Coloring different Efeler Municipality Projects according to the functions Table 6. Calculated Color Entropy of Efeler Municipality Project Competition
Op
timum
V
al
ue
office meeting r. service archive circulation total
7490 1230 640 1260 4100 14720 7490/14720 1230/14720 640/14720 1260/14720 4100/14720 %50,88 %8,36 %4,35 %8,36 %27,85 %100 log2(50,88/ 100). (50,88/100) .(-1) log2(8,36/1 00). (8,36/100). (-1) log2(4,35/1 00). (4,35/100). (-1) log2(8,36/1 00) (8,36/100). (-1) log2(27,85/ 100) (27,85/100) .(-1)
0,50 bits 0,30 bits 0,20 bits 0,30 bits 0,51 bits 1,81
Fi rst Pr iz e %46,83 %4,21 %5,36 %10,05 %33,55 %100 log2(46,83/ 100). (46,83/100) .(-1) log2(4,21/1 00) (4,21/100). (-1) log2(5,36/1 00) (5,36/100). (-1) log2(10,05/ 100) (10,05/100) .(-1) log2(33,55/ 100) (33,55/100) .(-1)
0,51 bits 0,19 bits 0,23 bits 0,33 bits 0,53 bits 1,79
Me nt io n P riz e %39,44 %13,56 %5,30 %6,43 %35,28 %100 log2(39,44/ 100). (39,44/100) .(-1) log2(13,56/ 100) (13,56/100) .(-1) log2(5,30/1 00) (5,30/100). (-1) log2(6,43/1 00). (6,43/100). (-1) log2(35,28/ 100). (35,28/100) .(-1)
0,53 bits 0,39 bits 0,25 bits 0,22 bits 0,53 bits 1,93
No t-Awa rd ed %45,60 %4,78 %3,06 %2,84 %17,91 %100 log2(45,60/ 100). (45,60/100) .(-1) log2(4,78/1 00) (4,78/100). (-1) log2(3,06/1 00) (3,06/100). (-1) log2(2,84/1 00). (2,84/100). (-1) log2(17,91/ 100). (17,91/100) .(-1)
0,43 bits 0,25 bits 0,19 bits 0,18 bits 0,50 bits 1,55
Calculated optimum color entropy of Efeler Municipality Building is 1,79 bits. The calculations show that first prize winning project has the closest value to the optimum, whereas mention prize winner project and not-awarded project has values of 1,93 and 1,55 bits.
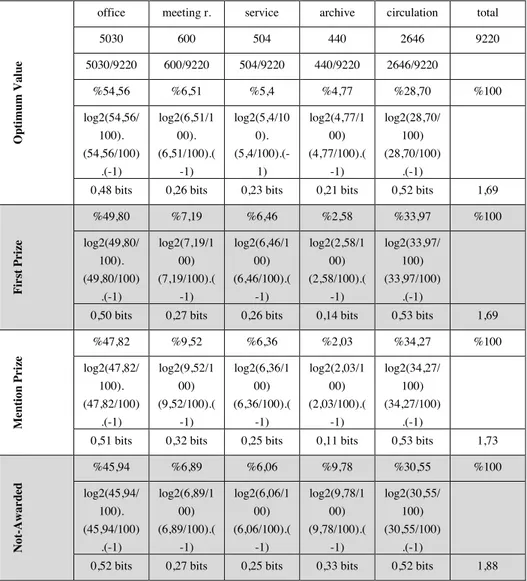
Table 7. Calculated Functional Distribution/Color Entropy of İnegöl Municipality Architectural Project Competition
Op
timum
V
al
ue
office meeting r. service archive circulation total 5030 600 504 440 2646 9220 5030/9220 600/9220 504/9220 440/9220 2646/9220 %54,56 %6,51 %5,4 %4,77 %28,70 %100 log2(54,56/ 100). (54,56/100) .(-1) log2(6,51/1 00). (6,51/100).( -1) log2(5,4/10 0). (5,4/100).(-1) log2(4,77/1 00) (4,77/100).( -1) log2(28,70/ 100) (28,70/100) .(-1)
0,48 bits 0,26 bits 0,23 bits 0,21 bits 0,52 bits 1,69
Fi rst Pr iz e %49,80 %7,19 %6,46 %2,58 %33,97 %100 log2(49,80/ 100). (49,80/100) .(-1) log2(7,19/1 00) (7,19/100).( -1) log2(6,46/1 00) (6,46/100).( -1) log2(2,58/1 00) (2,58/100).( -1) log2(33,97/ 100) (33,97/100) .(-1)
0,50 bits 0,27 bits 0,26 bits 0,14 bits 0,53 bits 1,69
Me nt io n P riz e %47,82 %9,52 %6,36 %2,03 %34,27 %100 log2(47,82/ 100). (47,82/100) .(-1) log2(9,52/1 00) (9,52/100).( -1) log2(6,36/1 00) (6,36/100).( -1) log2(2,03/1 00) (2,03/100).( -1) log2(34,27/ 100) (34,27/100) .(-1)
0,51 bits 0,32 bits 0,25 bits 0,11 bits 0,53 bits 1,73
No t-Awa rd ed %45,94 %6,89 %6,06 %9,78 %30,55 %100 log2(45,94/ 100). (45,94/100) .(-1) log2(6,89/1 00) (6,89/100).( -1) log2(6,06/1 00) (6,06/100).( -1) log2(9,78/1 00) (9,78/100).( -1) log2(30,55/ 100) (30,55/100) .(-1)
0,52 bits 0,27 bits 0,25 bits 0,33 bits 0,52 bits 1,88
The value calculated as the result of the distributions given in the brief of the examined municipal buildings was considered as optimum value and the entropy value obtained from the functional distribution of buildings was compared with the optimum value. As a consequence, the closeness of the entropy value to the optimal value has been associated with the success of the building in the competition.
Fig. 6. Coloring different Efeler Municipality Projects according to the functions Table 6. Calculated Color Entropy of Efeler Municipality Project Competition
Op
timum
V
al
ue
office meeting r. service archive circulation total
7490 1230 640 1260 4100 14720 7490/14720 1230/14720 640/14720 1260/14720 4100/14720 %50,88 %8,36 %4,35 %8,36 %27,85 %100 log2(50,88/ 100). (50,88/100) .(-1) log2(8,36/1 00). (8,36/100). (-1) log2(4,35/1 00). (4,35/100). (-1) log2(8,36/1 00) (8,36/100). (-1) log2(27,85/ 100) (27,85/100) .(-1)
0,50 bits 0,30 bits 0,20 bits 0,30 bits 0,51 bits 1,81
Fi rst Pr iz e %46,83 %4,21 %5,36 %10,05 %33,55 %100 log2(46,83/ 100). (46,83/100) .(-1) log2(4,21/1 00) (4,21/100). (-1) log2(5,36/1 00) (5,36/100). (-1) log2(10,05/ 100) (10,05/100) .(-1) log2(33,55/ 100) (33,55/100) .(-1)
0,51 bits 0,19 bits 0,23 bits 0,33 bits 0,53 bits 1,79
Me nt io n P riz e %39,44 %13,56 %5,30 %6,43 %35,28 %100 log2(39,44/ 100). (39,44/100) .(-1) log2(13,56/ 100) (13,56/100) .(-1) log2(5,30/1 00) (5,30/100). (-1) log2(6,43/1 00). (6,43/100). (-1) log2(35,28/ 100). (35,28/100) .(-1)
0,53 bits 0,39 bits 0,25 bits 0,22 bits 0,53 bits 1,93
No t-Awa rd ed %45,60 %4,78 %3,06 %2,84 %17,91 %100 log2(45,60/ 100). (45,60/100) .(-1) log2(4,78/1 00) (4,78/100). (-1) log2(3,06/1 00) (3,06/100). (-1) log2(2,84/1 00). (2,84/100). (-1) log2(17,91/ 100). (17,91/100) .(-1)
0,43 bits 0,25 bits 0,19 bits 0,18 bits 0,50 bits 1,55
Calculated optimum color entropy of Efeler Municipality Building is 1,79 bits. The calculations show that first prize winning project has the closest value to the optimum, whereas mention prize winner project and not-awarded project has values of 1,93 and 1,55 bits.
Table 7. Calculated Functional Distribution/Color Entropy of İnegöl Municipality Architectural Project Competition
Op
timum
V
al
ue
office meeting r. service archive circulation total 5030 600 504 440 2646 9220 5030/9220 600/9220 504/9220 440/9220 2646/9220 %54,56 %6,51 %5,4 %4,77 %28,70 %100 log2(54,56/ 100). (54,56/100) .(-1) log2(6,51/1 00). (6,51/100).( -1) log2(5,4/10 0). (5,4/100).(-1) log2(4,77/1 00) (4,77/100).( -1) log2(28,70/ 100) (28,70/100) .(-1)
0,48 bits 0,26 bits 0,23 bits 0,21 bits 0,52 bits 1,69
Fi rst Pr iz e %49,80 %7,19 %6,46 %2,58 %33,97 %100 log2(49,80/ 100). (49,80/100) .(-1) log2(7,19/1 00) (7,19/100).( -1) log2(6,46/1 00) (6,46/100).( -1) log2(2,58/1 00) (2,58/100).( -1) log2(33,97/ 100) (33,97/100) .(-1)
0,50 bits 0,27 bits 0,26 bits 0,14 bits 0,53 bits 1,69
Me nt io n P riz e %47,82 %9,52 %6,36 %2,03 %34,27 %100 log2(47,82/ 100). (47,82/100) .(-1) log2(9,52/1 00) (9,52/100).( -1) log2(6,36/1 00) (6,36/100).( -1) log2(2,03/1 00) (2,03/100).( -1) log2(34,27/ 100) (34,27/100) .(-1)
0,51 bits 0,32 bits 0,25 bits 0,11 bits 0,53 bits 1,73
No t-Awa rd ed %45,94 %6,89 %6,06 %9,78 %30,55 %100 log2(45,94/ 100). (45,94/100) .(-1) log2(6,89/1 00) (6,89/100).( -1) log2(6,06/1 00) (6,06/100).( -1) log2(9,78/1 00) (9,78/100).( -1) log2(30,55/ 100) (30,55/100) .(-1)
0,52 bits 0,27 bits 0,25 bits 0,33 bits 0,52 bits 1,88
The value calculated as the result of the distributions given in the brief of the examined municipal buildings was considered as optimum value and the entropy value obtained from the functional distribution of buildings was compared with the optimum value. As a consequence, the closeness of the entropy value to the optimal value has been associated with the success of the building in the competition.
Fig. 5. Coloring floor plans of 2 projects according to the functions Table 8. Graphical representation of results based on entropy calculations
5
Conclusion and Discussion
Stamps [6] has studied the relationship of singular or multiple factors to visualize complexity and its effects. Stamps also emphasizes that using the right variety of visual complexity is an important aspect of design in place of disordered or monotonous situations. Crompton [3] makes comments on modern and contemporary building shapes depending on the amount of entropy measured. Stamps measures the entropy of design factors such as façade color, window shape, roof shape and height of buildings in his works and produces designs with the desired entropy value using multiple factors. But up to now studies have not examined the relationship of a building with entropy and an specialized architectural typology. In this study, the relation between the entropy value calculated on the data in the brief/architectural program and the success achieved in the competition by the designed building was examined.
Many factors are encountered in the process of designing a building. One of these factors is brief/assignment. Although the theme of the three examined competitions was the design of the municipal building, optimum values for solid-void and functional distribution(color) entropy vary in the briefs for buildings. According to the results of the study, only the required entropy value in the given brief is not sufficient for evaluation the project as successful. Furthermore, it is not possible to obtain information that the monotonous or disordered building is closer to win a prize. When the floor plan is considered to be a canvas of color, the expected complexity can be produced with color patches representing the required size and function. Although this composition produced satisfactory amount of the expected value of entropy, regulation such as content and function cannot be ignored in the design and arrangement of functions represented with colors will not be logical. In this study, the factors such as shape, solid-void ratio and function are examined independently from each other, but all calculations are made with using the same method and equation.
The use of entropy method results in objective and invariable results. Apart from physical features of the building, besides measuring the building itself, many factors encountered such as the relationship with the environment and the environmental conditions. However, jury evaluation is a subjective decision-making environment. Designing with entropy could have been successful if assessments were to be carried out on a check board by holding numerical values and evaluating certain criteria individually.
From all these results, it can be said that a strict calculation method cannot be used solely to evaluate the success of the architecture. In this context, entropy can be used as an input in design; however, it seems that designing only according to entropy cannot produce designs that can be considered successful. When achievement of a building was observed, it is seen that qualitative ones are more dominant than quantifiable and non-quantifiable factors values by entropy.
References
1. Shannon, C. E. and Weaver, W.: The mathematical theory of information. (1949)
2. Stamps, A. E.: Entropy and visual diversity in the environment. Journal of Architectural and Planning Research, 239-256 (2004)
3. Crompton, A.: The entropy of LEGO®. Environment and Planning B: Planning and Design 39.1, 174-182 (2012)
4. Stamps, A. E.: Advances in visual diversity and entropy. Environment and Planning B: Planning and Design 30.3, 449-463 (2003)
5. Stamps, A. E.: Creating stimuli with designed amounts of discrete Shannon information entropy. http://researchgate.net (2014)
6. Stamps, A. E.: Commentary on the entropy of LEGO®. Environment and Planning B: Planning and Design 39.1, 183-187 (2012)
Solar Collection Multi-isosurface Method
Computational Design Advanced Method for the Prediction of
Direct Solar Access in Urban Environments
Francesco De Luca* and Hendrik Voll
Tallinn University of Technology, Tallinn, Estonia {francesco.deluca, hendrik.voll}@ttu.ee
Abstract. Direct solar access and daylight requirements contribute significantly when it comes to shaping the layout and appearance of contemporary cities. Ur-ban planning regulations in Estonia set the minimum amount of direct solar ac-cess that existing housing has the right to receive and new premises are required to get when new developments are built. The solar envelope and solar collection methods are used to define the volume and shape of new buildings that allow the due solar rights to the surrounding buildings, in the case of the former, and the portion of the own façades that receive the required direct solar access, in the case of the latter. These methods have been developed over a period of sev-eral decades, and present-day CAAD and environmental analysis software per-mits the generation of solar envelopes and solar collection isosurfaces, although they suffer from limitations. This paper describes an advanced method for gen-erating solar collection isosurfaces and presents evidence that it is significantly more efficient than the existing method for regulation in Estonia’s urban envi-ronments.
Keywords: Urban planning Direct solar access Solar envelope Solar collec-tion Computacollec-tional design Environmental design
![Fig. 4. Experimental design with LEGO bricks [6]](https://thumb-eu.123doks.com/thumbv2/9libnet/4420114.75609/4.701.111.561.357.466/fig-experimental-design-lego-bricks.webp)