INFLATION IS HIGHER FOR THE POOR THAN FOR THE RICH
Seyfettin Gürsel
*and Ayşenur Acar
Executive SummaryInflation calculated by Turkish Statistical Institute (TurkStat) captures inflation faced by a representative household since it covers all income and expenditure groups in Turkey. However, inflation faced by
households of different income and expenditure groups may differ since different groups consume different baskets of goods and services. In this research brief, we calculated different price indices for each income quintile using the consumption data from Household Budget Survey (HBS) released by TurkStat for the period 2003-2012 (May). Findings indicate that poorer households face higher inflation than richer ones in Turkey. The poorest households (the lowest quintile) face higher inflation levels since price increases in food and energy (electricity, gas and other fuels) are above average increase in prices during this period. The inflation difference between the top income quintile and the lowest income quintile from 2003 to 2006 evolved in favor of the poor households. On the other hand, this trend was reversed against the poor households due to global food and energy price shocks since the second quarter of 2007.
Inflation faced by the poor and the rich is different
Divergence in inflation rates may be driven by different consumption patterns or by changes in relative prices. Consumption patterns are clearly related to income levels. However, out of necessity, Turkish Statistical Institute (TurkStat) calculates the inflation faced by a representative household for the calculation of Consumer Price Index. TurkStat uses a basket of goods and services for the representative household and calculates Consumer Price Index (CPI) by weighting products in that basket. Consequently, the index captures the inflation of the representative household. On the other hand, price increases in each good and service change considerably over time depending on its relative demand and its cost. Hence, inflation varies across households by income due to differing consumption baskets of those households.
Starting from mid-2007, energy and food price shocks have changed the relative price structures.1 Inevitably,
there have been repercussions of these shocks on the relative price structure in Turkey. The effects of the changes in relative price structure on the inflation rates faced by the rich and the poor households in Turkey are important both socially and the politically.
Betam has been following inflation rates for different income groups. We published the latest Research Brief on this issue on the 26th of March 2010. In this research brief, we calculate inflation rates by different
quintiles for the period 2003- 2012 (May) focusing on the last two years2.
Inflation is higher for the poor than for the rich
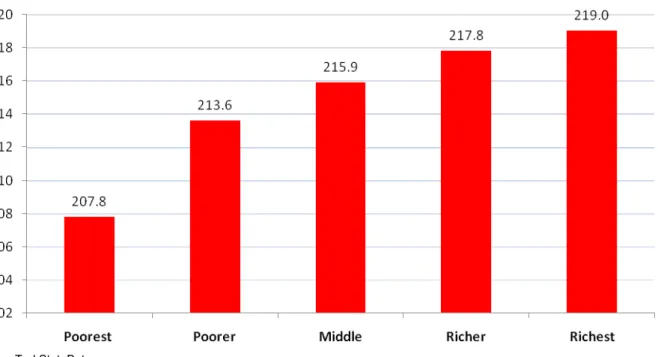
Figure 1 presents inflation indices for each quintile calculated by using the prices indices of each main item category and the weights of these categories in the consumption baskets of different quintiles for May 2012. Findings indicate that price indices increase considerably from the rich to the poor in Turkey. While the
* Prof. Seyfettin Gürsel, Betam, Director, [email protected]
Ayşenur Acar, Betam, Research Assistant [email protected]
1 Box 1 presents detailed information regarding the effects of good and energy price shock on basic consumption products in Turkey. 2Methodology for the calculation of inflation by different expenditure groups is presented in Box 2.
www.betam.bahcesehir.edu.tr
Research Brief 12/134
inflation index for the richest (fifth) 20% is 207.8, the same index is 219 for the poorest (first) 20%. In other words, while average increase in price for the representative household in the richest 20% is 108 percent for nine years, it is 119 percent for the representative household in the poorest 20%.
Figure 1 Inflation by different income groups (2003=100)
Source: TurkStat; Betam
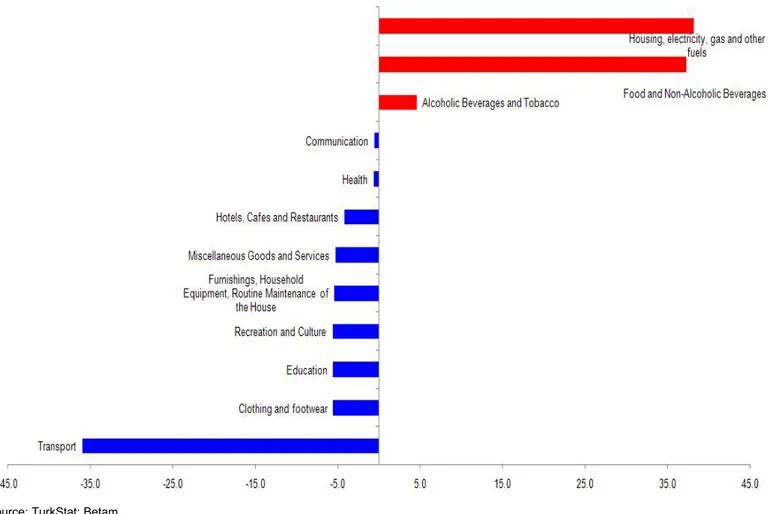
The inflation difference of approximately 11.2 points between the richest and the poorest income quintiles is caused by differences in consumption baskets of the rich and the poor as well differing price increases of these goods and services. While poor households are more likely to spend a much higher proportion of their income on basic needs like food and housing, these items constitute a smaller proportion of household income for the richest households. On the other hand, households in the richest 20% are more likely to spend more on transportation, clothing and footwear, entertainment and culture, education, furniture. Hence, higher inflation of expenditures on basic needs implies larger effects of this price increase on the poor. The rising energy and food prices have hurt the poor
We look at expenditures on 12 basic goods and services items provided by TurkStat in order to understand the causes of the inflation differences between the rich and the poor. One can decompose the inflation difference by using weights of goods and services in consumption bundles and price indices of items. Figure 2 provides the contribution of item category to the total difference of 11.2 points between rich and poor.3 We
observe that the lowest income quintile has suffered from price increases in services like housing, water, electricity and fuel, and food, whereas the top income quintile faced price increases in transport (fuel prices). Housing, water and energy expenditures constitute 36.9 percent of the poor households’ budget and 21 percent of the rich households’. The increase in prices of these items has caused a 38.2 point increase against households in the lowest income quintile. Secondly, while food and non-alcoholic beverages correspond to 32.5 percent of the budget of the poor, it is only 15.8 percent of that of the rich. Thus, higher inflation of these items leads to increase in inflation faced by the lowest income quintile. Higher inflation on housing and food turn against the poor, 38.2 and 37.3 points respectively.4 On the other hand, transport is
also an important component of inflation. It makes up 23.3 percent of the budget of the rich and only 5.5 percent of budget of the poor. Transport had a decreasing effect on the inflation difference between the rich
Figure 2 Decomposition of inflation difference by expenditure groups*
Source: TurkStat; Betam
* While red bars show that contributions of expenditure groups working against the poor in the total inflation difference, blue bars show that expenditure groups working against the rich.
Inflation has been working against the poor since 2007
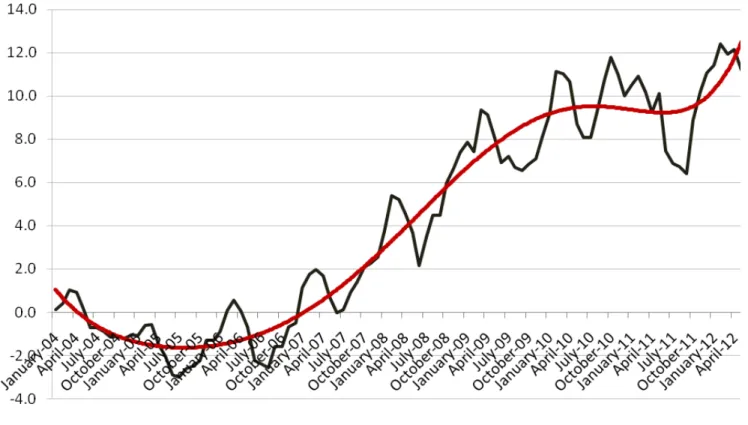
As discussed above, while inflation faced by the poor is more likely to rise with price increases in basic needs (food, housing, energy), inflation faced by the rich is more likely to rise with luxury consumption items (transport, clothing and foot wear, education). One cannot ignore the detrimental effect of the global price increases in food and energy beginning in the second quarter of 2007, on the inflation difference between the rich and the poor. The time trend of this inflation difference between the rich and the poor justify this intuition. Figure 3 present the change of the inflation difference over time. As seen, inflation difference between the rich and the poor stays relatively small from 2003 to 2006 and is in favor of the lowest income quintile for almost two years. However, the inflation difference has risen consistently since the third quarter of 2005 and it has been against the poor. Increase in inflation difference remained stagnant and may be even decreased during the crisis in 2009 due to declining food and energy prices. However, the inflation difference has started to increase again due to price increases in food and especially energy. In May 2012, the inflation difference between the rich and the poor reached 11.2 points.
Figure 3 Inflation difference between the rich and the poor
Box 1 The evolution of food and energy prices
www.betam.bahcesehir.edu.tr
Since the second quarter of 2007, relative price differences have been increasing rapidly due to food and energy price shocks at the global level.
Choosing 2007 as a base year, we follow the CPI and the price indices of basic needs to shed light on the effects of relative price increases on the divergence of inflation rates between the rich and the poor. As can be seen in Figure 4, price increases in energy (electricity, gas and other fuels) and in food are above average inflation.
Price indexes pertaining to CPI and subgroups of basic need expenditure (2007=100, 3 month moving average)
Box 2 Methodology for the Calculation of Price Index
We follow TurkStat’s methodology in calculating the price indices for different expenditure groups. Choosing 2003 as a base year and weighting indices of sub-groups by expenditure quintiles, we find a price index for each group. We use weights of
expenditure groups released by TurkStat for years between 2003 and 2010. Weights pertaining to 2010 are used for the last 17 months since weights of 2011 have not been released yet. Note that using weights pertaining to 2010 lead to only marginal bias since the items of bundles barely change over time.
Laspeyres formula used for calculating the price index is presented below:
I
t/ I
December(t-1)=
12 1 iI
it/ I
i December (t-1)x w
itI
t: Index at time tI
December (t-1):
Index at previous DecemberI
it:
Indices for each item. For example i=01, denotes index pertaining to food and non-alcoholic beveragesw
it:
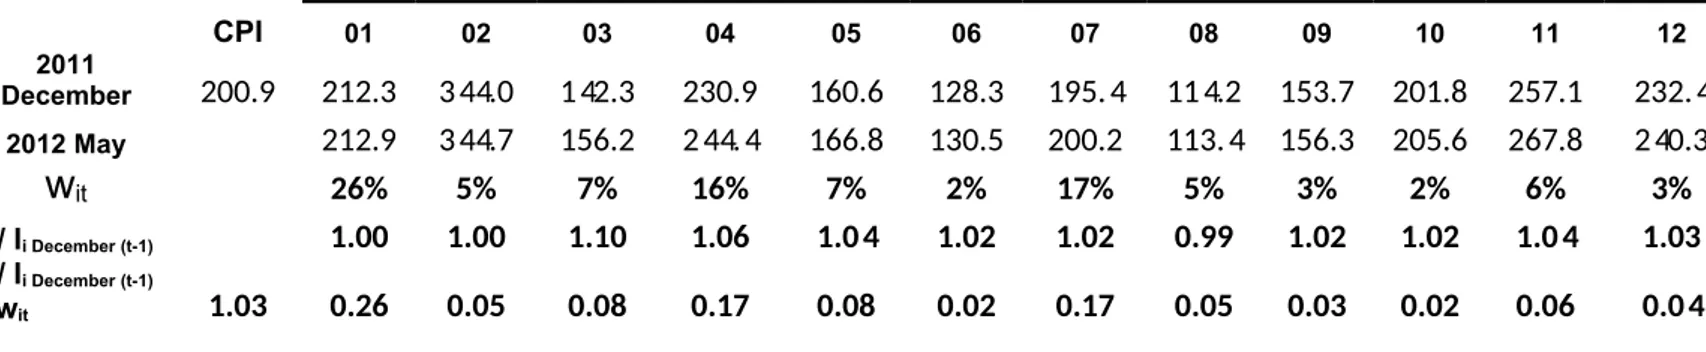
WeightsTable below presents general index released by TurkStat, indices of sub-groups and weights used for computation CPI. For instance, using CPI 2011, the computation of CPI for May 2012 is as follows:
CPI 01 02 03 04 05 06 07 08 09 10 11 12 2011 December 200.9 212.3 344.0 142.3 230.9 160.6 128.3 195.4 114.2 153.7 201.8 257.1 232.4 2012 May 212.9 344.7 156.2 244.4 166.8 130.5 200.2 113.4 156.3 205.6 267.8 240.3
w
it 26% 5% 7% 16% 7% 2% 17% 5% 3% 2% 6% 3% Iit / Ii December (t-1) 1.00 1.00 1.10 1.06 1.04 1.02 1.02 0.99 1.02 1.02 1.04 1.03 Iit / Ii December (t-1) x wit 1.03 0.26 0.05 0.08 0.17 0.08 0.02 0.17 0.05 0.03 0.02 0.06 0.04We multiply the sum of the rates (
E
i Aralık (t-1)x w
it)
with CPI pertaining to December to obtain CPI pertaining to May 2012.CPI (May 2012) =
12 1 iI
it/ I
i December (t-1)x w
it(1.03) x
I
December (t-1)(200.9) =
206.6
Box 3 Decomposition of Inflation difference between the rich and the poor
www.betam.bahcesehir.edu.tr
We only need the contributions of 12 items to general index in order to understand inflation difference between the rich and poor. Table below shows how we calculate the contributions to inflation difference presented in Figure 2.
Contributions to the inflation faced by the poor Contributions to the inflation faced by the rich Contributions to the inflation difference (1) – (2)
(01) Food and Non-Alcoholic Beverages 69.3 32.0 37.3
(02) Alcoholic Beverages and Tobacco 11.3 6.7 4.6
(03) Clothing and Footwear 7.3 13.0 -5.6
(04) Housing, electricity, gas and other fuels 82.9 44.7 38.2
(05) Furnishings, Household Equipment, Routine Maintenance of the House 9.5 14.9 -5.4
(06) Health 4.2 4.8 -0.6
(07) Transport 12.0 47.9 -36.0
(08) Communication 7.1 7.7 -0.6
(09) Recreation and Culture 2.0 7.6 -5.6
(10) Education 1.0 6.5 -5.6
(11) Hotels, Cafes and Restaurants 7.9 12.1 -4.2
(12)Miscellaneous Goods and Services 4.6 9.9 -5.3
Total 219.0 207.8 11.2