TARIM BILIMLERI DERGISI 2003, 9 (4) 486-490
Determination of Variation in Soil Water Storage Capacity on
Watersheds
Kadri YÜREKLI' Fazlı OZTÜRK2 Mehmet BALÇIN 3 Geliş Tarihi: 10.05.2002
Abstract: The purpose of this study is to bring up variation of soil water storage capacity (S) based on probability distributions on watersheds, and to compare S obtained from probability distribution to S according to Soil Conservation Service (SCS). In order to explaining variation in S, maximum 24-h rainfall for each month ana the associated runoff volume recorded in three watersheds ( Uğrak, Akdoğan, İkikara) which has controlled by Tokat Research Institute of Rural Services was used. Normal, log normal, extreme value type I, and log pearson type III distributions were taken into account for S in this study. S values of these mentioned watersheds were fitted better to log normal distribution than the others (normal, extreme value type I, and log pearson type III distributions ). S values of each watersheds for 10, 50 and 90 % probability levels were gotten from frequency lines based on log normal distribution. Afterwards, for these S values, curve numbers (CN 10 , CN 50 , CN90) were determined. These CN values were compared to CN values (CN I , CN,,, CN,,,) based on SCS for dry antecedent condition, normal antecedent condition, and wet antecedent condition. This study was showed that GN I° , CN 50 , CN90 were similar to CN,, CN„, CN,,, for each watershed (Ugrak, Akdogan, Ikikara).
Key words : maximum 24-h rainfall, SCS, curve number, soil water storage capacity
Su Toplama Havzalar
ı
nda Su Tutma Potansiyelindeki De
ğ
i
ş
imin Belirlenmesi
Özet: Bu çalışmanın amacı, olasılık dağılımlarına göre havzadaki su tutma potansiyelindeki (S) değişimi ortaya çıkarmak ve olasılık dağılımlarından elde edilen S ile Soil Conservation Service (SCS)'in geliştirdiği yönteme göre elde edilen S'nin karşılaştırmasını yapmaktır. S'deki değişimi belirlemek amacıyla, Tokat Araştırma Enstitüsü tarafından kontrol edilen havzalarda (Uğrak, Akdoğan, İkikara), her ay için ölçülen maksimum 24-h yağmurlar ile bu yağmurların neden olduğu yüzey akışlar kullanılmıştır. Bu çalışmada, S için normal, log normal, gumbel ve log Pearson III dağılımları göz önüne alınmıştır. Yukarıda adı geçen havzaların S değerleri, log normal dağılıma, diğer dağılımlardan (normal, gumbel ve log Pearson III ) daha iyi uyum göstermiştir. Her havza için % 10, % 50 ve % 90 olasılık seviyeleri için S değerleri, log normal dağılıma göre elde edilen frekans grafiklerinden saptanmıştır. Daha sonra bu S değerleri için, yüzey akış eğri numaraları (GN I° , CN 50 , CN90) belirlenmiştir. Bu CN değerleri, SCS yöntemine göre havzanın kuru, orta ve ıslak koşulları için elde edilen CN değerleri (CN,, CN,,, CN,,, ) ile karşılaştırılmıştır. Bu çalışma göstermiştir ki, her havza için (Uğrak, Akdoğan, İkikara ),Cİ‘1 10 , CN 50 , CN90 yüzey akış eğri numaraları, SCS yöntemine göre elde edilen CN,, CN„, CN,,, yüzey akış eğri numaralarına benzer olmuştur.
Anahtar Kelimeler: maksimum 24-h yağmur, SCS, yüzey akış eğri numarası, su tutma potansiyeli
Introduction
The highest runoff volume occurred on watersheds is directly recorded or predicted by empirical equations. The highest runoff volumes vary with characteristics of watershed and stream systems. But, authors report that soil water storage capacity (S) before rainfall on a watershed makes the greatest effect on runoff. Therefore, when other conditions of a watershed are constant, runoff volumes of that watershed vary little or more related to soil water storage capacity before rainfall.
An empirical equation for obtaining runoff volumes is developed by SCS (Anonymous 1972). Runoff volumes based on this equation are predicted for rainfall and
S. Success in prediction of runoff volumes is dependent on true of S so that uncertain parameter in SCS technique is S. S is obtained based on land use, plant cover and soil texture of a watershed (Anonymous 1972). In general, it is diffıcult to estimate S. Haan and Schulze (1987) suggested use of probability distributions in order to explain variation of S better.
The main purpose of this study was to bring up variation of soil water storage capacity (S) based on probability distribution on watersheds. In addition, the method used in this study was compared to SCS technique.
Gaziosmanpasa University, Faculty of Agriculture, Department of Farm Structure and Irrigation-Tokat 2 Ankara University, Faculty of Agriculture, Department of Farm Structure and Irrigation-Ankara 3 Tokat Research Institute of Rural Services-Tokat
Material and Methods
The data that was used in this study consists of maximum 24-h rainfall and the associated runoff volumes that recorded on three watersheds, namely Uğrak, Akdoğan and İkikara that have been monitored by Tokat Research Institute of Rural Services. In general, the soils of these watersheds have clay and clay loam textures. Some properties of these watersheds are giyen in Table 1 (Anonymous 1992).
In order to determine variation in soil water storage capacity (S), maximum 24-h rainfall for each month was taken from 24-h rainfall that were recorded on the watersheds studied (Okman 1975). Then, to be reflected better variation in S and to lover relative error of confidence interval, maximum 24-h rainfall selected for each month and associated runoff were consecutively joined together (Julian 1967). Thus, set of rainfall and runoff were constituted. Haan and Schulze (1987) used set of the annual maximum 24-h rainfall-runoff in their study.
Homogeneity test to set of rainfall-runoff of each watershed was made based on Diler (1982). Therefore, set of rainfall-runoff for watersheds was divided into equal two portions. Then, these sets were arranged in a row from the smallest to the largest value and the rank of each observation was determined. The frequency of each value was obtained by dividing rank of each observation into the number of observations. The frequency graphs were drawn by plotting observations versus frequencies. Homogeneity tests of rainfall and runoff for 5 % confidence level were made according to the following equations.
N1/2 . (K *I) / (K4.1) .1/2 (1)
z d*N1/2 (2)
P = 1.00 - L(Z) (3)
Where, K and I, the number of observations of set of rainfall-runoff divided into equal two portions; N, coefficient; d, maximum frequency difference determined frequency graphs of sets established for rainfall and runoff; Z, coefficient; L(Z), Kolmogorov distribution function value taken from the table giyen in Diler (1982). P, probability.
S was determined by the following equations using set of rainfall-runoff for watersheds (Anonymous 1972).
Q = (R - 0.2S) 2 / (R + 0.8S) R > 0.2S (4) S = (25400 / CN) — 254 (5) Equation 4 can be rearranged to give (Haan and Edwards 1988).
S = 5R + 10Q - 10(Q 2 + 1.25RQ) 1 /2 (6) Where, Q, runoff volume (mm); R, rainfall (mm); S, soil water storage capacity (mm); CN, runoff curve number.
S for each rainfall-runoff was obtained from Equation 6. And then, normal, log normal, extreme value type I and log pearson type III distribution were used to determine the best probability distribution fitted to these S values. Haan (1977) and Bayazıt (1981) suggested that graphical, chi-square and Kolmogorov-Simirnov methods are commonly used to obtain the best probability distribution in hydrological studies. In this study, graphical method was chosen to determine the best probability distribution for S values. The explanation of this method is giyen below.
In graphical method, frequency lines for the probability distributions can be calculated by using the following equation (Chow et al. 1988).
X = YA + leSSD (7)
Where, X, S value for taking into account probability level; YA, average of S; K, frequency factor; SsD, standard deviation of S.
Frequency factors of 1.053, 2, 5 and 100 return periods in years were taken from the tables giyen in Bayazıt (1981). Consequently, S values were calculated by Equation 7 based on normal, log normal, extreme value type I and log pearson type III distributions for the mentioned return periods. Goodness of fıt of the probability distributions used for S was tested according to Okman (1994). According to this reference, S values calculated by using Equation 7 for the probability distributions used in this study versus 1.053, 2, 5 and 100 return periods in years were plotted on probability papers of normal, log normal, extreme value type I and log pearson type III distributions. If these points made up a line on the probability paper of which distribution, it was assumed that the distribution was suitable for S.
Table 1. Some properties of the watersheds used in the study Watersheds Area (km2 ) Land Use (%) Years of record Cultivated
land Pasture Forest Shrubbery
Uğrak 7.0 74.7 15.8 6.3 3.2 21
Akdoğan 7.4 68.0 20.0 12.0 - 14
488 TARIM BILIMLERI DERGISI Cilt 9, Sayı 4
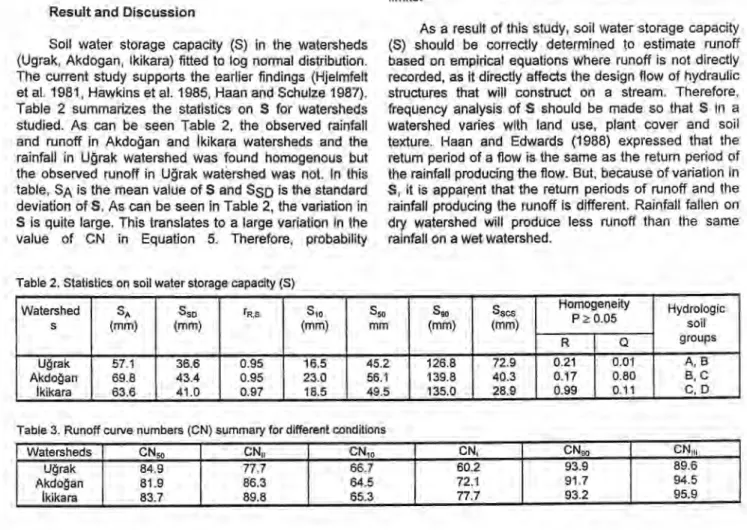
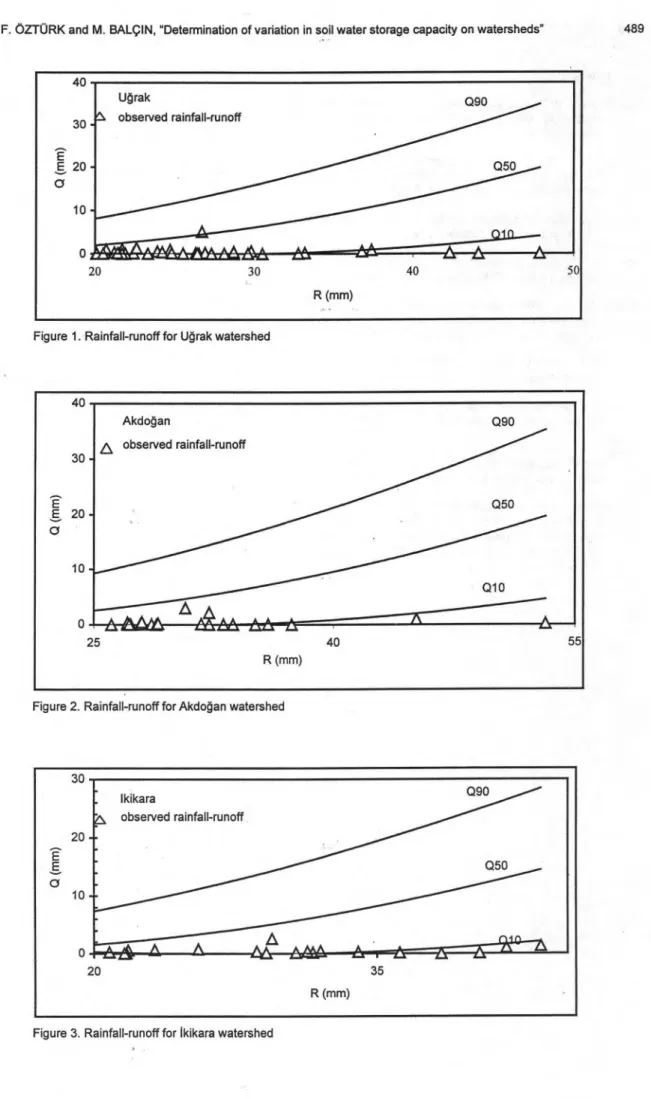
Frequency lines were drawn according to distribution fitted to S for the watersheds. S values (S10, S50, S90) were obtained from these frequency lines for 10, 50, 90 % probability levels. CN10, CN50 and CN90 curve numbers for these S values were calculated by using Equation 5. Rainfall-runoff curves (Q10, Q50, Q90) for CN10, CN50 and CN90 were made up based on Equation 4 by using observed rainfall. Haan and Schulze (1987) expressed that 80 % of observed runoff were located between Q10 and Q90 curves and thus, that confidence interval was 80 %.
S values for SCS were calculated by Equation 5 based on dry antecedent condition (AMCI), normal antecedent condition (AMCA) and wet antecedent condition (AMCHİ). To obtain runoff based on SCS, hydrologic soil groups were determined according to Ward and Elliot (1995). CN values for AMCI, AMCA and AMCH1 were estimated based on land use and hydrologic soil groups as tabulated in Tülücü (1990).
Hawkins et al. (1985) and Haan and Schulze (1987) found that, for the watersheds they studied, the 10 % and 90 % values of S were closely related to the wet antecedent condition (AMCw) and dry antecedent condition (AMCI), respectively, as defined by the Soil Conservation Service. This apparent relationship has also been discussed by Hjelmfelt et al. (1981).
Result and Discussion
Soil water storage capacity (S) in the watersheds (Ugrak, Akdogan, lkikara) fitted to log normal distribution. The current study supports the earlier findings (Hjelmfelt et al. 1981, Hawkins et al. 1985, Haan and Schulze 1987). Table 2 summarizes the statistics on S for watersheds studied. As can be seen Table 2, the observed rainfall and runoff in Akdoğan and İkikara watersheds and the rainfall in Uğrak watershed was found homogenous but the observed runoff in Uğrak watershed was not. In this table, SA is the mean value of S and SsD is the standard deviation of S. As can be seen in Table 2, the variation in S is quite large. This translates to a large variation in the value of CN in Equation 5. Therefore, probability
distributions (normal, log normal, extreme value type I and log pearson type III) were used to explain variation in S. S values for 10, 50 and 90 % probability levels were gotten from the frequency lines of log normal distribution. These
S values are denoted as S10 • S50 and S90 and are shown in Table 2. Finally, as shown in Table 2, the estimated S values based on SCS technique for AMCA is denoted as Sscs• In this table, the homogeneity results of the rainfall and runoff was giyen for 5 % confidence limit.
The correlation between S and the associated maximum 24-h rainfall was found to be very. high (Table 2). Table 3 compares the curve numbers (CN10, CN50, CN90) computed by using S10 , S50 and Sgo to curve numbers (CNI, CNH, CNİH) calculated for the AMCI, AMCA and AMCm based on SCS (Anonymous 1972). Examination of this table reveals that the current study supports the earlier findings (Hawkins et al. 1985, Haan and Schulze 1987).
Figure 1 through 3 show the rainfall-runoff data for the watersheds studied. Superimposed on this data are lines labeled Q90, Q50 and Q10 which were calculated from Equation 4 using values of S equal to S10, S50 and S90, respectively. Haan and Schulze (1987) expressed that 80 % of the runoff events from the rainfall fallen on a watershed will lie between the lines labeled Q10 and 090. That is, two lines can be thought of as 80 % confidence limits.
As a result of this study, soil water storage capacity (S) should be correctly determined to estimate runoff based on empirical equations where runoff is not directly recorded, as it directly affects the design flow of hydraulic structures that will construct on a stream. Therefore, frequency analysis of S should be made so that S in a watershed varies with land use, plant cover and soil texture. Haan and Edwards (1988) expressed that the return period of a flow is the same as the return period of the rainfall producing the flow. But, because of variation in
S, it is apparent that the return periods of runoff and the rainfall producing the runoff is different. Rainfall fallen on dry watershed will produce less runoff than the same rainfall on a wet watershed.
Table 2. Statistics on soil water storage capacity (S) Watershed s SA (mm) SsD (mm) rR,S Sio (mm) Soo mm Sgo (mm) SsCS (mm) Homogeneity P 0.05 Hydrologic soil R Q groups Uğrak 57.1 36.6 0.95 16.5 45.2 126.8 72.9 0.21 0.01 A, B Akdoğan 69.8 43.4 0.95 23.0 56.1 139.8 40.3 0.17 0.80 B, C lkikara 63.6 41.0 0.97 18.5 49.5 135.0 28.9 0.99 0.11 C, D Table 3. Runoff curve numbers (CN) summary for different conditions
Watersheds CN 50 CN„ CN 10 CN I CN 90 CN I ,
Uğrak 84.9 77.7 66.7 60.2 93.9 89.6
Akdoğan 81.9 86.3 64.5 72.1 91.7 94.5
YÜREKLI, K., F. ÖZTÜRK and M. BALÇIN, "Determination of variation in soil water storage capacity on watersheds" 489
Figure 1. Rainfall-runoff for Uğrak watershed
40 30
E
E 20 Cl 10 0 Akdoğan 090 6 observed rainfall-runoff Q50 Q10 25 40 55 R (mm)Figure 2. Rainfall-runoff for Akdoğan watershed
30 20
E
Eo
10 0 Ikikara Q90 observed rainfall-runoff Q50 20 35 R (mm)490 TARIM BILIMLERI DERGISI Cilt 9, Sayı 4
References
Anonymous, 1972. Hydrology. National Engineering Handbook, Section 4, USDA, Soil Conservation Service (SCS), Washington, D. C.
Anonymous, 1992. Tokat Araştırma Enstitüsü Araştırma Raporları. Tarım ve Köy İşleri Bakanlığı Köy Hizmetleri Genel Müdürlüğü, Yayın No: 121, Tokat, 391s.
Bayazıt, M. 1981. Hidrolojide Istatistik Yöntemler. İstanbul Teknik Üniv. Yayın No: 1197, Istanbul, 223s.
Chow, V. T., D. R. Maidment and L. W. Mays, 1988. Applied Hydrology. McGraw-Hill Book Company, New York, 572s. Diler, M. U. 1982 Mühendislik Hidroloji Çalışmalarında
istatistiksel Yöntemler Rehberi. Enerji ve Tabii Kaynaklar Bakanlığı Devlet Su İşleri Genel Müdürlüğü, Bursa, 82s. Haan, C. T. and R. E. Shulze, 1987. Return period flow prediction
with üncertain parameters. ASAE, 30 (3) 665-669. Haan, C. T. and D. R. Edwards, 1988. Joint probability estimates
of return period flows. ASAE, 31 (4) 1115-1119.
Hawkins, R. H., A. T. Hjelmfelt and A. W. Zevenbergen, 1985. Runoff probability, storm depth and curve number. J. of Irrigation and Drainage Engineering, 111 (4) 330-340. Hjelmfelt, A. T., L. A. Kramer and R. E. Burwell, 1981. Curve
Numbers as Random Variables, Rainfall-Runoff Relationships. Proceeding International Symposium on Rainfall-Runoff Modeling, Missisippi State University, Littleton, CO.
Julian, P. R. 1967. Variance spectrum analysis. Water Resources Research, 3 (3) 831-845.
Okman, C. 1975. Çubuk Çayı Havzasında Yüzey Drenaja Neden Olan En Büyük Günlük Yağmur Miktarlarının Tekrarlanma Sürelerinin Saptanması Üzerinde Bir Araştırma. Ankara Üniv. Ziraat Fak. Ankara, 82s.
Okman, C. 1994. Hidroloji. Ankara Üniv. Ziraat Fak. Yayın No: 1388, Ankara, 359s.
Tülücü, K. 1990. Hidroloji. Çukurova Üniv. Ziraat Fak. Yayın No: 50, Adana, 327s.
Ward, A. D. and W. J. Elliot, 1995. Environmental Hydrology. Lewis Publishers CRC Press, New York, 461s.
Iletişim adresi: Kadri YÜREKLI
Gaziosmanpaşa Üniv. Ziraat Fakültesi, Tarımsal Yapılar ve Sulama Bölümü-Tokat Tel: 0 356 252 14 79/2245
Fax: 0 356 252 14 88