THE POSSIBLE IMPACT OF TWITTER
POST MESSAGES ON STOCK MARKET ACTIVITIES
*Dr. Öğr. Üyesi Gerçek Özparlak Beykent Üniversitesi Meslek Yüksekokulu ORCID: 0000-0002-8503-3199
● ● ● Abstract
The purpose of this research is to contribute to the academic field by demonstrating the relationship between stock related Twitter messages, their frequencies, sentiment analysis; stock return, volume, and volatility of Dow Jones Index and BIST30 & BIST100 Index. In this study, The Multinomial Naive Bayes Text Classifier is used as methodology since it is the most conventional method for text classification based on previous research. Using computational linguistics methods, 138.070 English and 34.632 Turkish tweets have been analyzed on a daily basis for a period of 8 months. The results demonstrated a strong relationship between tweets and their impact on the market. Moreover, according to results, there is a positive correlation between the number of retweets and BIST Volume lag-1 and lag+1. In addition, this article confirms that stock microblogs contain valuable information for investors and it can be an assistance in predicting the future market index.
Keywords: Twitter Investor sentiment analysis, Text classification Computational linguistics, Stock market prediction
Twitter Mesajlarının Borsalar Üzerindeki Olası Etkisi
Öz
Bu araştırmanın amacı, akademik literatüre Dow Jones ve BIST30 & BIST100 endeksleriyle ilgili Twitter mesajlarının duygusal analizleriyle ve sıklıklarıyla; hisse senedi endekslerinin getirisi, hacmi ve oynaklığı arasındaki ilişkiyi göstererek katkıda bulunmaktır. Bu çalışmada, literatürdeki önceki çalışmalar dikkate alınarak, metodolojik yöntem olarak en geleneksel yöntemlerden biri olması nedeniyle, Multinomial Naive Bayes Metin Sınıflandırıcısı yöntemi kullanılmıştır. Bilgisayarlı dilbilim yöntemleri kullanılarak 138.070 adet İngilizce ve 34.632 adet Türkçe Tweet 8 ay boyunca günlük olarak analiz edilmiştir. Sonuçlar, Tweeter özellikleri ile piyasa özellikleri arasında güçlü bir ilişki olduğunu göstermiştir. Ayrıca, Retweet sayısı ile Borsa Istanbul’ un bir gün önceki ve bir gün sonraki işlem hacmi arasında pozitif korelasyon ilişkisi olduğu kanıtlanmıştır. Ek olarak, bu makale hisse senedi mikrobloglarının yatırımcılar için değerli bilgiler içerdiğini ve piyasa endekslerinin tahmin edilmesine yardımcı olabileceğini doğrulamaktadır.
Anahtar Sözcükler: Twitter, Yatırımcı duygu analizi, Metin sınıflandırma, Dil bilimi, Borsa tahminleri
* Makale geliş tarihi: 15.04.2019 Makale kabul tarihi: 02.07.2019
Erken görünüm tarihi: 10.07.2019 Cilt 75, No.1, 2020, s. 335 – 354
The Possible Impact of Twitter
Post Messages on Stock Market Activities
1
Introduction
Behavioural finance has become very popular, nowadays. The reason for this is that the classic finance models have to be based on some certain financial assumptions to be an acceptable theory. However, investors do not act according to traditional financial assumptions in reality. Behavioural finance, essentially, is to explain the psychological state of investors during a financial decision-making period without any financial assumption obligation and it tests hypothesises according to the psychological state of investors, too.
Naturally, not only investors’ psychological states but also the financial information has an effect on financial decisions. In this way, there are some current sources of financial information for investors like informants of public institutions, mainstream news, illegal information, a testimony of observers, rumours, newswire, and social media, which usually arrive asynchronously in an unstructured textual form. But it requires an analysis process for clear and objective information for investors.
Sentiment analysis is a process of providing information from an unstructured textual form. It has become an important area for academics, especially with the widespread use of social networks and smartphones. Microblogs are one of the best places to test sentiment analysis due to the fact that data is easy to access and it has a rich database. Particularly, microblogging messages are notably used for marketing researches, social studies and investment analyses in order to understand public opinion about a specific topic as well. In this way, it has been easy to reach the microblogging on every platform within seconds by expanding the use of smartphones and mobile devices. Using microblogging, people can reach valuable information sources from different people located in different places about various topics. People share their thoughts and current experiences simultaneously while international or national events happen. From this perspective, they sometimes behave as news reporters
1 This article was based on the Ph.D. dissertation titled "Is It Possible That Twitter
Messages Have an Influence on The Stock Market When Taking Actions?" presented
to other microblogging users. In addition, they provide related information to users much faster than news on TV or radio.
More than half of the population in Turkey is online, most of the young people are addicted to digital technologies. According to the Digital News Report’s 2015 study, 88 percent of Turkish people preferred to use the online news based on a one-week analysis (Dogramaci et al., 2015).
At the same time, machine-learning algorithms have recently begun to be used by professional investors in order to provide the sentiment analysis in microblogging.
To demonstrate stock-related sentiment analysis microblogging, this article examines whether Twitter messages affect the stock market when trading. It additionally analyses linguistic analysis and opinion extractions on stock-related Twitter messages. For this purpose, the dataset was collected from Twitter messages using Twitter API2.
The contribution of this study has three parts.
Firstly, the relationship between stock-related Twitter messages and the Dow Jones Index was investigated. Then, the relationship between DJI’s stock return, volume, volatility and micro blogging’s sentiment analysis and frequencies were analyzed.
Secondly, the relationship between stock related Twitter posts and BIST 30 and BIST 100 Indexes was investigated. Accordingly, an explanation of the relationship between BIST's stock return, volume, volatility and micro blogging’s sentiment analysis and frequencies was offered.
Finally, it examines whether the stock exchange market can be predicted by Twitter sentiment analysis or not.
1. Literature Review
Many articles have been written on linguistics and sentiment analysis for newspaper texts, financial data service text applications and microblogging web text messages in the literature. For instance, (Antweiler et al., 2004: 1259-1294) published an article in The Journal of Finance in 2004. In the study, they investigated 1,5 million messages posted on the Yahoo Finance web site associated with 45 firms in the American Stock Exchange. According to Antweiler and Frank’s perspective, stock-related messages can be a beneficial tool to predict the volatility of the stock market statistically. Likewise, (Tetlock, 2007: 1139) handled the Wall Street Journal to investigate the effect of media on the stock exchange. He designed a Pessimism Media Factor model to forecast the
price, volume and performance of DJIA stocks. The author concluded that negative news of the media has an effect on returns, but this effect lasts only temporarily. Moreover, a stock volume is predictable when this negative effect is outstandingly large or short. One year after this definition, (Tetlock et al., 2008: 1437) made another linguistic analysis to foresee accounting revenue and stock gain of individual companies. He focused on stories about S&P 500 companies in The Wall Street Journal and Dow Jones News Service for 24 years’ period. The author applied ordinary least squares (OLS) regressions for prediction. He found three assumptions. First, negative words about a company indicated low company earnings. Second, companies’ stock return is unpredictably affected by the negative words in the information. And third, negative words in stories are principally beneficial forecasters both for the accounting earnings and stock returns (Tetlock et al., 2008: 1437). (Fang et al., 2009:2023) analyzed the relationship between mass media and projected the stock return. They concluded, for small scale companies, a stock with no media coverage has better returns than a stock with media coverage. Furthermore, they state that stock returns are affected by the width of information spreading.
Scholars began to describe sentiment in Twitter messages because Twitter is one of the leading social media services in the world and it has 330 million monthly active users (Twitter, 2017). It was easy to collect comprehensive datasets, increase the population of Twitter and provide an efficient study field for the researcher. Therefore, (Giller, 2009: 2-6) inspected a small dataset for an experiment in Twitter usage to publicize a record of directional intraday index futures trades. He concluded that a number of Twitter followers are affected by the performance of each day’s trading simultaneously. Additionally, the author applied the maximum likelihood ratio test and h revealed a positive correlation in success metrics, an indicator variable for directional forecasts and the number of Twitter followers. In parallel with this study, (Go et al., 2009) designed an algorithm that can properly classify Twitter messages as positive or negative with respect to a query term. The research results reported a high accuracy on classifying sentiment in Twitter messages utilizing machine-learning methods.
(Bollen et al., 2009:311) implemented a sentiment mining for Twitter post messages. They used a psychometric test to ensure six mood states (tension, depression, anger, vigor, fatigue, confusion). The Twitter post messages were associated with six-dimensional mood vectors on a daily basis (Bollen et al., 2009: 311). Then, they analyzed specific emotions in posts related to economical, political, cultural, social and other major events using six-dimensional Profiles of Mood States (PMOS). They found that events in analyses of public mood can provide information in detecting the emotional trend of society. Furthermore, this trend can help ensure indicators to predict economic events.
(Bollen, 2011:91) collected tweet messages related to DJIA over time. They designed a measurement system to extract mood states similar to their previous study in 2009. However, this time they changed the type of six moods, and they determined six different dimensions3 in order to predict the mood of the public. Their results proved that the use of public mood dimensions can improve predicting DJIA significantly. Moreover, they state that they realized a precision of 87,6 percent in predicting the daily fluctuations for Dow Jones Index closing-values. In addition, the authors succeeded to decrease the Mean Average Percentage Error more than 6 percent during the prediction. In another linguistics analysis in the literature, (Sprenger, 2010;1) examined approximately 250.000 twitter messages related to S&P 100 companies on a daily basis using methods computational linguistics and “Naïve Bayesian Classification”. The authors expressed that message volume with abnormal stock return includes corresponding information to forecast the following day trading volume.
Following the existing theory, (Zhang et al., 2011:55-62) aimed at analysing Twitter posts in order to predict stock market indicators in U.S. Financial stock market index. They gathered Tweets for six months. Concurrently, they calculated collective hope and fear daily and they observed a relationship with stock market indicators. They expressed a negative correlation between tweet sentiment analysis and Dow Jones, S&P 500 and NASDAQ indexes. As well as, the authors demonstrated a positive significant correlation in the Chicago Board Options Exchange Volatility Index. Moreover, they displayed that if emotions on the Twitter increase, people express hope, fear and worry. Then, the Dow Jones Index decreases in the next day. In contrast, if emotions on the Twitter decrease, people have less hope, fear, and worry, then, the Dow Jones Index increases the next day. Therefore, tracking of twitter opinion extraction is a useful predictor to predict next day’s stock market (Zhang et al. 2011: 55-62). (Rao et al., 2012:1-5) investigated the relationship between Twitter messages about 13 technology companies and stock prices, volume and volatility of DJI as well as NASDAQ-100 Index. They found an 88 percent correlation between Twitter sentiment analysis and stock movements. The authors defined an equation to predict stock returns with a high value of R-square (%95,2). (Sprenger et al., 2014:791:830) demonstrated a methodology to determine news events based on social media. They implemented a computational linguistics method on more than 400,000 stock related Twitter messages about the S&P 500. They separated good and bad news. They concluded that the returns before good news events are clearer than the returns before bad news events. They demonstrated that the effects of news events on the stock market are different in various categories. (Ranco et al., 2015:1-22)
collected Twitter messages for 15 months to demonstrate the relationship between Twitter sentiment analysis, Twitter volume and abnormal returns of 30 companies of DJIA index. They found a significant correlation between abnormal returns and Twitter sentiment analysis when Twitter volume reached to peak levels. Furthermore, the authors demonstrated that Twitter volume at the peak levels can forecast the direction of stock returns. (Souza et al., 2015:1-23) researched 10.949 news stories from DJI Newswires and Barron’s Magazine to the Wall Street Journal, nearly 42,8 million Twitter messages and stock of 5 retail brands in US Stock Exchange. They observed a relationship among stock returns, volatility and Twitter sentiment. They presented that social media is an efficient and more available source of analysis for market financial dynamics than the sentiment analysis of Dow Jones Newswires and Wall Street Journal. (Pagula et al., 2016:1343-1350) collected 250.000 Tweet messages in order to make a sentiment analysis for about a one-year period. In this way, they tested a correlation between Microsoft’s stock price and tweets related to their work. In conclusion, they provided significant and strong correlation of 71,82 percentage between the sentiment mining and the fluctuations of the stock price. (Kordonis et al., 2016:1-6) collected Twitter data and they applied Naive Bayes Bernoulli and Support Vector Machine to analyze the sentiment of Twitter. As a result, they found a correlation between sentiment analysis of Twitter and stock price.
2. Data and Methodology
2.1. Data
This article mainly compares sentiment analysis of stock related Tweet messages with the real market like as return, volume, and volatility of the stock exchange. Therefore, the data set of this article is two-sided. One part is obtained by quantification of microblogging messages data via sentiment analyse. On the other side, there is a stock exchange data.
Stock related twitter post messages are chosen to perform sentiment analysis for this study as Twitter is widely accepted by researchers to examine the sentiment analysis about the financial market on social media. Twitter also allows users to collect all recorded messages via Twitter API4.
For data set, the tweets posted from February 13rd to October 18th in 2017 have been recorded for a period of 8 months via a computer. In total, 138.070 English tweets related to the Dow Jones Index have been recorded on a daily post. In parallel, 34.632 Turkish tweets related to the Istanbul Stock Exchange Index have also been recorded.
4 Application Programming Interfaces
The key words were written to the query of Twitter API in order to display the stock related messages. The key words consist of the those as “BIST 30”, “BIST 100", “XU100”, and “DOW JONES”.
The second part of the article's data consists of stock exchange data. DJI index, BIST 30 & 100 indexes were referenced as the stock exchange data. The DJIA daily closing-values were downloaded from Yahoo Finance. BIST daily closing values were downloaded from Matriks Data. Thus, the return of the stock, the volume of the stock and the volatility of the stock were calculated on a daily basis. Some data descriptions are useful for readers to understand the article easily.
Stock Return shows the daily return of the index.
Stock Volume shows the daily trading volume of the stock market. Stock Volatility shows the volatility measured on the standard
deviation of the stock index return.
Tweet Volume shows the total number of Tweets sent by users. Positive Tweet Volume shows the total number of positive tweets sent
by users.
Negative Tweet Volume shows the total number of negative tweets sent by users.
Retweet means a simply repost or forward of a message on Twitter to another user.
2.2. Methodology
Tokenization is the process of breaking up a sequence of strings into pieces such as words, phrases, symbols and other elements called tokens. Tokens can be individual words, phrases or sentences. In the process of tokenization, some characters like punctuation marks are discarded. The tokens become the data for another process like text mining. An example of the tokenization process:
1. Input data: “Would you like to go with me?” 1. Output data: “you”, ”want”, ”go”, ”me”
Lemmatization usually refers to doing things properly with the use of vocabulary and morphological analysis of words, normally aiming to remove inflectional endings only and to return the base or dictionary form of a word, which is known as the lemma. An example of Lemmatization;
2. Input data: am, are, is 2. Output data: be
3. Input data: car, cars, car's, cars' 3. Output data: car
English is the most suited language for tokenization and lemmatization to apply sentiment analysis. Because words and sentences in English can be easily classified using the Tree Tagger method (Schmid, 1994: 1-9) due to the easy etymology of English.
(Sahin et al., 2013:1-8) described Turkish as an agglutinative language with many exceptions to phonetic and morphological rules. Suffixes are located at the end of the words and suffixes are very effective in Turkish. Suffixes can change the type and the meaning of the word, even a letter. In addition, the number of words and suffixes are so many. It is almost impossible to do a standard Turkish bag word list.
Due to these difficulties, researchers have been inefficient in the field of Turkish Language etymology. Therefore, it is quite difficult to apply tokenization and lemmatization to Turkish Language in order to achieve a sentiment analysis. But some original methods for this study have been developed and the process has ended up with success (See the Appendix F for more details). First of all, Turkish letters have been converted to Latin letters. For instance;
4. Input data: “ç”,”ğ”,”ş” 4. Output data: “c”,”g”,”s”
Secondly, Turkish words with similar meanings are combined. For example;
5. Input data: “increase”,”raise”,”rise”
5. Output data: “increase”, “increase”, “increase”
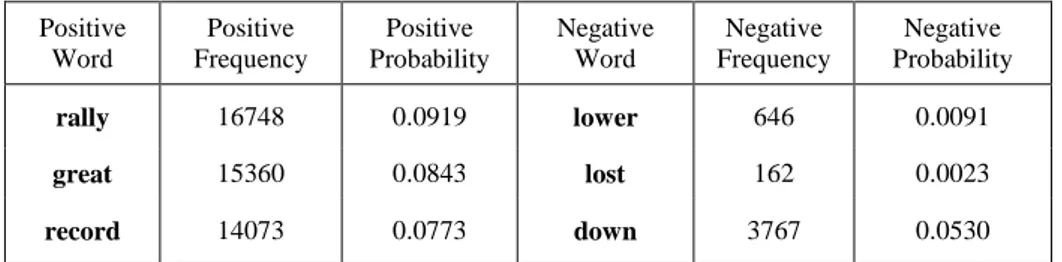
After the tokenization and lemmatization step, English and Turkish Bags of Words (BOW) were composed. BOW is commonly used in methods of text classification and it is determined according to the frequency of each word written in the text. A bags of words used in a similar study in the literature has been used for English Tweets. But such a word list for Turkish is not available. To solve this problem, firstly, the frequency of each word in Turkish Tweets is calculated with Excel software (Appendix F). Secondly, spelling errors or slang words are extracted. For example;
6. Input data: “reduce”,”decreasedddddd”,”ddddiminished” 6. Output data: “decrease”, “decrease”, “decrease”
Table 1: A Sample for Bag of Words
Positive Word Positive Frequency Positive Probability Negative Word Negative Frequency Negative Probability rally 16748 0.0919 lower 646 0.0091 great 15360 0.0843 lost 162 0.0023 record 14073 0.0773 down 3767 0.0530
Thirdly, according to the Turkish dictionary, the words are divided into positive and negative. Fourth, words are ordered from top to bottom according to their frequency. The increase in the frequency of a word also increases the probability of influencing a Tweet sentence. For example;
The word "balloon" began to be used much after the world financial crisis in 2008. Briefly, the excessive use of a word increases the probability of effecting the meaning of the whole Tweet in the sentiment analysis. It may affect the probability of the sentence as being positive or negative.
In this sense, the Excel software created for this article is an example of artificial intelligence because the software has the ability that automatically can update the decision mechanisms according to the new tweets entered.
After the BOW was prepared, the probabilities of each word listed in BOW were calculated for each Tweet on daily basis.
Table 2: The Summary of Result of Correlation Analysis Created at Time Twitter Text Message
Positive Words Frequency Negative Words Frequency Positive Probability Negative Probability 10.10.2017 16:26 RT @IvankaTrump:
.@realDonaldTrump stock market rally is close to becoming the greatest in 85 years https://t.co/5WlZa82Mij
2 0 0.0919
27.02.2017 11:34
Dow futures rise 20 points; stocks set to continue their record run
https://t.co/QBGuoRD54f
2 0 0.0053
06.03.2017 21:27
REPORT: Down day in the States. At the close of trade, the Dow Jones index was lower by 51points
https://t.co/hrD8s62uYC
11.10.2017 05:00
Fake headlines like “Google to buy
Apple for $9 billion” caused a slight
bump in Apple’s stock price
https://t.co/DxziuoumnK
2 1 0.0101 0.0013
11.10.2017 10:50
The Bursa Malaysia is not going up. The Dow Jones is at an all time high. Lost another RM 2100 when FGV warrants expired. No hope here!
2 1 0.0616 0.0023
16.10.2017 20:19
Woo hoo! Let the good times roll for hard working Americans. To all the financial pessimists...what gives? Fear... https://t.co/PK2rovp78i
1 1 0.0123 0.0033
Finally, the probabilities of all the positive and negative Tweets sent on the same day were collected and combined in a single day. According to The Multinomial Naive Bayes technique, the sentiment analysis of the Tweets of that day was determined to either be positive or negative.
The Multinomial Naive Bayes5 technique was utilized in order to form a dataset of two sentiment classifications: positive and negative. The Naïve Bayesian classification method was used, because it is one of the most conventional methods for text classification in the literature. The Naive Bayesian classifier is based on Bayes' theorem and it uses conditional probability. Conditional probability is the probability of an event given that another event has occurred. In this way, the probability of a message can be estimated using its previous information in a class. The highest probability class is accepted as the most probable class. This method is relatively simpler and it has constantly given reliable results.
Naive Bayes classifier is based on Bayes’ theorem (Kibriya et al., 2004: 488).
𝑃(𝐴/𝐵) =𝑃(𝐵 𝐴⁄ ).𝑃(𝐴)𝑃(𝐵) , (1) in this case, the probability can be calculated as:
𝑃(𝑆 𝑀)⁄ =𝑃(𝑀 𝑆).𝑃(𝑆)𝑃(𝑀)⁄ , (2) where S is a sentiment, M is a Twitter message.
The conditional probability of an event M is the probability that the event will occur given the knowledge that an event S has already occurred.
𝑃(𝑆 𝑀⁄ ) =𝑃(𝑆∩𝑀)
𝑃(𝑀) (3)
𝑃(𝑆 ∩ 𝑀) is the probability that both S and M occur; this is the same as calculating P(S), the probability of S occurring multiplied by P(M/S), the probability of M occurring given that S has already occurred, or conversely P(M), the probability of M occurring multiplied by P(S/M), the probability of S occurring given that M has occurred.
𝑃(𝑆 ∩ 𝑀) = 𝑃(𝑆) ∗ 𝑃(𝑀/𝑆) = 𝑃(𝑀) ∗ 𝑃(𝑆/𝑀) (4) But there is a problem, if a Tweet sentence does not contain any words from BOW, it means the probability equals zero and consequently makes P (Twitter Message | Sentiment) zero as well. This means that an impossible event has come to pass and also that the model was an incredibly bad fit. The probability of an event can be low, but it should not be zero. Moreover, all the probabilities were multiplied during inference, even one such zero probability term will lead to the entire process failing.
For example, in a given text data, the following words were observed and counted;
(Banana:3), (Strawberry:3), (Cherry:3)
The probability of seeing the word "Banana" would be assumed as 3/9 ~ 0.33 for the next word. But, what about the word “Lemon”! The probability of ‘Lemon’ occurring is zero, according to the available probability. But in reality, this is never the case. There will always be some probability of “lemon”, or any other word occurring.
In order to tackle this problem, Laplace Smoothing will be employed as a technique for smoothing data. A small-sample correction will be incorporated in every probability estimate. Therefore, probability will not be zero. This is a way of regularizing Naive Bayes and when the pseudo-count is zero.
"1" was added to every probability in the Excel sheet to increase the zero probability values to a small positive number. Therefore, the probability is never zero (Appendix F). Consequently, the division is always greater than one.
𝑃(𝑆 𝑀)⁄ =1+𝑃(𝑀 𝑆).𝑃(𝑆)⁄ 𝑃(𝑀) (5) 𝑃(𝐿𝑒𝑚𝑜𝑛) = 1+0 (9+4)≅ 0,08 (6) 𝑃(𝐵𝑎𝑛𝑎𝑛𝑎) = 𝑃(Strawberry) = 𝑃(Cherry) = 1+3 (9+4)≅ 0,31 (7) The word “Lemon” is now accounted for and the possibilities are more realistic.
In the final part, the results obtained from Bayes calculations, if the sum of positive probabilities is greater than the sum of negative probabilities; the day is called “positive”. It is represented by “1” as the sentiment score. This means that investors can have positive expectations about the stock market for now or for the future. On the other hand, if the sum of negative probabilities is greater than the sum of positive probabilities, the day is called “negative”. It is represented by “0”. This means that investors can have negative expectations about the stock market for now or for the future.
For each stock index, the time series of daily return 𝑅𝑑 is extracted. The expected return is estimated by an OLS regressed market model,
𝑅
𝑑=𝑃𝑑−𝑃𝑑−1
𝑝𝑑−1 ,
(8)
where 𝑃𝑑 is the closing price of the stock at day d.
Volume data were taken from Bloomberg. The volume is commonly reported as the total amount of security that changed hands (bought and sold) during a given day. Volume formula;
𝑉𝑜𝑙𝑢𝑚𝑒 = The Total Amount of a Security X Security Price (9) The volatility of the stock exchange Indexes is calculated daily by “close-close volatility” method. Therefore, the following formula is used in calculating the volatility of an index for an n number of trading days (including t day) as of the t day;
Volatility was measured by using the standard deviation. 𝑆 = √∑(𝑅−𝑅̅)2
𝑛−1 (10)
𝑆 is standard deviation, R is return of stock exchange index, 𝑅̅ is the mean of stock return, n is number of day.
The Pearson Correlation is used to measure the linear dependence between 𝑃𝑑 and 𝑅𝑑 given two-time series, 𝑋𝑡 and 𝑌𝑡, the Pearson’s correlation coefficient is calculated as:
𝜌(𝑋, 𝑌) = (𝑋𝑡𝑌𝑡)−(𝑋𝑡𝑌𝑡)
((𝑋𝑡2)−(𝑋𝑡)2)((𝑌𝑡2)−(𝑌𝑡)2) (11)
In the correlation analysis, the direction and severity of the relationship between the two variables are calculated. Otherwise, a regression analysis is an analysis method that allows us to find out the cause-effect relationship between
variables and foresee the value of the dependent variable, based on the known value of the independent variable.
(Sprenger, 2010:1-16) claimed interesting relationships between tweet features and market features and they proved a strong relationship between bullishness and a stock return using a regression equation.
𝑌𝑡 = 𝛼 + 𝛽𝑋𝑡+ 𝜀𝑡 (12)
For this reason, a linear regression model was applied to test the relationship between Twitter predictor and stock indicators. A regression framework is presented to predict the stock exchange movements with the twitter message and sentiment analysis data.
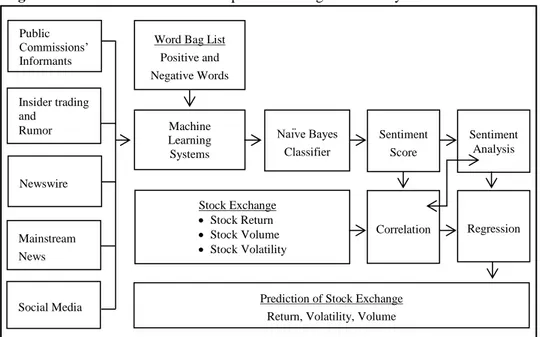
Figure 1 shows the process of information flow and computational linguistics.
Figure 1: Information Flow and Computational Linguistics Analysis
3. Findings and Discussions
Following (Antweiler et al., 2004: 1259-1294) and (Sprenger et al., 2010:791), Pearson Correlations are applied for an initial investigation of the contemporaneous relationship between the Twitter sentiment and stock prices in this article. Mainstream News Insider trading and Rumor Newswire
Word Bag List Positive and Negative Words Machine Learning Systems Sentiment Score Sentiment Analysis Public Commissions’ Informants Naïve Bayes Classifier Stock Exchange Stock Return Stock Volume Stock Volatility Regression Correlation
Prediction of Stock Exchange Return, Volatility, Volume Social Media
3.1. Pearson Correlations
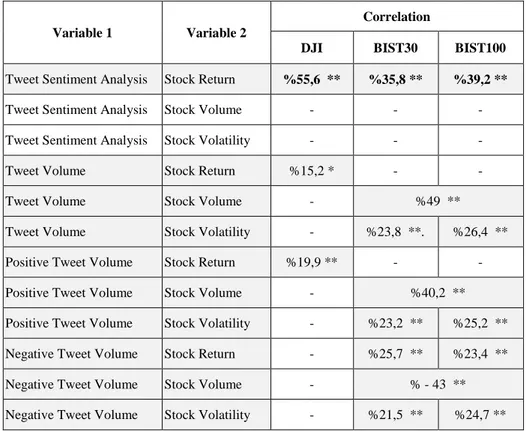
Table 1 displayed a summary result of all correlation analysis.
Table 1: The Summary of Result of Correlation Analysis
Variable 1 Variable 2
Correlation
DJI BIST30 BIST100
Tweet Sentiment Analysis Stock Return %55,6 ** %35,8 ** %39,2 **
Tweet Sentiment Analysis Stock Volume - - -
Tweet Sentiment Analysis Stock Volatility - - -
Tweet Volume Stock Return %15,2 * - -
Tweet Volume Stock Volume - %49 **
Tweet Volume Stock Volatility - %23,8 **. %26,4 **
Positive Tweet Volume Stock Return %19,9 ** - -
Positive Tweet Volume Stock Volume - %40,2 **
Positive Tweet Volume Stock Volatility - %23,2 ** %25,2 **
Negative Tweet Volume Stock Return - %25,7 ** %23,4 **
Negative Tweet Volume Stock Volume - % - 43 **
Negative Tweet Volume Stock Volatility - %21,5 ** %24,7 **
*Correlation is significant at the 0.05 level (2-tailed). **Correlation is significant at the 0.01 level (2-tailed).
Table 1 displayed a summary result of all correlation analysis. (Rao et al., 2012:1-5) found 88 percent correlation between Twitter sentiment analysis and stock prices, volume, and volatility of DJI, NASDAQ-100 Index. (Souza et al., 2015:1-23) observed a relationship among stock returns, volatility and Twitter sentiment. (Pagula et al., 2016:1343-1350) provided significant and strong correlation of 71,82 percentages between the sentiment mining and the movement of Microsoft’s stock price. (Kordonis et al., 2016:1-6) found a correlation between sentiment analysis of Twitter and stock price.
There is a relatively strong relationship between tweet sentiments analysis and stock returns for all stock exchanges in data of this article (DJI (r = 0,556)
and ISE (r = 0,358 and r = 0,392) (See the Appendices A)). In addition, another significant result is between DJI stock return and tweet volume (r = 0,152) with positive tweet volume (r = 0,199).
Furthermore, a strong correlation is observed between tweet volume and stock volume for BIST (r = 0, 49). In addition, another strong correlation is exhibited between negative tweet volume and stock volume for BIST (r = 0,43).
(Ranco et al., 2015:1-22) demonstrated that Twitter volume at the peak levels can forecast the direction of stock returns. In this study, it was found that there is a strong correlation between positive tweet volume and stock volume (r
= 0,402). Also, there is a relatively strong correlation between positive or
negative tweet volume and stock volatilities (range of r = 0,215 and r = 0,264). Finally, another relatively strong correlation is between positive tweet volume and stock return (r = 0,257 and r = 0,234).
3.2. Contemporaneous Regressions
A regression analysis is an analysis method that allows us to find out the cause-effect relationship between variables and foresee the value of the dependent variable, based on the known value of the independent variable.
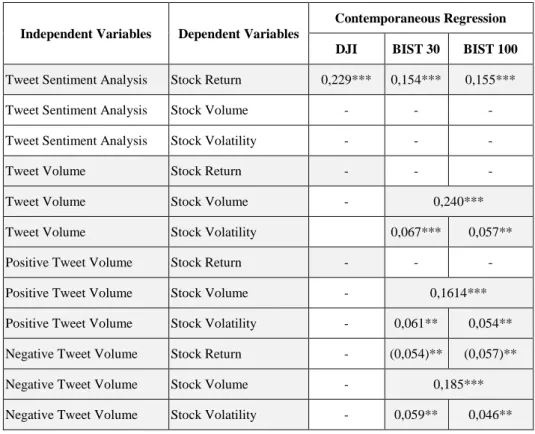
Table 2 below displayed a summary result of all contemporaneous regression analysis for DJI, BIST 30 and BIST 100(See Appendices B and D). Also, all assumptions of the regression analysis are provided by tests (See Appendices C and E).
In conclusion, there is a contemporaneous relationship between sentiment analyses and returns. On the contrary, there is no relationship between sentiment analysis, message volume, and trading volume. Moreover, according to the results, there is a simultaneous regression among positive, negative, neutral tweet volume, volume, and volatility of stock, especially available in Turkish stock indexes.
DJIR = −0,041 + 0,231 ∗ DJISA + ε (14) BIST30R = 0,093 + 0,365 ∗ BISTSA + ε (15) BIST100R = 0,094 + 0,353 ∗ BISTSA + ε (16)
Table 2: The Summary of Contemporaneous Regression
Independent Variables Dependent Variables
Contemporaneous Regression DJI BIST 30 BIST 100 Tweet Sentiment Analysis Stock Return 0,229*** 0,154*** 0,155***
Tweet Sentiment Analysis Stock Volume - - -
Tweet Sentiment Analysis Stock Volatility - - -
Tweet Volume Stock Return - - -
Tweet Volume Stock Volume - 0,240***
Tweet Volume Stock Volatility 0,067*** 0,057**
Positive Tweet Volume Stock Return - - -
Positive Tweet Volume Stock Volume - 0,1614***
Positive Tweet Volume Stock Volatility - 0,061** 0,054**
Negative Tweet Volume Stock Return - (0,054)** (0,057)**
Negative Tweet Volume Stock Volume - 0,185***
Negative Tweet Volume Stock Volatility - 0,059** 0,046**
Notes: The values show the R-squared of the regressions.
* p<0.05, ** p<0.01, *** p<0.001, t-statistics in italics below the coefficients.
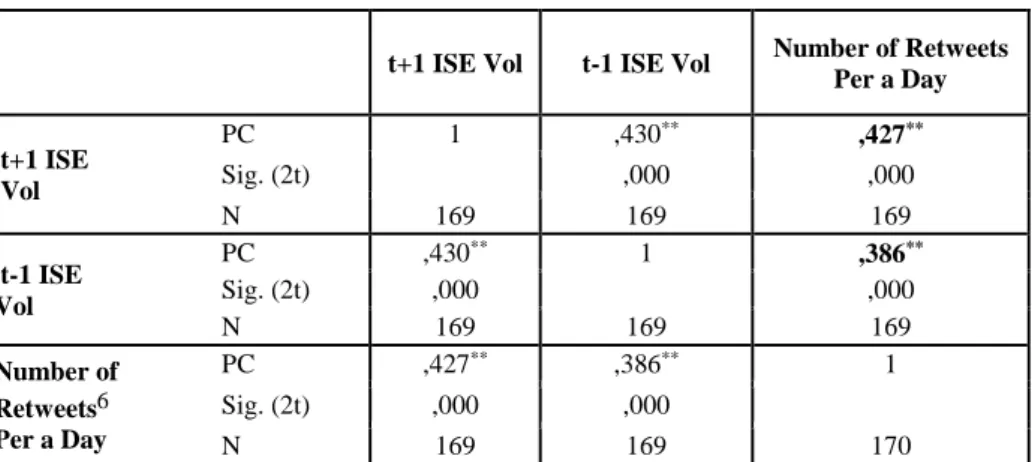
3.3 Volume Predictor Correlation Between BIST Volume and Tweet Volume
(Antweiler et al., 2004:1259-1294) finds that message volume can predict next-day stock volume. In this paper, for a day t was used lag 1 and lag 1
to represent the direction of change for BIST Volume closing-value from day
1
Table 3: Correlation Matrix
t+1 ISE Vol t-1 ISE Vol Number of Retweets Per a Day t+1 ISE Vol PC 1 ,430** ,427** Sig. (2t) ,000 ,000 N 169 169 169 t-1 ISE Vol PC ,430** 1 ,386** Sig. (2t) ,000 ,000 N 169 169 169 Number of Retweets6 Per a Day PC ,427** ,386** 1 Sig. (2t) ,000 ,000 N 169 169 170
** Correlation is significant at the 0.01 level (2-tailed).
Table 3 figured out that there is a positive correlation between the number of retweets and BIST Volume lag 1 andlag 1. It shows a weak uphill (positive) linear relationship and statistically significant correlation (r = 0.427, r
= 0.386 p = 0.01).
Conclusion
Sentiment analysis has become an important area for academics, especially with the widespread use of social networks and smartphones. Microblogs are one of the best places to test sentiment analysis because data is easy to access data and it has a rich database.
Academics have argued many times in their study that microblogs contain very valuable scientific information. For example; Bollen claimed that it was a Twitter-based transaction for stock estimates in 2013 and had an accuracy of 86.7 percent. The article attracted great attention from the media.
In addition, Journalist Jordan (2010) wrote an article, "Hedge Fund Will Track Twitter to Predict Stock Moves “, for Bloomberg News. In this article, Jordan interviewed Paul Hawtin, co-owner of Derwent Absolute Return Fund Ltd. Hawtin announced that they are working on Twitter sentiment analysis to predict future prices of stocks. He also told that they had made a contract with some university academics to write an article about how they predicted the DJIA index using twitter sentiments.
In light of these researches, this article tries to confirm that stock microblogs contain valuable information for investors and can help predict the future stock exchange return, stock exchange volume and stock exchange volatility.
Why Tweeter was preferred for sentiment analysis in this article is based on the fact that it has a high number of users and it shares the database with the public, Tweeter is the number one Microblog for sentiment analysis. This article attempts to reveal the relationship among stock-related tweets and stock returns, stock volume and stock volatility by sentiment analysis. In addition, the article tries to confirm that Retweets are a useful tool for estimating the stock volume. In general, according to the test results of this article, unlike US stock exchanges, there are many significant relationships between stock-related Tweets and Istanbul Stock Exchanges. There may be some reasons for this. For instance; Turkish investors prefer to use social media and other investors' rumours when making financial decisions.
On the other hand, US investors prefer to use technical and fundamental analysis instead of using social media and rumour news while making financial decisions. One of the most popular Wall Street traders, Paul Glandorf (Long, 2014), who had made a lot of money, took into account the fundamentals and technical analysis of a stock. He explained that most of the time he didn't even know the companies' names.
Of course, Wall Street Traders are using sentiment analysis in a professional and very broad manner. Even huge hedge funds have started to use the sentiment analysis and algorithms used in stock market forecasting. There are also many companies and software that serve the sentiment analysis for their customers. For example; ISentium LLC, a technology company that analyzes one million tweets per day to identify sentiment analyzes for customers of stock companies. In addition, Dow Jones Factiva is a software program that can scan 400 sources from electronic and print media.
As a conclusion, in the same line with (Sprenger, 2010), Eliaçık and Erdoğan (2015), Kordonis et al. (2016) and Kürkçü (2017), in this study, there is a significant relationship between sentiment analysis of Twitter and stock returns in both DJI and BIST indexes. It means that if the probability of positive Tweets increase, investors may expect a positive increase in the stock exchange index. In the same way, if the probability of negative Tweets increases, investors may expect a negative decrease in the stock exchange index. The results clearly indicate that sentiment analysis of Tweet may be a kind of predictor tool for investors.
There is a positive relationship between the number of Tweets, BIST stock exchange volume and BIST stock exchange volatility. It is a kind of predictor
tool, too. Because if stock related positive Tweets increase, investors may expect an increase in both stock exchange volume and stock exchange volatility in the future.
There is a positive relationship between the number of positive Tweets, BIST stock exchange volume and BIST stock exchange volatility. It is another predictor tool, too. Because if the number of positive stock related Tweets increase, investors may expect an increase in the future for both stock exchange volume and stock exchange volatility.
There is an inverse relationship between the number of negative Tweets and BIST stock exchange return. On the other hand, there is a positive relationship between the number of negative Tweets, BIST stock exchange volume and BIST stock exchange volatility. It is another predictor tool, too. Because if stock related negative Tweets increase, investors may expect a decrease in stock exchange return and an increase in stock exchange volume and stock volatility.
In the same line with (Antweiler et al., 2004:1259-1294), this paper figured out that there is a positive significant correlation between the number of retweets and at day lag+1 BIST Volume and day lag-1 BIST Volume.
It is a predictor, too. Because, if the number of stock-related retweets increases, investors may expect an increase in stock exchange volume the next day. On the other hand, if the stock exchange volume increase, an increase may be expected in the number of stock related ReTweets in Tweeter on the next day.
In summary, this article approved that stock microblogs contain valuable information for investors and can help predict the future stock exchange return, stock exchange volume and stock exchange volatility.
References
Antweiler, W., & Frank, Z. M. (2004), "Is All That Talk Just Noise? The Information Content of Internet Stock Message Boards", Journal of Finance, 59(3): 1259–1294. http://dx.doi.org/10.2139/ssrn.282320
Bollen, J., Mao, H., & Pepe, A. (2009)," Modeling Public Mood and Emotion: Twitter Sentiment and Socio-Economic Phenomena", In Proceedings of the Fifth International AAAI Conference on Weblogs and Social Media, p.10(5): 311-313 https://arxiv.org/abs/0911.1583
Bollen, J., Mao, H.(2011)," Twitter mood predicts the stock market", Computer, 44(10): 91–94. https://ieeexplore.ieee.org/document/6036101
Dogramaci, E. & Radcliffe, D. (2015), "How Turkey Uses Social Media", http://www.digitalnewsreport.org/essays/2015/how-turkey-uses-social-media/
(18.06.2018)
Fang, L., & Peress, J. (2009)," Media Coverage and the Cross-section of Stock Returns", The Journal of Finance, 64(5): 2023–2052. https://doi.org/10.1111/j.1540-6261.2009.01493.x
Giller, G. L. (2009)," Maximum Likelihood Estimation of a Poissonian Count Rate Function for the Followers of a Twitter Account Making Directional Forecasts of the Stock Market", Ssrn, (2): 2–6. https://doi.org/10.2139/ssrn.1423628
Go, A., Bhayani, R., & Huang, L. (2009),"Twitter Sentiment Classification using Distant Supervision", Processing:1-6, Project Report, Stanford.
Kibriya, A. M., Frank, E., Pfahringer, B., & Holmes, G. (2004)," Multinomial Naive Bayes for Text Categorization Revisited": 488–499. https://doi.org/10.1007/978-3-540-30549-1_43 Kordonis, J., Symeonidis, S., & Arampatzis, A. (2016), "Stock Price Forecasting via Sentiment
Analysis on Twitter", Proceedings of the 20th Pan-Hellenic Conference on Informatics - PCI ’16: 1–6. https://doi.org/10.1145/3003733.3003787
Long, H. (2014), "77-year-old trader: How I made a lot of money", http://money.cnn.com/ 2014/06/07/investing/stock-market-trading-oracle-ohio/index.html (06.04.2018)
Pagolu, V. S., Reddy, K. N., Panda, G., & Majhi, B. (2016), "Sentiment analysis of Twitter data for predicting stock market movements", International Conference on Signal Processing, Communication, Power and Embedded System, SCOPES 2016 - Proceedings: 1345– 1350. https://doi.org/10.1109/SCOPES.2016.7955659
Ranco, G., Aleksovski, D., Caldarelli, G., Grčar, M., & Mozetič, I. (2015), "The effects of twitter sentiment on stock price returns", PLoS ONE, 10(9): 1–21. https://doi.org/10.1371/ journal.pone.0138441
Rao, T., & Srivastava, S. (2012), "Analyzing Stock Market Movements Using Twitter Sentiment Analysis", NSIT, In: Proceedings of the 2012 International Conference on Advances in Social Networks Analysis and Mining (ASONAM 2012). Delhi, India:1-5.
Sahin, M., Sulubacak, U., & Eryigit, G. (2013), "Redefinition of Turkish morphology using flag diacritics", Proceedings of the Tenth Symposium on Natural Language Processin:1-8 http://web.itu.edu.tr/gulsenc/project/2013_SNLP.pdf
Schmid, H. (1994), "Probabilistic part-of-speech tagging using decision trees", In Proceedings of the international conference on new methods in language processing:1-9.
Souza, T. T. P., Kolchyna, O., Treleaven, P. C., & Aste, T. (2015), "Twitter Sentiment Analysis Applied to Finance: A Case Study in the Retail Industry":1-23. https://arxiv.org/abs/1507.00784 Sprenger, T. O., Tumasjan, A., Sandner, P. G., & Welpe, I. M. (2014), "News or Noise? Using Twitter
to Identify and Understand Company-specific News Flow", Journal of Business Finance & Accounting, 41(7): 791–830. https://doi.org/10.1111/jbfa.12086
Sprenger, T. O., & Welpe, I. M. (2010)," Tweets and Trades: The Information Content of Stock Microblogs", European Financial Management, 20(5):1-16. https://doi.org/10.2139/ ssrn.1702854
Tetlock, Paul C.,Saar-Tsechansky M., M. S. (2008), "More than words: Quantifying language to measure firms' fundamentals", The Journal of Finance, 63(3): 1437–1467. http://onlinelibrary.wiley.com/doi/10.1111/j.1540-6261.2008.01362.x/full
Tetlock, P.C. (2007), "Giving content to investor sentiment: The role of media in the stock market", Journal of Finance, 62(3):1139–1168. Journal of Finance, 62(3): 1139–1168. https://doi.org/10.1111/j.1540-6261.2007.01232.x
Twitter. (2017), "Number of montly active Twitter user worldwide from 1st quarter 2010 to 4th quarter 2017 (in millions)", https://www.statista.com/statistics/278414/number-of-worldwide-social-network-users/ (18.06.2018)
Zhang, X., Fuehres, H., & Gloor, P. A. (2011), "Predicting Stock Market Indicators Through Twitter (I hope it is not as bad as I fear)", Procedia - Social and Behavioral Sciences, 26: 55–62. https://doi.org/10.1016/j.sbspro.2011.10.562