PAST, PRESENT, AND FUTURE ON NEWS
STREAMS: DISCOVERING STORY CHAINS,
SELECTING PUBLIC FRONT-PAGES, AND
FILTERING MICROBLOGS FOR PREDICTING
PUBLIC REACTIONS TO NEWS
a dissertation submitted to
the graduate school of engineering and science
of bilkent university
in partial fulfillment of the requirements for
the degree of
doctor of philosophy
in
computer engineering
By
C
¸ a˘
grı Toraman
September, 2017
PAST, PRESENT, AND FUTURE ON NEWS STREAMS: DISCOVERING STORY CHAINS, SELECTING PUBLIC FRONT-PAGES, AND FILTERING MICROBLOGS FOR PREDICTING PUBLIC REACTIONS TO NEWS
By C¸ a˘grı Toraman September, 2017
We certify that we have read this dissertation and that in our opinion it is fully ade-quate, in scope and in quality, as a dissertation for the degree of Doctor of Philosophy.
Fazlı Can(Advisor)
˙I. Seng¨or Altıng¨ovde
G¨onen¸c Ercan
U˘gur G¨ud¨ukbay
¨
Ozg¨ur Ulusoy
Approved for the Graduate School of Engineering and Science:
ABSTRACT
PAST, PRESENT, AND FUTURE ON NEWS STREAMS:
DISCOVERING STORY CHAINS, SELECTING PUBLIC
FRONT-PAGES, AND FILTERING MICROBLOGS FOR
PREDICTING PUBLIC REACTIONS TO NEWS
C¸ a˘grı Toraman
Ph.D. in Computer Engineering Advisor: Fazlı Can
September, 2017
News streams have several research opportunities for the past, present, and future of events. The past hides relations among events and actors; the present reflects needs of news readers; and the future waits to be predicted. The thesis has three studies regarding these time periods: We discover news chains using zigzagged search in the past, select front-page of current news for the public, and filter microblogs for predicting future public reactions to events.
In the first part, given an input document, we develop a framework for discovering story chains in a text collection. A story chain is a set of related news articles that reveal how different events are connected. The framework has three complementary parts that i) scan the collection, ii) measure the similarity between chain-member candidates and the chain, and iii) measure similarity among news articles. For scan-ning, we apply a novel text-mining method that uses a zigzagged search that reinves-tigates past documents based on the updated chain. We also utilize social networks of news actors to reveal connections among news articles. We conduct two user studies in terms of four effectiveness measures: relevance, coverage, coherence, and ability to disclose relations. The first user study compares several versions of the framework, by varying parameters, to set a guideline for use. The second compares the framework with 3 baselines. The results show that our method provides sta-tistically significant improvement in effectiveness in 61% of pairwise comparisons, with medium or large effect size; in the remainder, none of the baselines significantly outperforms our method.
iv
In the second part, we select news articles for public front pages using raw text, without any meta-attributes such as click counts. Front-page news selection is the task of finding important news articles in news aggregators. A novel algorithm is introduced by jointly considering the importance and diversity of selected news articles and the length of front pages. We estimate the importance of news, based on topic modelling, to provide the required diversity. Then, we select important documents from important topics using a priority-based method that helps in fitting news content into the length of the front page. A user study is conducted to measure effectiveness and diversity. Annotation results show that up to 7 of 10 news articles are important, and up to 9 of them are from different topics. Challenges in selecting public front-page news are addressed with an emphasis on future research.
In the third part, we filter microblog texts, specifically tweets, to news events for predicting future public reactions. Microblog environments like Twitter are increas-ingly becoming more important to leverage people’s opinion on news events. We create a new collection, called BilPredict-2017 that includes events including terror-ist attacks in Turkey from 2015 to 2017, and also Turkish tweets that are published during these events. We filter tweets by using important keywords, analyze them in terms of several features. Results show that there is a high correlation between time and frequency of tweets. Sentiment and spatial features also reflect the nature of events, thus all of these features can be utilized in predicting the future.
¨
OZET
HABER AKIS
¸LARINDA GEC
¸ M˙IS
¸, G ¨
UN ¨
UM ¨
UZ VE
GELECEK: HABER Z˙INC˙IRLER˙IN˙IN KES
¸F˙I,
ANASAYFALARIN HABER SEC
¸ ˙IM˙I, HABERE KARS
¸I
TOPLUMSAL TEPK˙IN˙IN TAHM˙IN˙I ˙IC
¸ ˙IN M˙IKROBLOG
F˙ILTRELENMES˙I
C¸ a˘grı Toraman
Bilgisayar M¨uhendisli˘gi, Doktora Tez Danı¸smanı: Fazlı Can
Eyl¨ul 2017
Haber akı¸slarında olayların ge¸cmi¸s, ¸simdiki ve gelecek zamanı ile ilgili bir¸cok ara¸stırma imkanı bulunmaktadır. Ge¸cmi¸s zaman olayların ve akt¨orlerin ili¸skileri barındırmakta; ¸simdiki zaman haber okuyucularının ihtiya¸clarını yansıtmakta; gele-cek zaman ise tahmin edilmeyi beklemektedir. Bu tez, bahsedilen ¨u¸c zaman dilimiyle ilgili ¸su b¨ol¨umlerden olu¸smaktadır: Ge¸cmi¸ste zikzaklı arama yaparak haber zincir-lerini ke¸sfetmekte, g¨un¨um¨uz haberlerinden genel ama¸clı anasayfa olu¸sturmakta ve mikroblog yazılarını toplumsal olay tahmini i¸cin haberlere g¨ore filtrelemekteyiz.
˙Ilk b¨ol¨umde, verilen bir haber yazısına g¨ore bir koleksiyon i¸cerisinden haber zin-cirlerini ke¸sfeden bir ¸cer¸ceve geli¸stirmekteyiz. Haber zinciri, farklı haber yazılarının bir araya gelmesiyle olu¸smakta ve farklı olayların nasıl bir araya geldi˘gini ortaya ¸cıkarmaktadır. Geli¸stirdi˘gimiz ¸cer¸ceve y¨ontem birbirini tamamlayan ¸su ¨u¸c b¨ol¨umden olu¸smaktadır. i) Koleksiyonun taranması, ii) zincir ile zincire eklenecek aday arasındaki benzerli˘gin hesaplanması ve iii) haber yazıları arasındaki benzerli˘gin hesa-planmasıdır. Tarama i¸slemi i¸cin, g¨uncellenen zincire g¨ore ¨onceki dok¨umanları tekrar inceleyen zikzaklı arama yapan yeni bir metin madencili˘gi y¨ontemi uygulamaktayız. Haber yazıları arasındaki ili¸skilerin ortaya ¸cıkarılması i¸cin ise haber akt¨orlerinin sosyal a˘gından faydalanmaktayız. Etkinli˘gin d¨ort farklı y¨ontem—ilgi, kapsam, ahenk ve ili¸skilerin ke¸sfi—a¸cısından de˘gerlendirildi˘gi iki kullanıcı ara¸stırması yapmaktayız. ˙Ilk kullanıcı ara¸stırması ¸cer¸ceve y¨ontemin farklı versiyonlarını kıyaslayarak
kul-vi
ile kıyaslamaktadır. Sonu¸clara g¨ore y¨ontemimiz ikili kıyaslamaların %61’inde, orta ya da b¨uy¨uk etki boyutunda istatistiksel anlamda farklı olacak ¸sekilde, etkinli˘gin iy-ile¸smesini sa˘glamaktadır. ¨Oteki kıyaslamalarda herhangi bir alt¸cizgi y¨ontemi bizim y¨ontemimizi istatistiksel olarak ge¸cememektedir.
˙Ikinci b¨ol¨umde, tıklama sayıları gibi meta-¨ozellikler kullanmadan, sadece d¨uz metin kullanarak haberler i¸cin toplumsal anasayfa se¸cmekteyiz. Anasayfa haber se¸cimi, haber toplayıcılarında ¨onemli haberlerin bulunmasıdır. Anasayfaların uzunlu˘gu ve se¸cilen haberlerin ¨onemi ve ¸ce¸sitlili˘gi beraber d¨u¸s¨un¨ulerek yeni bir algo-ritma geli¸stirilmektedir. Haberlerin ¨onemini, ¸ce¸sitlili˘gi de sa˘glamak amacıyla, konu ba¸slı˘gı modelleme y¨ontemiyle tahmin etmekteyiz. ¨Onemli dok¨umanları daha sonra ¨
onemli konu ba¸slıklarından, anasayfa uzunlu˘gunu dolduracak ¸sekilde ¨oncelik-tabanlı bir method ile se¸cmekteyiz. Etkinli˘gin ve ¸ce¸sitlili˘gi bir kullanıcı ara¸stırmasıyla ¨
ol¸cmekteyiz. Sonu¸clara g¨ore haber yazılarının 10 tanesinin en ¸cok yedi tanesi ¨onemli bulunmakta, dokuz tanesi ise farklı konu ba¸slıklarından g¨oz¨ukmektedir. ˙Ileride yapılacak ara¸stırmalara yol g¨ostermesi i¸cin genel ama¸clı anasayfa se¸cimindeki zor-luklardan da bahsetmekteyiz.
¨
U¸c¨unc¨u b¨ol¨umde ise haber olaylarına kar¸sı ileride ger¸cekle¸secek toplumsal tep-kiyi tahmin etmekte kullanılabilecek filtreleme i¸slemini ger¸cekle¸stirmekteyiz. Twit-ter gibi mikroblog ortamları, toplumun g¨or¨u¸slerini ortaya ¸cıkarmasıyla g¨un ge¸ctik¸ce daha fazla ¨onem kazanmaktadır. Ter¨or olayları gibi 2015 ve 2017 yılları arasında ger¸cekle¸smi¸s olayı ve bu olaylar sırasında atılan tweet’leri i¸ceren BilPredict-2017 adında yeni bir toplumsal tepki veri setini geli¸stirmi¸s durumdayız. ¨Onemli kelimelere g¨ore tweet’leri filtrelemekte ve bunları ¸ce¸sitli ¨ozelliklere g¨ore analiz etmekteyiz. Sonu¸clar, frekans, duygusallık, yer ve zaman ¨ozelliklerinin haber olaylarının do˘gasını yansıttıklarından dolayı gelecek tahmininde yararlanılabileceklerini g¨ostermektedir.
Acknowledgement
For their endless love and support, I thank my mom and dad, ¨Ulk¨u and Abdullah, my brother, Teoman, my lovely Huriye, my children Oscar and Tar¸cın, my friends Hasan, Emre, and Sermetcan.
For his great directions and vision, I thank my supervisor, Fazlı Can.
I thank the committee members, ˙I. Seng¨or Altıng¨ovde, G¨onen¸c Ercan, U˘gur G¨ud¨ukbay, ¨Ozg¨ur Ulusoy, and the former member Hakan Ferhatosmano˘glu, for their valuable reviews.
I thank all annotators for their kind support, Bilkent University Computer En-gineering Department for their financial support on both my studies and travels, and T ¨UB˙ITAK (The Scientific and Technological Research Council of Turkey) who supported the works of the second, third, and fourth chapters under grant numbers 113E249, 111E030, and 215E169, respectively.
Contents
1 Introduction 1
2 The Past: Discovering Story Chains 3
2.1 Motivation . . . 3
2.2 Aim . . . 4
2.3 Contributions . . . 5
2.4 Related Work . . . 6
2.4.1 Simple Story Chains . . . 6
2.4.2 Cluster-based Story Chains . . . 6
2.4.3 Complex Story Chains . . . 7
2.4.4 Other Studies Related to Discovery of Story Chains . . . 8
2.4.5 Named Entity Recognition . . . 8
2.5 A Framework for Story-Chain Discovery . . . 9
2.5.1 Scanning the Collection . . . 10
2.5.2 Similarity of Candidate with News Chain . . . 13
2.5.3 Similarity Between News Articles . . . 14
2.6 Evaluation . . . 17
2.6.1 Setup . . . 18
2.6.2 User Study 1: Varying Framework Parameters . . . 25
2.6.3 User Study 2: Comparison with Baselines . . . 34
CONTENTS ix
2.7.1 Practical Considerations . . . 36
2.7.2 Complexity Analysis . . . 40
3 The Present: Selecting Public Front-pages 43 3.1 Motivation . . . 43
3.2 Aim . . . 44
3.3 Contributions . . . 46
3.4 Related Work . . . 46
3.4.1 News Selection . . . 46
3.4.2 Diversity in Document Selection . . . 48
3.5 Front-page News Selection based on Topic Modelling . . . 49
3.5.1 Finding Topics . . . 50
3.5.2 Finding Document Importance . . . 51
3.5.3 Finding Topic Importance . . . 52
3.5.4 Priority-based News Selection using Document and Topic Im-portance . . . 54
3.6 Evaluation . . . 57
3.6.1 Setup . . . 57
3.6.2 User Study . . . 58
3.6.3 Results and Discussion . . . 61
4 The Future: Filtering Microblogs for Predicting Public Reactions to News 63 4.1 Motivation . . . 63 4.2 Aim . . . 64 4.3 Contributions . . . 65 4.4 Related Work . . . 65 4.4.1 Event Detection . . . 65
4.4.2 Prediction with Social Media . . . 66
CONTENTS x
4.5 Our Filtering System . . . 67
4.5.1 Preprocessing Tweets . . . 67 4.5.2 Sentiment Analyzer . . . 68 4.5.3 Filtering . . . 69 4.6 Analysis . . . 70 4.6.1 Dataset . . . 70 4.6.2 Setup . . . 71
4.6.3 Results and Discussion . . . 72
5 Conclusion and Future Work 82 5.1 Conclusion . . . 82
5.2 Future Work . . . 83
Bibliography 85 A Details of Discovering Story Chains 98 A.1 Output Chains . . . 98
A.2 User Study for Comparing with Baselines . . . 98
B Details of Selecting Public Front-pages 103 B.1 Main User Study . . . 103
B.2 Additional User Study . . . 103
C Details of Filtering Microblogs 105 C.1 Collection . . . 105
List of Figures
2.1 A sample story chain with five documents that tells a story that con-nects public protests in Ukraine with Russian independence activists
in Crimea. . . 4
2.2 An illustration of the proposed framework that uses a sliding-time window with zigzagged search, and a social network of news actors. . 10
2.3 Discovery of a sample story chain by using a sliding-time window with zigzagged search. . . 12
2.4 The framework algorithm for story chain–discovery. . . 17
2.5 A sample screen for the tasks screen of annotation program. . . 22
2.6 A sample screen from the annotation program. . . 23
2.7 Annotation results for Decision 1: Proper window length. . . 28
2.8 Annotation results for Decision 2: all members vs. weighted members. 30 2.9 Annotation results for Decision 3: All news actors vs. top 500 news actors. . . . 31
2.10 Annotation results for Decision 4: Similarity methods. . . 32
2.11 Screenshots (top: front page, down: user interface for parameter selec-tion) from Bilkent News Portal where our framework for story-chain discovery is applied. . . 40
LIST OF FIGURES xii
3.2 A sample document collection with 5 documents, 2 topics, and 5 unique words is given to demonstrate how to find document and topic importance. . . 54 3.3 An illustration of selecting news for two different front-page lengths,
based on the same news collection given in Figure 3.2. . . 56 3.4 Pseudocode for our front-page news selection approach. . . 56 3.5 A sample screenshot from the annotation program. . . 59
4.1 The scatter plot of the date, frequency, sentiment, location, and fol-lower of filtered tweets regarding the event titled “the champions of the 2015 Turkish Super League is Galatasaray.” . . . 73 4.2 The scatter plot of the date, frequency, sentiment, location, and
fol-lower of filtered tweets regarding the event titled “the terror attack in Da˘glıca.” . . . 75 4.4 The scatter plot of the date, frequency, sentiment, location, and
fol-lower of filtered tweets regarding the event titled “Alanyaspor qualified to the Turkish Super League.” . . . 77 4.6 The scatter plot of the date, frequency, sentiment, location, and
fol-lower of filtered tweets regarding the event titled “Magazine program-mer confuses Madonna.” . . . 79 4.3 The scatter plot of the date, frequency, sentiment, location, and
fol-lower of filtered tweets regarding the event titled “Aziz Sancar won the Nobel Prize in Chemistry 2015.” . . . 80 4.5 The scatter plot of the date, frequency, sentiment, location, and
fol-lower of filtered tweets regarding the event titled “the 10th Year
An-them is forbidden in Bolu.” . . . 81
List of Tables
2.1 Main statistics after detecting named entitites in our news collection. 18 2.2 The most frequently seen 10 people in our news collection. . . 19 2.3 The most frequently seen 10 organizations in our news collection. . . 20 2.4 The most frequently seen 10 locations in our news collection. . . 21 2.5 The design of User Study 1: Eight versions (A to H) of the framework
algorithm. . . 26 2.6 The details of the Friedman test for Decision 1 with respect to Figure
2.7. . . 29 2.7 The details of the Wilcoxon test for Decision 2 with respect to Figure
2.8, where “d” is mean difference, “p”, “Z,” and “r” are scores of the Wilcoxon test. . . 31 2.8 The details of the Wilcoxon test for Decision 3 with respect to Figure
2.9. . . 32 2.9 The details of the Friedman test for Decision 4 with respect to Figure
2.10. . . 33 2.10 The design of User Study 2: Comparing our framework algorithm,
hZZ : Hybrid and Zigzagged Search, with three baselines, sTDT : Sim-ple TDT, aTDT : Adaptive TDT, GN : Google News. . . . 35 2.11 The average scores of all annotators for sTDT : Simple TDT, aTDT :
Adaptive TDT, GN : Google News, hZZ : Hybrid and Zigzagged. The method(s) with the highest score is marked as bold. . . 37
LIST OF TABLES xiv
2.12 The details of the Friedman test with respect to Table 2.11. . . 38 2.13 Pairwise comparisons of the methods in Table 2.11. . . 39
3.1 Average, median, standard deviation, minimum, and maximum of ann-imp and ann-div scores are listed for the user study of 19 an-notators. . . 61
4.1 The selected news events for the analysis in filtering. . . 71
A.1 The output of our framework algorithm, for the case Ukrainian Riots, to be compared with baseline methods in the second user study. . . . 99 A.2 The output of our framework algorithm, for the case Trucks Going to
Syria, to be compared with baseline methods in the second user study. 99 A.3 The output of our framework algorithm, for the case Allegations to
Fenerbah¸ce, to be compared with baseline methods in the second user study. . . 100 A.4 The details of the user study that we conduct to compare the success
of our story-chain discovery method with baseline methods, in terms of relevance and coverage. . . 101 A.5 The details of the user study that we conduct to compare the success
of our story-chain discovery method with baseline methods, in terms of coherence and ability to disclose relations. . . 102
B.1 The details of annotation results of our front-page news selection method. . . 104
Chapter 1
Introduction
News streams have hidden research challenges for the past, present, and future of events. The past hides relations among events and actors; the present reflects needs of news readers; and the future waits to be predicted. The thesis has three studies regarding these time periods: We discover news chains using zigzagged search in the past, select front-page of current news for the public, and filter microblogs to predict future public reactions to events.
In the first study, Chapter 2, we present a framework to discover story chains in a given text collection for an input document. A story chain is a set of related text documents, each with a different event. Discovering story chains reveals how events are connected and, thus, enables users to easily understand the big picture of events. In our case, a story chain is constructed for a given document in a news collection. Our framework has three complementary parts that (a) scan the collection, (b) mea-sure the similarity between chain-member candidates and the chain, and (c) meamea-sure similarity among news articles by exploiting lexical features and news actors. We discover story chains with a novel approach, called zigzagged search, that uses a
sliding-time window that updates the current chain incrementally. Contributions of this part, among others, are that we develop a novel story-chain discovery frame-work that employs zigzagged search and news actors, and answer several research questions related to the framework.
In the second study, Chapter 3, we develop a novel approach for public news selection by using only raw text. While selecting the public front page, editors may select worthless news unintentionally, or even according to their own points of view. We present a novel approach that employs topic modelling to find diversified public front pages, while taking into consideration the importance of news within topics. Our method selects the most important news articles in the most important topics with a priority-based method for fitting to the length of the front page. We do not use meta-attributes, but leverage raw text. Contributions of this part, among others, are that we develop a novel algorithm to select public front-page news, and, to the best of our knowledge, this is the first study that examines public front-page news selection using only raw text.
In the third study, Chapter 4, we filter a microblog collection, specifically tweets, according to their relevance to news events in order to exploit these tweets for pre-dicting public reactions to the same events. Microblog environments like Twitter are increasingly becoming more important to leverage people’s opinion on news events. Given a news article as input, we fetch at most 5 days of tweets after the origin date of news event, and then preprocess tweets, which includes cleaning, normalization, and stemming steps. Filtered tweets are analyzed in terms of frequency, sentiment, temporal, and spatial features. Contributions of this part are that we filter microblog texts with a comprehensive analysis of several features to be used in predicting pub-lic reactions, and create a pubpub-lic-reaction dataset including terrorist attacks between 2015 and 2017.
Chapter 2
The Past: Discovering Story
Chains
12.1
Motivation
A story chain is a set of related text documents, each with a different event. In our case, a story chain is constructed for a given document in a news collection. We use the phrases “story chain” and “news chain” interchangeably. Discovering news chains (a) reveals how events are connected and, thus, enables users to easily understand the big picture of events, (b) makes news consumers become aware of hidden relations among events, (c) detects different aspects of the input story, and (d) helps avoid information overload. Some of the possible application domains of story-chain discovery are investigative journalism, in which journalists or researchers examine a specific news topic; the analysis of intelligence reports [2], patents [3], and legal documents [4].
2.2
Aim
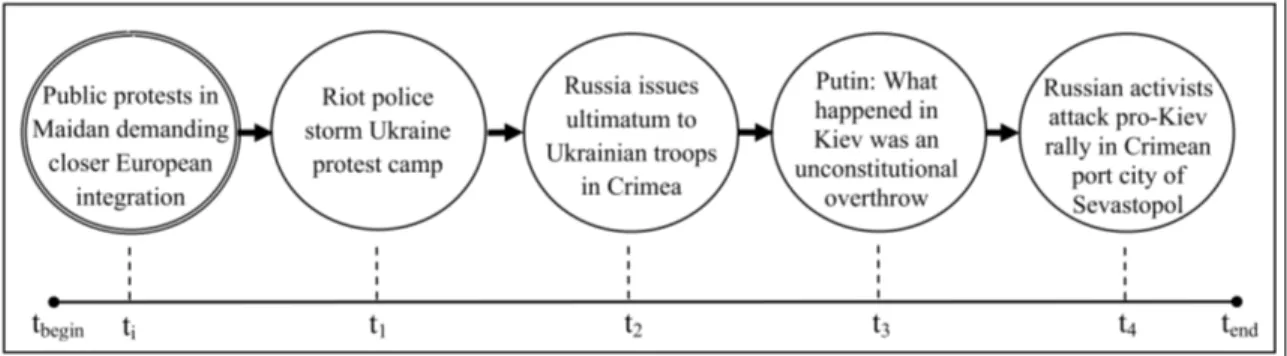
A good story chain has a set of properties. Shahaf and Guestrin [5] argue that relevance between input and chain members should be high. Coherence is another important property of news chains, which means a low relevance gap in the transition between any two chain members. Zhu and Oates [6] expand the characteristics of news chains with measures of low redundancy and high coverage. A story chain has low redundancy when it includes no more than one representative for each event, and high coverage when it covers different aspects of the story. In addition to these, we also consider if previously unknown relations among news actors are disclosed by the chain—we call it the ability to disclose relations. Figure 2.1 shows a sample story chain with five documents.
Figure 2.1: A sample story chain with five documents that tells a story that connects public protests in Ukraine with Russian independence activists in Crimea. The input document is double circled with timestamp ti. The beginning and end of the collection are tbeginand tend, respectively.
We present a framework for story-chain discovery based on three complementary parts that (a) scan the collection, (b) measure the similarity between chain-member candidates and the chain, and (c) measure similarity among news articles by exploit-ing lexical features and news actors. We discover story chains with a novel approach that uses a sliding-time window that updates the current chain incrementally.
In-that reinvestigates past documents based on the updated chain. Zigzagged search imitates the forward-and-backward search behavior of an investigative journalist.
In the next section, we list our contributions. We then summarize the related work for story-chain discovery, explain the details of our framework, present the user studies and their results, and finally conclude this chapter with some practical considerations and complexity analysis of our framework algorithm.
2.3
Contributions
The contributions of this chapter are the following. We
1. develop a story-chain discovery framework that employs zigzagged search and news actors,
2. conduct two user studies:
(a) The first finds a guideline for using the framework by answering the fol-lowing research questions:
i. What is the proper time-window length to be used while scanning the collection?
ii. How should we measure the similarity between a news chain and a candidate article?
iii. When a social network of news actors is utilized, is it necessary to use a large network of news actors instead of exploiting a subset of important actors?
iv. Which similarity method performs better in news-chain discovery: lexical features using the vector space model, or meta features based
on news actors? Can we improve the effectiveness by using multiple methods together in a hybrid approach?
(b) The second compares our method with baselines to answer:
i. What are the benefits of our framework against baseline approaches?
3. support user studies with statistical tests, which can set an example for similar studies,
4. and, integrate our framework into a real-time news aggregator to observe its practical implications.
2.4
Related Work
2.4.1
Simple Story Chains
In TDT (Topic Detection and Tracking) [7, 8], a topic is defined as an event or activity, with all directly related events. Since news articles are related to the same topic, we refer to such chains as simple story chains. TDT has a task called link detection that “detects whether a pair of stories discuss the same topic”. In our case, the purpose of story chains is not restricted to detect relations in the same topic, but also coherent connections among different topics.
2.4.2
Cluster-based Story Chains
Mei and Zhai [9] cluster similar documents to obtain trends or themes in time, and then, clusters are connected to exhibit evolutionary theme patterns. Subasic and
Berendt [10] examine evolutionary theme patterns using interactive graphs. Nal-lapati, Feng, Peng, and Allan [11] introduce event threading in clusters of events, and find dependencies among these clusters in a tree structure. Yan, Shi, and Wei [12] develop event evolution graphs, which present underlying structure and relations among events of a topic. Kim and Oh [13] apply topic modeling to uncover groups that contain related documents; chains are then constructed by finding similar top-ics in a time window. Song et al. [14] develop a topic modeling approach to model documents and concept drifts in a tree structure. Shahaf, Guestrin, Horvitz, and Leskovec [15] connect sets of clusters of news articles in a timeline to cover different aspects of the same topic. They find overlaps among clusters of different chains to reveal the evolution of the story.
2.4.3
Complex Story Chains
We define that a story chain is complex if it reveals relations among events of different topics. Complex story chains are first studied by Shahaf and Guestrin [5]. Giving two input news articles, their aim is to find a coherent story chain that connects them by maximizing the influence of the weakest connection. Influence is a measure to find similarity between two documents using the random walk theory. Zhu and Oates [6] claim to improve the approach of Shahaf and Guestrin [5] in terms of efficiency and redundancy. They use the inner structure of news articles by extracting named entities. The main differences of our study from others are the following: (a) We introduce zigzagged search to discover story chains. (b) We exploit social networks of news actors to reveal connections among news articles. (c) Our user studies are supported by statistical tests. (d) We integrate our method into a real-time news aggregator to observe practical issues. (e) Our input is only a news article that indicates the start of a chain, instead of taking both start and end, i.e. connecting
two dots [5] (they do not develop an algorithm from scratch, but adapt their two-input algorithm to the one-two-input problem by extending it with user’s feedback).
2.4.4
Other Studies Related to Discovery of Story Chains
Timeline summarization methods give a summary of a query event with timeline pro-jection [16]. Some studies create a hierarchy in timeline for the given text collection [17]. Giving two objects, storytelling studies [18] aim to explicitly relate them by us-ing their intersections; for instance, two documents (abstracts) are linked by findus-ing word intersections. Choudhary, Mehta, Bagchi, and Balakrishnan [19] find actors and their interactions in a given news collection. Similar studies support intelligence analysts to suggest unknown relations among entities [2].
2.4.5
Named Entity Recognition
There are some popular software tools for Named Entity Recognition (NER). GATE (General Architecture for Text Engineering) [20] is an open-source text analysis Java software developed by The University of Sheffield. It has a pipeline of NLP mod-ules to extract information from plain text such as sentence splitter, tokenizer, POS (part of speech) tagger, and NER. Each of these modules has a language resource like tokenizer rules or sentence segmentation heuristics. Another tool is Stanford’s NER based on linear chain conditional random field (CRF) sequence models [21]. CRF is a hybrid machine-learning approach taking advantages of Hidden Markov Models and MaxEnt Markov Models. This approach is based on features such as previous/next words and prefixes/suffixes. Illinois NE Tagger [22] is another NER tool that employs several machine-learning algorithms such as Hidden Markov Mod-els and Neural Networks. Readers are encouraged to examine Nadeau and Sekine’s
survey [23] for other open-source NER tools.
Although there are several NER tools, most of them do not support Turkish. An exception is JRC-Names [24] developed by EU Joint Research Center that supports multi-languages including Turkish. Since Turkish has an agglutinative morphology, using statistical models for Turkish NER results with the data sparseness problem. Modeling with morphological analysis for Turkish NER improves success in terms of F-Measure [25], [26]. Chain conditional random field (CRF) is also applied for Turkish NER by ITU Turkish NLP Group and results are promising [27]. Lastly, a recent study by K¨u¸c¨uk and Yazıcı develops a comprehensive rule-based approach for Turkish NER that utilizes from several lexicon resources and pattern rules [28]. Lexical resources are used for creating list of people, locations etc. There are approx-imately 12,800 lexical resources and 260 patterns. Morphological analysis is used as well.
Since we observe, during our preliminary experiments, that the named-entity-recognition program of K¨u¸c¨uk and Yazıcı detects more entities than that of both JRC-Names and ITU Turkish NLP Group’s CRF-based approach, we decide to use it in this study.
2.5
A Framework for Story-Chain Discovery
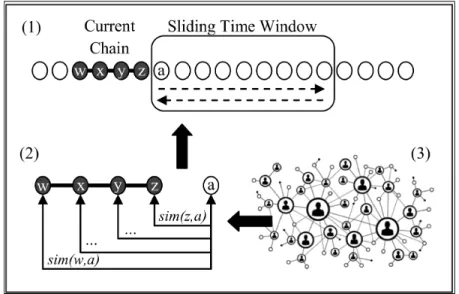
In this section, we present a temporal text-mining framework for story-chain dis-covery. Figure 2.2 shows an illustration of the framework that includes three com-plementary parts: (1) A given collection is scanned by using a sliding-time window that uses zigzagged search. Assume that the current chain includes four documents, labeled w, x, y, z; the first candidate document to be added to the chain is labeled as a. (2) Documents are added to the chain according to the similarity between
the candidate and the chain. (3) Similarity between two documents is measured by employing a social network of news actors to reveal connections among news articles. We also calculate similarities based on the vector space, named-entity, and hybrid model.
Figure 2.2: An illustration of the proposed framework that uses a sliding-time window with zigzagged search, and a social network of news actors.
2.5.1
Scanning the Collection
We scan a given collection to search news articles, related to the input, by using a sliding-time window that uses zigzagged search; Figure 2.3 shows an example. The timeline is divided into non-overlapping windows with a fixed-length (w) in days. We use a time window–based approach to update the current chain incrementally by considering only the members of the window. The user selects a news article di with
the timestamp ti, where 1≤i≤N, and N is the number of documents in the collection.
An initial news chain is created with di. The first window is defined for [ti, ti + w).
than a threshold value , then dc is added to the news chain.
We propose a forward-and-backward zigzagged search. We expect that making a zigzag in the timeline reveals missed news articles by using newly added documents to the chain. To do so, after processing the last news article in terms of time in the window, a new search phase on the same window is started by going backwards in the timeline. All news articles until the beginning of the window are processed in this backward-search phase. However, in this phase, similarity is calculated between the current chain, which is updated in the forward phase, and the candidate document. After a zigzag is completed, the same process is repeated by sliding the window by w days, until the remaining news articles are processed.
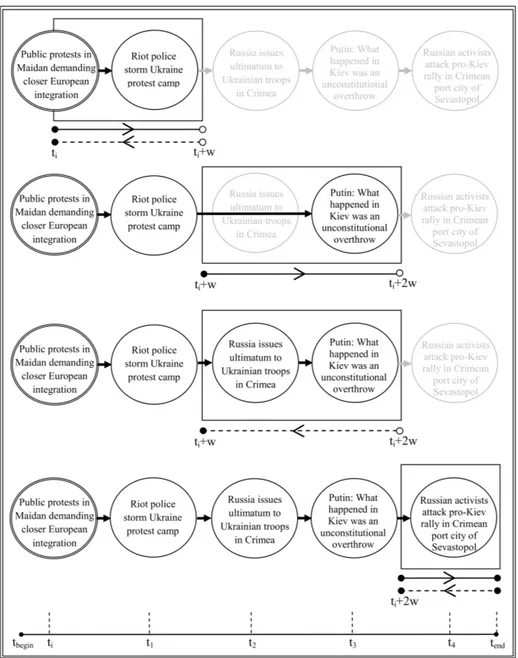
Figure 2.3: Discovery of a sample story chain by using a sliding-time window with zigzagged search. The beginning and end of the collection is tbegin and tend, respectively. Window length is w days.
The beginning of a window is inclusive, and the end is exclusive, shown by filled-in and empty circles, respectively. The input is the double-circled news article that has the timestamp ti, mentioning the
beginning of public protests in Ukraine in 2014. After three windows are processed from ti to tend,
the bottommost chain is the output chain with five documents telling a story that connects public protests in Ukraine with Russian independence activists in Crimea. This chain is an extracted version of the output of hZZ —namely, the hybrid algorithm, to be defined later, of the Ukrainian
2.5.2
Similarity of Candidate with News Chain
While processing each candidate document to be added to the chain, we measure its similarity with the chain, which is represented by all of its current members. We also assign weights to similarity scores between the candidate and chain members. We call these methods all members and weighted members, respectively.
2.5.2.1 All members
Similarity scores between a candidate document, dc, and chain members are measured
as follows, where h is the current chain.
simall(dc, h) =
∑
i∈hsim(di, dc)
|h| (2.1)
2.5.2.2 Weighted members
We assign weights to sim(dc, h), according to the closeness of the candidate document
to the chain as follows, where wi = ri/|h|, and ri is the order of the document, di,
in the chain. We expect to improve the coherence of the chain. For simplicity, it is assumed that wi is calculated to add a candidate document to the end of the chain.
simweighted(dc, h) =
∑
i∈hsim(di, dc)×wi
2.5.3
Similarity Between News Articles
We propose four methods for measuring the similarity between two documents.
2.5.3.1 Vector space–based similarity
In the vector space model, documents are represented with word vectors that are sets of unique tokens in the collection. Each word is assigned to a weight by using term frequency. We calculate similarity between two document vectors by the cosine similarity measure. We use a stop word list—an extended version of the list given in [29]—and F5 stemming, which uses the first five letters of each word, and shows good performance in information retrieval [29] and news categorization [30]. We use the phrases vector space model and cosine similarity interchangeably.
2.5.3.2 Named entity–based similarity
Named entity recognition (NER) is the task of information extraction to identify and classify important elements in a text document [23]. In this study, named entities are detected for people, organizations, and locations. We employ the named-entity-recognition program of K¨u¸c¨uk and Yazıcı [28].
The output of K¨u¸c¨uk and Yazıcı’s algorithm is too noisy, since there are lots of first name that are recognized without its last name, and several named entities refer to the same meaning, which can be solved by named entity resolution [31]. Named entity resolution is a difficult task for Turkish, therefore we manually resolve named entities that refer to the same object. For instance, Atat¨urk and Gazi Mustafa Kemal are two named entities referring to the same person. Manual named entity resolution
are obtained. Then, we write heuristic rules for named entities if they can be resolved by their previous or next tokens. Also, we merge synonyms of popular objects into the same named entity.
After named entities are determined, the similarity between two news articles, di
and dj, is measured by the Dice similarity coefficient, as follows, where Nc is the
number of common unique actors in di and dj; Ni and Nj are the number of unique
actors in di and dj, respectively.
simnamed−entity(di, dj) =
2×(Nc)
Ni+ Nj
(2.3)
2.5.3.3 Social network–based similarity
Social network studies aim to reveal relations among social actors in a network struc-ture [32]. We create a social network of news actors (named entities) for the entire collection, where edges represent relations. We detect news actors as described in above, and create an edge between two actors if both occur in the same document. We use the Dice coefficient for assigning weights to edges. The edge weight, w(a, b), between two actors, a and b, in a social network is determined as follows, where Nc
is the number of documents in which both actors occur, Na and Nb are the numbers
of documents that include the actors a and b.
w(a, b) = 2×(Nc) Na+ Nb
(2.4)
The similarity between two documents, di and dj, is then measured as follows,
where Ai and Aj are the sets of unique actors in di and dj, and Np is the number of
simsocial−network(di, dj) = ∑ aϵAi ∑ bϵAj w(a, b) /Np (2.5)
The difference between the named entity– and social network–based similarity methods is that the former considers only the co-occurrence of actors between two news articles; the latter uses edge weights in a social network, i.e., relations among actors of two news articles.
2.5.3.4 Hybrid similarity
The hybrid similarity between two documents, di and dj, is a linear combination of
the similarity scores of n methods:
simhybrid(di, dj) = n
∑
k=1
simk(di, dj)×αk (2.6)
Each method k outputs a score for the similarity between diand dj as simk(di, dj);
however, there is a need for the calibration of different methods. The parameter αkis
a significance coefficient for the method k (0 ≤ αk ≤ 1,
∑n
k=1αk = 1). We combine
lexical features, namely the vector space model, and social network, in the hybrid model by setting α values equal to 0.5.
Figure 2.4: The framework algorithm for story chain–discovery.
2.6
Evaluation
To the best of our knowledge, there is no ground truth for the evaluation of story-chain discovery algorithms. For this reason, we conduct (two) user studies2. The first compares several versions of the framework, by varying parameters, to set a guideline for use. The second compares the framework with three baseline methods.
2The materials that we are unable to give due to the limited space are provided in the details
web page (https://github.com/BilkentInformationRetrievalGroup/TUBITAK113E249 ); such as the text collection, output story chains, annotations, and details of statistical tests. Output chains and annotation scores of the second user study are also given in Appendix A.
2.6.1
Setup
2.6.1.1 News Collection
Chains are discovered in a news collection that includes 1,656 documents from the S¨ozc¨u newspaper (http://www.sozcu.com.tr ) between December 20, 2013 and March 11, 2014.
Structure of a news article in the collection consists of the following seven tags.
1. DOCNO. Unique document identifier that is composed of seven digits.
2. SOURCE. Name of the RSS feeder.
3. URL. URL address that publishes news article online.
4. DATE. Publication date of news article in the format of year/month/day.
5. TIME. Publication time of news article in the format of hour:minute:second.
6. HEADLINE. Headline of news article.
7. TEXT. Body text of news article.
The number of detected named entities are given in Table 2.1.
Table 2.1: Main statistics after detecting named entitites in our news collection.
Type Count
Documents 1656
Unique people 2890 Unique organizations 915 Unique locations 1152
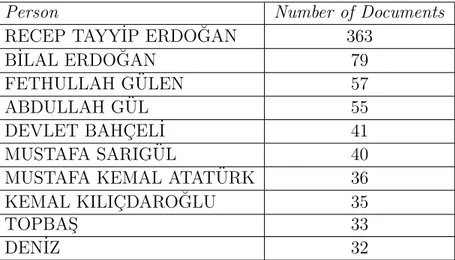
Tables 2.2, 2.3, and 2.4 list the most frequently seen 10 people, organizations, and locations respectively in our news collection. Although we manually resolve named entities, there are still some unresolved named entities like TOPBAS¸ and DEN˙IZ in Table 2.2. There are several people whose last names are TOPBAS¸. We can resolve full names by looking their previous and next tokens; but previous and next tokens are useless in 33 cases. Another problem is seen with DEN˙IZ. The tool that we use for named-entity detection mostly labels DEN˙IZ as a person name; but there are several objects including DEN˙IZ like DEN˙IZ P˙IYADE or DEN˙IZ FENER˙I. We need more advanced algorithms for named entity resolution in such cases.
Table 2.2: The most frequently seen 10 people in our news collection.
Person Number of Documents
RECEP TAYY˙IP ERDO ˘GAN 363
B˙ILAL ERDO ˘GAN 79
FETHULLAH G ¨ULEN 57
ABDULLAH G ¨UL 55
DEVLET BAHC¸ EL˙I 41
MUSTAFA SARIG ¨UL 40
MUSTAFA KEMAL ATAT ¨URK 36
KEMAL KILIC¸ DARO ˘GLU 35
TOPBAS¸ 33
DEN˙IZ 32
Frequency distributions of people, organizations, and locations are tested whether they fit into power-law distribution. We test if data follows power-law distribution with a goodness-of-fit test [33]. This test is based on a hypothesis that says data is generated from a power-law distribution and outputs a p-value that can be used to quantify the validity of hypothesis. If the p-value is close to 0 (more specifically smaller than 0.1), then hypothesis is rejected, which means data is not fit into a power-law distribution. If it is higher than 0.1, then data is plausible for fitting a power-law distribution. For frequency distributions of people, organizations, and
Table 2.3: The most frequently seen 10 organizations in our news collection.
Organization Number of Documents
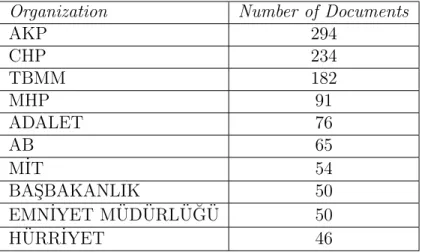
AKP 294 CHP 234 TBMM 182 MHP 91 ADALET 76 AB 65 M˙IT 54 BAS¸BAKANLIK 50 EMN˙IYET M ¨UD ¨URL ¨U ˘G ¨U 50 H ¨URR˙IYET 46
locations, p-values are obtained as 0.56, 0.95, 0.12 respectively. Thus, we can con-clude that frequency distributions of people and organizations are plausible to fit into power-law while frequency distribution of locations is barely plausible.
Three news cases (topics) are used as input in our user studies—Shahaf and Guestrin, and Zhu and Oates manually select 5 and 3 cases, respectively. The first case is the riots and protests against the Ukrainian government, demanding closer European integration, which started in November 2013, and referred to as Ukrainian Riots in this study. The second case is the trucks that were pulled over while going from Turkey to Syria by military police, claiming that they carry illegal ammuni-tion, in January 2014, referred to as Trucks Going to Syria. The last case is the domestic match-fixing allegations to the Fenerbah¸ce football team, started in July 2011, referred to as Allegations to Fenerbah¸ce. We select three input news articles representing the cases. The dates of the input documents for each topic are January 25, 2, and 17 of 2014, respectively.
Table 2.4: The most frequently seen 10 locations in our news collection.
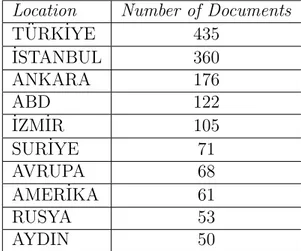
Location Number of Documents
T ¨URK˙IYE 435 ˙ISTANBUL 360 ANKARA 176 ABD 122 ˙IZM˙IR 105 SUR˙IYE 71 AVRUPA 68 AMER˙IKA 61 RUSYA 53 AYDIN 50 2.6.1.2 Annotation Program
User studies are conducted on an annotation program written in Java. Annotators are assigned to the same tasks.
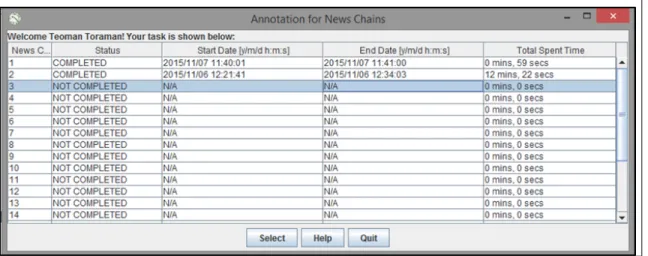
Annotation program consists of three different screens that are login, tasks and annotation screen. In order to continue labeling from the same state of annotation whenever annotators would like to do so, we assign each annotator a user name and password, which are asked in login screen. In the user study, each annotator is assigned to the same tasks. Annotators have to complete all news-chain-annotation tasks. A sample screen-shot for tasks screen is given in Figure 2.5. In tasks screen, annotators can see which tasks they have completed and how much time a particular task have taken. Annotators can also redo the annotation they have finished earlier.
Figure 2.5: A sample screen for the tasks screen of annotation program.
Annotators labels a particular news chain in annotation screen. A sample screen-shot for annotation screen is given in Figure 2.6. Annotation screen consists of two main panels. At the top panel, news articles in the selected news chain are listed chronologically. Each news article is given with its date and snippet of first 200 characters. Full text is visible in a pop-up window if news article is double-clicked. Input news article’s snippet is always bold and the sign of three consecutive stars is placed to its beginning to discriminate it from others. At the bottom of news articles, 6 questions are asked to annotators to assess the performance of given news chain. In this screen, annotation task is not completed unless all news articles are double-clicked and viewed in full text in order.
Figure 2.6: A sample screen from the annotation program. The current chain to be annotated, regarding Ukrainian Riots, is given at the top of screen. Annotators have to read all news articles in order, and then answer all questions.
2.6.1.3 Evaluation Measures
In similar studies, Shahaf and Guestrin [5] evaluate story chains according to rele-vance, coherence, and redundancy. Zhu and Oates [6] consider coverage, in addition to other measures. We also assess if previously unknown relations among news actors are disclosed by the chain—ability to disclose relations.
We give annotators five statements, and ask them to label to what extent they agree that (1) the news article is relevant to the input document marked with (***);
(2) the news chain covers different events related to the input; (3) there are no redundant documents in the chain; (4) the chain is coherent, that is, two adjacent documents are on the same topic (if they are not on the same topic, they are still related within the context of the input); (5) after reading the chain, new relations among news actors (people, organizations, and places) are learned.
All questions have text answers that are given in positiveness order, which are mapped to an integer scale of 2, 1, -1, and -2. The average of all annotators is taken for each question. The neutral choice of zero is not given to make annotators think more critically, and prevent selecting the first alternative choice that has the minimum cognitive requirements [34]. The last question has two answers, for having the ability to disclose relations or not, mapped to 1 and -1.
2.6.1.4 Annotators and Outlier Elimination
All tasks are assigned to 20 annotators in the first, and 12 in the second user study. Annotators are mostly graduate students, and a few undergraduates and faculty members. In order to estimate the consistency among annotators and detect outliers, we calculate Fleiss kappa [35] for each of the evaluation measures.
For the first user study, we have initially 27 annotators. We calculate Fleiss’ kappa with all annotators for each of the evaluation measures. Then, the kappa is recal-culated without each annotator. The scores obtained without individual annotators are given to the box-plot method. For each of the evaluation measures, the outlier, or the one with the maximum value if there is no outlier, given by the box-plot is removed from the annotators list. This results in 20 annotatorsShahaf and Guestrin employ 18 annotators; Zhu and Oates do not report the number of annotators. Even then, just for the annotations of the ability to disclose relations question, 6 of 20
an-with a post-survey. After removing outliers according to our heuristics, the kappa scores are increased for all evaluation measures.
2.6.1.5 Consistency Among Annotators
For the first user study, Fleiss’ kappa [35] score is 0.49 for relevance, 0.46 for coverage, 0.12 for redundancy, 0.30 for coherence, and 0.33 for ability to disclose relations. For the second, the same scores are 0.63, 0.34, 0.02, 0.23, and 0.18. Since both redun-dancy scores are below 0.20, meaning slight agreement among annotators, according to the interpretation of [36], we ignore the results of redundancy.
2.6.2
User Study 1: Varying Framework Parameters
2.6.2.1 Methodology
The first user study consists of 24 chains, obtained by the framework algorithm, with eight sets of parameters (versions A to H) on three topics. The design of this user study, given in Table 2.5, is based on the first four research questions asked in Introduction.
In the decisions, we compare the performance of two or more versions to answer their respective questions. Decisions are independent of each other, i.e. a decision result is not used in later decisions. For a fair evaluation, all parameters, except the one we want to gauge its effect on the algorithm, are kept the same. Based on the observations in preliminary experiments, fixed parameters are selected as all members, vector space model, and a window length of 15 days.
2.5: The design of User Study 1: Eigh t v ersions (A to H) of the framew ork algorithm. ALL : the all-mem b ers metho d, : so cial net w ork, VSM : the v ector space mo del. (Decision No.) h Question V ersion Sub-Metho ds in the F ramew ork Similarit y of Candidate with News Chain Similarit y Bet w een News Articles Windo w Length in Da ys 1) Is there an y er windo w length? A ALL VSM 7 B ALL VSM 15 C ALL VSM 30 2) Whic h metho d for candidate similarit y? B ALL VSM 15 D W eigh ted mem b ers VSM 15 3) What typ e of so cial net w ork? E ALL SN (all actors) 15 F ALL SN (top 500 actors) 15 4) Whic h metho d for do cumen t similarit y? B ALL VSM 15 E ALL SN (all actors) 15 G ALL Named en tit y 15 H ALL Hybrid (SN and VSM) 15
comprehend. In both user studies, we use a heuristic approach that searches for effective similarity-threshold values (θ) in a greedy fashion, by incrementing with a constant value. For the sake of simplicity, it keeps the chain lengths to 15 or fewer documents. The chain length decreases as the threshold values increase. For instance in the hybrid algorithm, we reduce the chain length from 23 to 15 by incrementing the cosine and social-network thresholds from 0.155 to 0.160, and from 0.115 to 0.120, respectively. On average, there are 12 news articles in a chain (median: 13, minimum: 4, maximum: 15).
2.6.2.2 Results of User Study 1
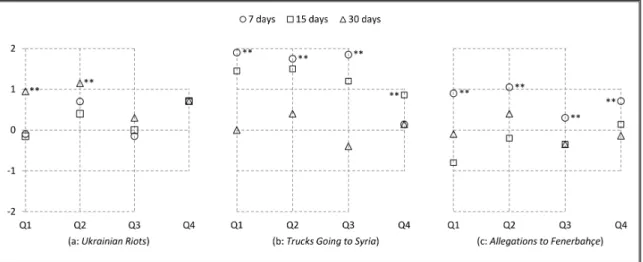
Decision 1: Is there any proper time-window length? While scanning with zigzagged search, we employ a sliding window that captures news articles. In Figure 2.7, we examine three window lengths of 7, 15, and 30 days.
We observe that the performance of varying the window length is case-dependent. For cases with a uniformly distributed number of documents (Trucks Going to Syria and Allegations to Fenerbah¸ce), the window should be small—7 days in both cases—in order to not miss news articles in a dense collection. For non-uniformly distributed number of documents (Ukrainian Riots), the window should be large (30 days), to catch news articles in a sparse collection.
Figure 2.7: Annotation results for Decision 1: Proper window length. Sub-figures (a, b, and c) are for the results of three topics. Question numbers are given in horizontal axis (Q1: relevance, Q2: covarage, Q3: coherence, and Q4: ability to disclose relations). The vertical axis represents an average score of annotation answers (scale is between -2 and 2 for Q1-Q3, -1 and 1 for Q4). For the pairwise comparison of the top two algorithms, “**” means that there is a statistically significant increase at the 1% level (p < .01), after the corresponding method is applied (see Table 2.6 for details). The same notation is used in the following figures.
In order to test whether a case is uniformly distributed, we apply the Shapiro-Wilks test [37] that states that, with small p-values, the collection does not follow a uniform distribution. In order to apply the test, we divide the collection into intervals of 20 days, and count the number of articles for each case. For Trucks Going to Syria, Allegations to Fenerbah¸ce, and Ukrainian Riots, p-values are 0.30, 0.50, and 0.10, respectively; Ukrainian Riots seems to be less uniformly-distributed than Trucks Going to Syria and Allegations to Fenerbah¸ce.
The Friedman test [38] is applied to the results of Figure 2.7; the details are given in Table 2.6. The Friedman test shows if there is a significant difference between at least two methods. This test is applied when there are more than two methods (groups), annotator answers are ordinal-categorical, annotations (observations) are paired and non-uniformly distributed. We use the one-tailed p-values instead of the
Table 2.6: The details of the Friedman test for Decision 1 with respect to Figure 2.7. The Friedman tests p-values are listed with Chi-square values. “Pw.d” is the mean difference between the top two algorithms. The p-values of the pairwise comparisons of the top two algorithms are marked in Figure 2.7. The same notation is used in the following tables.
Q: measure Ukrainian Riots Trucks Going to Syria Allegations to Fenerbah¸ce
p Chi. Pw. d p Chi. Pw. d p Chi. Pw. d
Q1: relevance <0.01 16.93 1.05 <0.01 29.66 0.55 <0.01 23.35 1.00 Q2: coverage <0.01 9.46 0.45 <0.01 28.17 0.25 <0.01 19.73 0.65 Q3: coherence - - 0.30 <0.01 29.38 0.65 0.012 8.70 0.65 Q4: disclose relations - - - 0.011 8.93 0.72 <0.01 14.71 0.57
than the effectiveness of the others, instead of them being equal. All statistical tests in this study are conducted in the same manner.
In order to have pairwise comparisons, we further apply the post-hoc test proposed by Conover [39], which is valid if the Friedman test indicates any significance. From Figure 2.7 to 2.10, the Conover test results are given for only the top two algorithms, since we want to see the significance of the winner. The scores of the Conover tests are provided in the details web page.
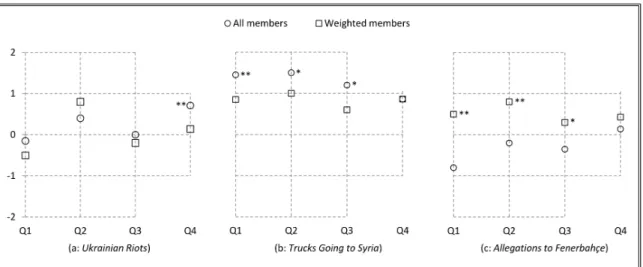
Decision 2: Which method for candidate similarity works better? The effective-ness of the all-members and weighted-members methods depends on the fresheffective-ness of the input, as depicted in Figure 2.8. An input is fresh if it is close to the beginning of the topic. Note that the input documents of all cases are from January 2014. The Trucks Going to Syria event starts in January 2014, and Ukrainian Riots in Novem-ber 2013. Allegations to Fenerbah¸ce is relatively old, beginning in July 2011; the weighted-members method works better for this case, since it gives lower importance to old members of the chain including the input that is not fresh. For other cases that we have relatively fresher inputs, the all-members method is more effective in
terms of relevance, coherence, and ability to disclose relations, since it gives the same importance to all members of the chain including the fresh input. Our expectation of weighted members providing more coherent chains fails in some cases.
Figure 2.8: Annotation results for Decision 2: all members vs. weighted members. Note that “*” means that there is a statistically significant increase at the 5% level (p < .05), after the corresponding method is applied (see Table 2.7 for details). The same notation is used in the following figures.
The Wilcoxon signed-ranks test [40] is applied to the results of Figure 2.8 to see any significant difference between algorithms; the details are given in Table 2.7. This test is used when there are two methods, annotator answers are ordinal-categorical, and annotations are paired and non-uniformly distributed.
Decision 3: What size of social network works better? The results of using all news actors and the top 500 most important ones, in terms of frequency, are given in Figure 2.9. We observe that using all news actors—approximately 5,000—is more effective for Trucks Going to Syria, which has more number of minor actors that are observed with less frequency in the collection. For two cases with more number of major actors (Allegations to Fenerbah¸ce and Ukrainian Riots), using the top 500
Table 2.7: The details of the Wilcoxon test for Decision 2 with respect to Figure 2.8, where “d” is mean difference, “p”, “Z,” and “r” are scores of the Wilcoxon test. The same notation is used in the following similar tables when the Wilcoxon test is applied.
Q: measure Ukrainian Riots Trucks Going to Syria Allegations to Fenerbah¸ce d p Z r d p Z r d p Z r Q1: relevance 0.35 0.074 -2.46 -0.93 0.60 0.003 -2.75 -0.92 1.30 < 0.001 -3.72 -1.03 Q2: coverage 0.40 - - - 0.50 0.011 -2.29 -0.66 1.00 < 0.001 -3.12 -0.99 Q3: coherence 0.20 - - - 0.60 0.033 -1.88 -0.54 0.65 0.020 -2.05 -0.68 Q4: disclose relations 0.57 0.003 -2.75 -0.97 - - - - 0.29 - -
-the effectiveness scores, due to possible inclusion of redundant ones. The Wilcoxon test is applied to the results of Figure 2.9; the details are given in Table 2.8.
Figure 2.9: Annotation results for Decision 3: All news actors vs. top 500 news actors. See Table 2.8 for details of statistical tests.
Decision 4: Which method for document similarity works better? The results of four similarity methods are given in Figure 2.10. The success of the hybrid model, which employs both lexical features and news actors, is case dependent. For the cases
Table 2.8: The details of the Wilcoxon test for Decision 3 with respect to Figure 2.9. Q: measure Ukrainian Riots Trucks Going to Syria Allegations to Fenerbah¸ce d p Z r d p Z r d p Z r Q1: relevance 0.45 0.013 -2.23 -0.91 1.40 < 0.001 -3.29 -0.88 0.90 0.002 -2.88 -0.91 Q2: coverage 0.25 0.036 -1.80 -0.68 1.05 0.004 -2.65 -0.73 1.20 < 0.001 -3.29 -0.91 Q3: coherence 0.20 - - - 1.75 < 0.001 -3.29 -0.75 1.40 < 0.001 -3.19 -0.85 Q4: disclose relations 0.43 0.009 -2.36 -0.96 0.14 - - - 0.71 0.005 -2.58 -0.97
with a relatively higher number of major actors (Ukrainian Riots and Allegations to Fenerbah¸ce), the effectiveness of the vector space model is increased by the hybrid model—the only exception is ability to disclose relations of Allegations to Fenerbah¸ce. For the case with a relatively higher number of minor actors (Trucks Going to Syria), the effectiveness of the vector space model is not increased by employing news actors.
Figure 2.10: Annotation results for Decision 4: Similarity methods. See Table 2.9 for details of statistical tests.
Table 2.9: The details of the Friedman test for Decision 4 with respect to Figure 2.10. Q: measure Ukrainian Riots Trucks Going to Syria Allegations to Fenerbah¸ce
p Chi. Pw. d p Chi. Pw. d p Chi. Pw. d
Q1: relevance <0.01 56.02 1.85 <0.01 35.25 0.05 <0.01 37.05 0.20 Q2: coverage <0.01 54.73 1.45 <0.01 23.96 0.15 <0.01 35.39 0.25 Q3: coherence <0.01 41.79 1.40 <0.01 19.20 0.05 <0.01 25.70 0.35 Q4: disclose relations <0.01 52.42 0.29 <0.01 19.19 0.43 <0.01 25.03 0.43
domain [8, 41]—or only social networks performs poorly. However, the named en-tity method is more effective than the other methods, in the case of Allegations to Fenerbah¸ce. This can be explained by the fact that this case mostly involves the actor, Aziz Yıldırım, who is the club chairman, and not involved in any other case in the given collection. When the case involves many actors, as in Ukrainian Riots and Trucks Going to Syria, we observe that the effectiveness of using a social network, revealing relations among news actors, is higher than the effectiveness of using only named entities. The Friedman test is applied to the results of Figure 2.10; the details are given in Table 2.9.
2.6.2.3 Recommendations
Based on the results of the first user study, for parameter tuning, we recommend the use of:
1. Dynamic window length: When news articles are uniformly distributed, the window should be small. It should be large for non-uniformly distributed cases.
works better for inputs that are not fresh, while the all-members method is more effective with relatively fresher inputs.
3. Variable social-network size: For improving efficiency, the size of a social net-work can be relatively small for cases with a higher number of major actors.
4. Case-dependent document-similarity method : Lexical features based on the vector space model are more effective in measuring similarity for cases with minor news actors. When a few number of major actors are involved, the performance of news actor methods can be competitive with the vector space model. The effectiveness of the vector space model and news actors can be improved by combining them in a hybrid model.
2.6.3
User Study 2: Comparison with Baselines
2.6.3.1 Methodology
For comparison, we need to select a representative version of our framework algo-rithm. We can apply our fine-tuning recommendations on each topic; however, to provide a fair evaluation, we use the same version. Since our contribution is to em-ploy news actors and zigzagged search for story-chain discovery, we choose among versions that employ news actors (named entity, social network, and hybrid). Since using only named entities or only social networks has poor performance, we compare the hybrid version with three baselines—referred to as hZZ: Hybrid and Zigzagged Search. The design of User Study 2 is given in Table 2.10.
The first baseline is a simple TDT [7] approach, which examines all documents once, and adds a document to the chain by measuring the cosine similarity with the seed, i.e. input document. The second is an adaptive TDT [42] approach, which is
Table 2.10: The design of User Study 2: Comparing our framework algorithm, hZZ : Hybrid and Zigzagged Search, with three baselines, sTDT : Simple TDT, aTDT : Adaptive TDT, GN : Google News. Method Name Scanning the Collection Similarity of Candidate with News Chain Similarity Between News Articles Window Length in Days sTDT
One pass with no window
Only with
input document VSM -aTDT
One pass
with window ALL VSM 15
GN Unknown
hZZ
Zigzagged
with window ALL
Hybrid
(SN & VSM) 15
the event description after processing each window. This method is similar to our framework, but without using zigzagged search and news actors. In both methods, chain lengths are set to 15 or fewer documents.
The third baseline is the search result list of Google News (http://news.google.com). The collection of Google News is a superset of our collection, since it includes S¨ozc¨u news. The title of the input document is given as a query string. For a fair compar-ison, we set the range of documents starting from the input date to the end date of our collection, and create a chain with the result list sorted in time. In Allegations to Fenerbah¸ce, since the list includes 40 documents (more than 15), we select (11) equally spaced news articles.
2.6.3.2 Results of User Study 2
The average scores are given in Table 2.11. Scores for each annotator are given in Appendix A. Also, output story chains that are obtained by hZZ are listed in Appendix A.
between at least two methods. Methods are further pairwise compared with the Conover post-hoc test in Table 2.13. In order to measure the effect size of pairwise comparisons, we apply Cohen’s d-test [43]. We highlight cells of Table 2.13 with dark gray if there is a large effect size, and light gray if medium; it remains white if it has a small effect size. The Cohen’s d values and confidence intervals are provided in the details web page.
In total, there are 72 pairwise comparisons between the methods. We have 36 pairwise comparisons in the rows of hZZ, which uses zigzagged search and a social network of news actors. The results show that it has statistically significantly higher relevance (67% of pairwise comparisons of hZZ ), coverage (56% of pairs), coherence (78% of pairs), and ability to disclose relations (44% of pairs). We observe that our framework can be helpful to news consumers, since hZZ significantly improves effectiveness with respect to baselines, in 61% of pairs (22 of 36 pairs); in the remain-der, none of the baselines significantly outperforms our method. All of these pairs have medium (4 of 22 pairs) or large (18 of 22) effect sizes, according to the thresh-olds of Cohen [44]. Furthermore, we have medium effect sizes in two non-significant additional pairs.
2.7
Discussion
2.7.1
Practical Considerations
We employ the hZZ algorithm in the Bilkent News Portal (http://newsportal. bilkent.edu.tr ), which aggregates Turkish news articles from various resources [29]. We integrate three social-network versions that include different numbers of news actors, by transforming them into matrices of news actors that involve edge weights.
able 2.11: The a v erage scores of all annotators for sTDT : Simple TDT, aTDT : Adaptiv e TDT, GN : Go ogle News, hZZ : and Zigzagged. The metho d(s) with the highest score is mark ed as b old. Q: me asur e Ukrainian Riots T ruc ks Going to Syria Allegations to F enerbah¸ ce sTDT aTDT GN hZZ sTDT aTDT GN hZZ sTDT aTDT GN hZZ Q1: relevanc e 1.25 -1.25 0.33 1.67 -0.83 0.83 0.67 1.08 -1.50 -0.83 0.92 1.00 Q2: c over age 1.42 -0.33 0.83 1.67 -0.25 0.83 1.17 1.25 -1.00 -0.83 0.67 0.67 Q3: c oher enc e 0.08 -1.25 0.08 1.33 -1.33 0.33 -0.58 0.42 -1.75 -0.83 -0.08 0.00 Q4: disclose relations 0.83 0.00 0.83 0.83 -0.17 0.50 0.83 0.83 -0.33 0.00 0.83 0.67
Table 2.12: The details of the Friedman test with respect to Table 2.11. Q: measure Ukrainian Riots Trucks Going to Syria Allegations to Fenerbah¸ce
p Chi. p Chi. p Chi.
Q1: relevance <0.01 25.33 <0.01 20.68 <0.01 28.21 Q2: coverage <0.01 17.35 <0.01 17.28 <0.01 24.38 Q3: coherence <0.01 20.76 <0.01 15.72 <0.01 25.07 Q4: disclose relations <0.05 10.71 <0.01 12.00 <0.01 14.56
page of the portal, where the link of the news-chain discovery tool is provided in the left menu. The bottom screen is where users enter parameters for the algorithm, such as the input document or similarity threshold values.
We observe that mining a large collection can be time-consuming, as experienced in [45], and [15]. To overcome this scaling problem, we ask the user to enter some keywords about the input document, and hence get a subset of news articles to be processed. A similar approach is also applied in the related studies.
Quality of output chains is input-dependent: selecting low similarity thresholds can result in long and noisy chains. Different input documents may require different parameter values.