ANISOTROPY SENSITIVITY
OF AN ACOUSTIC
LENS WITH SLIT APERTURE
A. Atalar, Bilkent University, Ankara, Turkey
06533
I.
Ishikawa, Y. Ogura,
and
K. Tomita, Hitachi Construction Machinery Co., Japan
ABSTRACT
A
conventional spherical acoustic lens is modified by restrict- ing its aperture in the form of a slit to provide directional sensitivity. The spacing between the two parallel absorbing sheets forming the slit is adjustable to obtain varying slit widths. The resulting lens can be used in conjunction withV(2)
method to obtain leaky wave velocities of the sample under investigation as a function of direction. The theoreti- calV(
2 ) analysis of the lens involves a two-dimensional inte- gral rather than one-dimensional integral of the conventional lens. Single crystal anisotropic materials are chosen as test samples. Reflection coefficients for anisotropic single crystals of given surface cut and orientation are calculated. Numer- ically evaluated V ( 2 ) curves are used to deduce the surface wave velocity of the object for the given orientation. This iscompared with the surface wave velocity directly calculated from the elastic parameters of the object. Results show the compromise between signal-to-noise ratio and angular reso- lution as the slit width is varied. V ( 2 ) measurement results of a slitted lens are presented to be compared with calculated curves. The new lens is used to measure the acoustic velocity on the (001) surface of GaAs along varying directions with differing slit widths.
Introduction
Line-focus-beam (LFB) lens has been successfully used in de- termining the directional leaky wave velocities of anisotropic materials [l]. Although a very accurate determination can be made, the lateral resolution of the
LFB
lens is very poor and it can not be used for imaging. A number of directional acoustic lens geometries is proposed for the purpose of re- moving the resolution limitation ofLFB
lens. Among them are bow-tie transducer [2], shear-wave transducer [3], two transducer lens [4] and butterfly transducer [5]. However, these lenses suffer from diffraction effect in the buffer rod and provide only a limited directionality, not sufficient for an accurate measurement.If
directionality is introduced in the lens pupil plane, the diffraction in the lens rod plays no role. A slit aperture can be formed easily and it provides suf- ficient directionality (61. In this paper we present our results for a slit aperture lens. First the geometry and fabrication method of the lens is explained.A
theoretical analysis of the lens is given. Simulations are performed to determine the1051-0117/93/0000-0613
$4.00
0
1993
IEEE
maximum slit size that would result in an acceptable mea- surement accuracy. The experimental results are compared with measurements.
Geometry
of
the Slit Aperture Lens
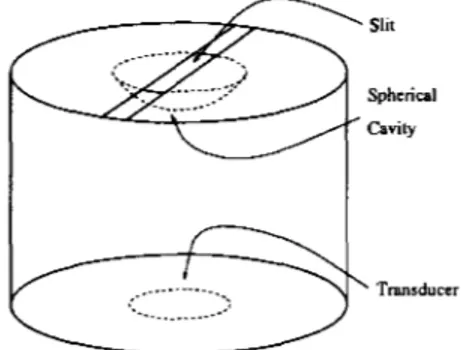
Fig.1 shows the geometry of the slit aperture lens. It con- sists of a conventional acoustic lens with a specially designed aperture in front [7]. The slit is formed by two parallel edges of a 50pm thick teflon sheets. The distance between the ab- sorbing sheets determine the slit width. The sheets forming the slit is fixed to a cap that can be fitted to the face of a conventional acoustic lens. The cap also allows a controlled amount of rotation for measurements in different directions.Spherical Cavity
I
Figure 1: Geometry of the slit aperture lens
V ( 2 )
response
of
the slit
aperture
lens
A diffraction corrected ray theory approach for the slit lens was given earlier [8]. Although the ray theory gives very valuable physical insight into the problem, it can not handle the problem correctly near the focus point and it gives only an approximate solution. Here, we will present a angular spectrum approach for the same problem. Consider theV ( 2 )
integral in its most general form [9] as given below.
GaAs
(100)
s=O.la
-Odegree
15 degrees
30
degrees
-40.0
‘
-300.0
-200.0
-100.0
0.0
100.0
Z
(microns)
Figure 2: Calculated
V ( 2 )
curves for GaAs (001) surface at various directionsHere,
R()
is the reflection coefficient of an anisotropic ma- terial as a function of incidence direction,p ( )
is the pupil function at the lens plane, U:() is the incident acoustic pres-sure field at the back focal plane of the acoustic lens. For a slit lens the pupil function can be written as
(2) 1 if (51
<
s/2 and 5’+
yz5
a/20 otherwise
where s is the slit width, and a is the lens aperture diameter. Note that, the apodization effect caused by the matching layer on the lens can be included in the function U:(). Since the transducer is circularly symmetric, u : ( I , y ) = U:(.) and
it is possible to take the given two-dimensional integral in two steps. In polar coordinates the integral becomes
~ ( 2 ) =
J J
r ~ ( r / f ,4)
p Z ( r , 4)[U:(r)lZexp(2k0241 - (r/f)’) dr$ dr (3)
where
R()
andP ( )
are written in polar coordinates(r,4)
rather than in rectangular coordinates (z,y). Let us define an effective reflection coefficient,Re
asSince the integration in the
4
direction is carried out,R,
is a function of T only. With this definition V ( 2 ) integralreduces to a one-dimensional integral:
V ( Z )
=LQ’’
~ , ( r / ~ ) [ 1 L : ( r ) l 2 e x p ( 2 k o ~ ~ 1 - o 2 ) dr J U(5)
This is a considerable simplification in the numerical proce- dure, since calculation of V ( 2 ) at different 2 points can be done with a one-dimensional integral once the
Re
is calcu- lated by a two-dimensional integral.Calculation of the reflection coefficient at a liquid-anisotropic solid interface is not a trivial procedure, since an analytic ex- pression is hard to obtain. Typically numerical methods are utilized to calculate it [lo, 11, 12). In its most general form the anisotropic solid is represented by its 21 elastic constants,
so materials with arbitrary orientation can be handled with transformation of the stiffness matrix by multiplication with the Bond matrices.
0.0
-1
0.0
5-
E.
-20.0
9
-30.0
GaAs
(111) s=O.la
-
Odegree
10 degrees
20
degrees
I \-40.0
-300.0
-200.0
-100.0
0.0
100.0
Z
(microns)
Figure 3: Calculated
V ( 2 )
curves for GaAs (111) surface at various directionsSimulation
Results
We have calculated the V ( 2 ) response of a slit aperture lens with following parameters: Operation frequency 200 MHz, lens cavity radius of 500,um, lens aperture diameter (U) of
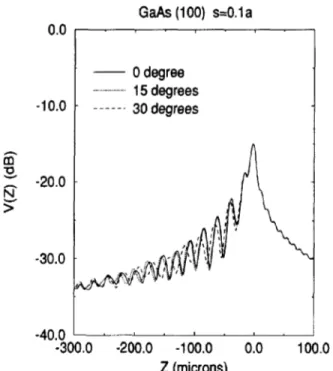
870pm, transducer radius 435pm, lens buffer rod length 10mm. Slit width, s, was kept as a variable parameter. Various sin- gle crystal solids are considered. Fig.2 shows the calculated
V ( 2 ) curves for a GaAs substrate (001) surface. The differ- ent curves are for different orientations of slit with respect t o
crystal symmetry axes. For a slit width equal to one tenth of the lens aperture, the loss in the signal level is about 15 dB. Fig. 3 depicts a similar set of V ( 2 ) curves for the (111) sur- face of GaAs. The calculations are repeated for different slit widths.
It
is apparent that as the slit width is increased, the resulting V ( 2 ) curves converge to each other for differentTable 1: Calculated wave velocities versus actual velocities with Slit Aperture Lens (s=O.la)
orientations of an anisotropic crystal. As the slit width is re- duced there is a loss in the signal output level, but different orientations have different responses.
Table 1 summarizes the simulation results for a slit lens with s = 0 . 1 ~ . Various single crystals with different cuts along various propagation directions are considered. To be able t o determine the accuracy of the measurements, the follow- ing method is utilized: The
V ( 2 )
responses are calculated from the known elastic parameters of the materials. These responses are then input to the conventional velocity extrac- tion algorithm usingFFT
method 111. The extracted veloc- ities are then compared with the velocities computed from the elastic parameters directly. Table 1 shows the percent- age difference between the V ( 2 ) extracted velocity and the actual velocity as absolute error. The simulations are done for a slit lens with s = 0 . 1 ~ . For most materials the er- ror is about 1%. Note that repeatability of the experimentsGaAs (1 11) 2700.0 h 2600.0
e
E 4%8
v‘B
-
>”
2500.0-
Actual ~ s=0.025a -. . s=0.05 a 2400.0 0.0 10.0 20.0 30.0 Direction (degrees)Figure 4: Actual and estimated velocities on GaAs (111) surface as a function of direction under varying slit widths
can be much better than this value.
A
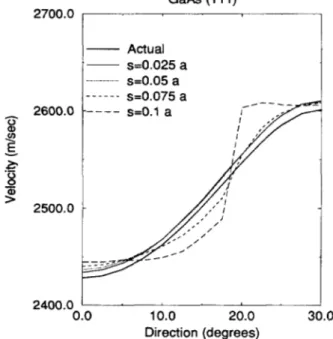
similar error figure is found for a LFB lens using the same accuracy analysis, although much higher accuracy figures have been claimed in the literature.Fig. 4 shows the results of simulations for varying slit widths for GaAs (111) surface. In the same figure the actual SAW velocity is indicated as a function of propagation direction. For slit widths less than 5% of the aperture size, the ex-
tracted velocities follow the actual velocity curve closely. But, as the slit size is increased, the error between the esti- mated and actual velocities increase very rapidly. Actually, when the slit size is greater than 20% of aperture size, the estimates are quite unreliable.
2900.0 2800.0 h 0 a fn
2
>”
v 0 2700.0.-
0 0-
2600.0GaAs
(001)-
Actual os=0.2 a s 4 . 4 a 0 I 2500.0Direction (deg)
Figure 5: Actual and measured velocities on GaAs (001) surface as a function of direction with varying slit widths
Experimental Results
Fig. 5 shows the extracted velocity information from the measured V ( 2 ) data for the (001) surface of GaAs as a func- tion of propagation direction. Measurements were performed with a slit lens operating at 200 MHz. Slit width is varied within practical limits to see the resulting effect. Unfortu- nately, the low level of signal prohibited the use of slit widths less than 0.1 a. In the same figure the velocity of surface waves calculated from the published elastic parameters [13] of GaAs is also shown. Note the existence of Pseudo surface waves along certain directions. This complicates the prob-
lem even further, since there are two excited modes along these directions. Although the general shape of the velocity curve is approached, the accuracy is not very good with the slit widths utilized in the experiments.
Images obtained by the slit lens indicate that there is a slight loss of resolution in a direction orthogonal to the slit direc- tion. Nevertheless, it is still possible to obtain acceptable quality images.
Conclusions
Slit lens provides a directional measurement capability with- out sacrificing much the good resolution performance. There is a trade-off between the measurement accuracy and signal- to-noise ratio obtained by changing the slit width. The the- oretical results indicate that slit width must be a t most 5 to 10% of the lens aperture t o provide an accurate determina- tion of the surface wave velocity. However, reduced signal- to-noise ratio may inhibit use of such small slit widths. With larger slit widths a directionality is obtained, but the accu- racy is not as good as the accuracy that can be obtained with a line-focus-beam lens. The accuracy of the measure- ments can be further threatened if more than one surface wave mode - such as pseudo surface waves - exists along
the considered direction. The latter is a problem also for the LFB lens.
One must note that beam walk-off that occurs in anisotropic crystals may seriously reduce the signal output from the slit lens along some directions, especially when the material un- der investigation has high anisotropy. If the excited beam on the surface experiences a walk-off, it may miss the narrow aperture of the slit lens. On the other hand, the same effect is not a significant problem for the LFB lens.
Acknowledgment
The work of first author is supported by Turkish Scientific and Technical Research Council, TUBITAK.
References
J.
Kushibiki and N. Chubachi “Material characteriza- tion by line-focus-beam acoustic microscope,” IEEETrans. Sonics Ultrason., vol. 32, pp. 189-212, 1985. D.A. Davids and H.L. Bertoni “Bow-tie transducers for measurement of anisotropic materials in acoustic mi- croscopy,” in Proc. of
IEEE
1986 Ultrasonics Sympo-sium, pp. 735-740, 1986.
B.T. Khuri-Yakub and C-H. Chou “Acoustic micro- scope lenses with shear wave transducers,” in Proc. of
IEEE 1986 Ultrasonics Symposium, pp. 741-744, 1986.
J.A.
Hildebrand andL.K.
Lam “Directional acoustic microscopy for observation of elastic anisotropy,” Appl. Phys. Lett., vol. 42, pp. 413-415, 1983.H.
Kanai,N.
Chubachi, andT.
Sannomiya “Microde- focusing method for measuring acoustic properties us- ing acoustic microscope,” IEEE Trans. Ultrason. Ferro.Freq. Cont., vol. 39, pp. 643-652, 1992.
D.A. Davids, P.Y. Wu, and D. Chizhik “Restricted aperture acoustic microscope lens for rayleigh wave imaging,” Appl. Phys. Lett., vol. 54, pp. 1639-1641, 1989.
I. Ishikawa.
“U.S.
patent 5,060,201,”.D.
Chizhik and D.A. Davids “Applications of diffraction-corrected ray theory to the slot lens in acous- tic microscopy,”J .
Acoust. Soc. Am., vol. 92, pp. 3291- 3301, 1992.A. Atalar “An angular spectrum approach to contrast in reflection acoustic microscopy,” J . Appl. Phys., vol. 49, pp. 5130-5139, 1978.
M.G. Somekh, G.A.D. Briggs, and C. Ilett “The effect of elastic anisotropy on contrast in the scanning acoustic microscope,” Philosophical Magazine A , vol. 49, p. 179, 1984.
0. Arikan, E. Teletar, and A. Atalar “Reflection coefi- cient null of acoustic waves at a liquid-anisotropic-solid interface,”
J .
Acoust. Soc. Am., vol. 85, pp. 1-10, 1989. A.H. Nayfeh “Elastic wave reflection from liquid- anisotropic substrate interfaces,” Wave Motion, vol. 14, pp. 55-67, 1991.B.A. Auld. Acoustic Fields and Waves in Solids, vol- ume 1. Wiley, New York, 1973.


