COMMON RISK FACTORS IN THE RETURNS OF STOCKS
TRADING IN THE ISTANBUL STOCK EXCHANGE
A Master’s Thesis
By
MUHAMMED AKDAĞ
Department of
Management
Ġhsan Doğramacı Bilkent University
Ankara
COMMON RISK FACTORS IN THE RETURNS OF STOCKS
TRADING IN THE ISTANBUL STOCK EXCHANGE
Graduate School of Economics and Social Sciences
of
Ġhsan Doğramacı Bilkent University
by
MUHAMMED AKDAĞ
In Partial Fulfilment of the Requirements for the Degree of
MASTER OF SCIENCE
in
THE DEPARTMENT OF
MANAGEMENT
ĠHSAN DOĞRAMACI BĠLKENT UNIVERSITY
ANKARA
I certify that I have read this thesis and have found that it is fully adequate, in scope and in quality, as a thesis for the degree of Master of Science in Management.
--- Assoc. Prof. Aslıhan Altay-Salih Supervisor
I certify that I have read this thesis and have found that it is fully adequate, in scope and in quality, as a thesis for the degree of Master of Science in Management.
--- Prof. Kürşat Aydoğan
Examining Committee Member
I certify that I have read this thesis and have found that it is fully adequate, in scope and in quality, as a thesis for the degree of Master of Science in Management.
---
Assoc. Prof. Kıvılcım Metin Özcan Examining Committee Member
Approval of the Graduate School of Economics and Social Sciences
--- Prof. Erdal Erel
iii
ABSTRACT
COMMON RISK FACTORS IN THE RETURNS OF STOCKS TRADING IN THE ISTANBUL STOCK EXCHANGE
Akdağ, Muhammed
M.S., Department of Management Supervisor: Assoc. Prof. Aslıhan Altay-Salih
June 2011
This study investigates the stocks trading in the Istanbul Stock Exchange for the years between 1997 and 2010 in an attempt to determine the common risk factors that capture the variation in stock returns. Time-series regressions are conducted to test the performance of the Fama & French (1993) three-factor model on a sample of 201 non-financial firms. Furthermore, an additional factor (FIP) is introduced and used to measure the effect of foreign investor participation on the common variation in stock returns in the Turkish market. Finally, considering the two financial crises in 2001 and 2008, different results in the sub-periods are examined; and structural break tests are performed using the dummy variable technique and Chow’s (1960) methodology. The results prove that three-factor model is superior to the Capital Asset Pricing Model (CAPM) although the effects of size and book-to-market factors are weak. The excess return on the market portfolio is found to be statistically significant for all model specifications and in each sub-period. The inclusion of the foreign investor participation factor improves the explanatory power of the Fama & French model only slightly; thus it has relatively less impact on the Turkish stock market despite its statistical significance. No structural break is determined for the crisis breakpoints for almost all of the portfolios; thus the model is proven to be robust.
iv
ÖZET
İSTANBUL MENKUL KIYMETLER BORSASINDA İŞLEM GÖREN HİSSE SENETLERİNİN GETİRİLERİ ÜZERİNDEKİ ORTAK RİSK
FAKTÖRLERİ
Akdağ, Muhammed Yüksek Lisans, İşletme Bölümü Tez Yöneticisi: Doç. Dr. Aslıhan Altay-Salih
Haziran 2011
Bu çalışmada Ġstanbul Menkul Kıymetler Borsası’nda 1997-2010 yılları arasında işlem gören hisse senetleri incelenmiş ve hisse senedi getirilerini açıklayan ortak (sistematik) risk faktörlerinin belirlenmesi amaçlanmıştır. Zaman serisi analiz yöntemi kullanılarak Fama & French (1993) üç faktör modelinin performansı mali sektöre dahil olmayan 201 firma üzerinde test edilmiştir. Ayrıca ilave bir risk faktörü (FIP) vasıtasıyla yabancı yatırımcıların piyasaya katılımının hisse senedi getirilerinin değişkenliği üzerindeki etkisi araştırılmıştır. Son olarak 2001 ve 2008 yıllarındaki finansal krizler göz önüne alınarak alt dönemler incelenmiş; dummy değişken tekniği ve Chow(1960) metodu kullanılarak yapısal kırılma testleri gerçekleştirilmiştir. Sonuçlar üç faktör modelinin Sermaye Varlıkları Fiyatlama Modeli’nden (SVFM) daha başarılı olduğunu; bununla birlikte piyasa değeri ve defter değeri/piyasa değeri etkilerinin zayıf olduğunu göstermiştir. Tüm hisseleri içeren piyasa portföyünün artık getirisinin bütün modeller ve tüm alt dönemler için istatistiki açıdan anlamlı bir faktör olduğu bulunmuştur. Yabancı yatırımcı katılım faktörü Fama & French modelinin sonuçlarını çok az geliştirmiştir; dolayısıyla bu faktör istatistiki açıdan anlamlı olmasına rağmen Türkiye piyasasında nispeten zayıf bir etkiye sahiptir. Neredeyse hiçbir portföy için yapısal kırılmaya rastlanmamıştır ve böylece modelin güvenilir olduğu gösterilmiştir.
Anahtar Kelimeler: Varlık fiyatlandırması, Fama-French modeli, Ġstanbul Menkul Kıymetler Borsası
v
ACKNOWLEDGMENTS
I owe my deepest gratitude to my supervisor Assoc. Dr. Aslıhan Altay-Salih for her guidance during my studies. Without her stimulating suggestions, encouragement and tolerance; it would not be possible to complete this thesis.
It is a pleasure to thank Prof. Dr. Kürşat Aydoğan who has been a role model for
me as a great instructor, researcher and mentor.
I am grateful to Assoc. Dr. Kıvılcım Metin Özcan for her sincerity, support and
assistance since the beginning of my undergraduate studies till my graduation from the graduate school.
I am thankful to Asst. Dr. Deniz Yenigün for teaching me the R language and
encouraging me for conducting interdisciplinary research in the future.
I am also indebted to my dear friend Haldun Topçuoğlu who helped me in
understanding the niceties of computer programming.
Last but not least, I would like to thank my family who has been with me at all times when I needed support. Their unconditional love and trust has always made me feel strong and secure. Without them, it would have been impossible for me to achieve any accomplishment throughout my life.
vi TABLE OF CONTENTS ABSTRACT ... iii ÖZET... iv ACKNOWLEDGMENTS ... v TABLE OF CONTENTS ... vi
LIST OF TABLES ... viii
LIST OF FIGURES ... ix
CHAPTER I: INTRODUCTION ... 1
CHAPTER II: ISTANBUL STOCK EXCHANGE AND THE FINANCIAL CRISES ... 7
CHAPTER III: LITERATURE REVIEW ... 13
3.1 The CAPM ... 13
3.2 Cross-section of Expected Returns ... 15
3.3 Common Variation in Average Returns ... 18
3.4 International Evidence – Developed Markets ... 22
3.5 International Evidence – Emerging Markets ... 23
3.6 Evidence from the Turkish Stock Market ... 26
CHAPTER IV: DATA & METHODOLOGY ... 34
4.1 Data ... 34
4.2 Portfolio Formation ... 36
4.3 Methodology ... 39
CHAPTER V: EMPIRICAL RESULTS ... 42
5.1 Descriptive Statistics and Informal Tests... 42
5.2 Time-series Regressions and Structural Break Tests ... 48
5.2.1 The one-factor model ... 48
vii
5.2.3 Fama & French three-factor model ... 52
5.2.4 Cross-sectional implications ... 57
5.2.5 The foreign investor participation and the four-factor model ... 60
5.2.6 Robustness checks ... 61
CHAPTER VI: CONCLUSION ... 68
SELECT BIBLIOGRAPHY ... 71
APPENDICES ... 76
A. Jensen’s alpha for additional model specifications ... 76
B. Time-series regression results for sub-periods ... 77
viii
LIST OF TABLES
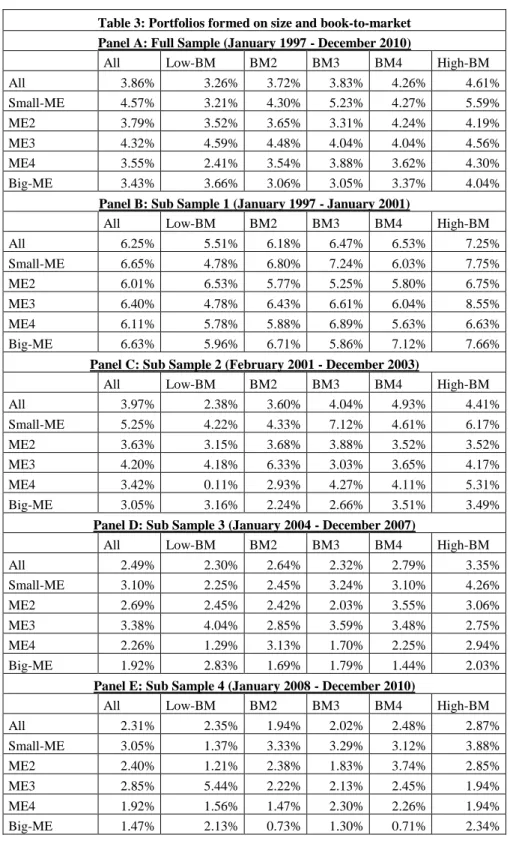
1. Portfolios formed on size ... 45
2. Portfolios formed on book-to-market ... 45
3. Portfolios formed on size and book-to-market ... 46
4. Descriptive statistics for dependent variables ... 47
5. Descriptive statistics for independent variables ... 47
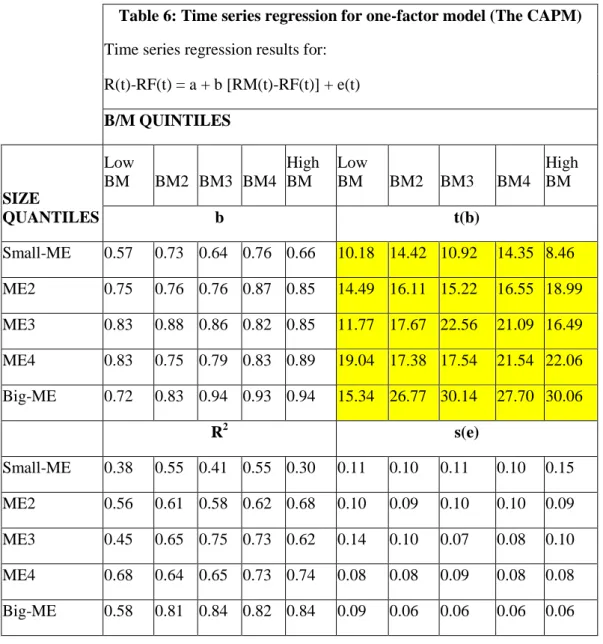
6. Time series regression for one-factor model (The CAPM) ... 54
7. Time series regression for two-factor model (SMB & HML) ... 55
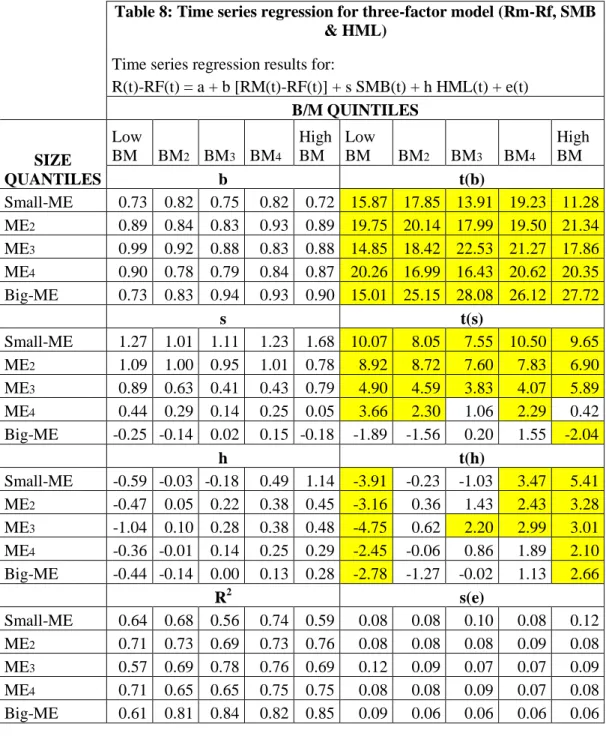
8. Time series regression for three-factor model (Rm-Rf, SMB & HML) ... 56
9. Jensen’s alphas ... 59
10. GRS F-test results ... 59
11. Time series regression for four-factor model (Rm-Rf, SMB, HML & FIP) ... 62
12. Time series regression for the additional model (Rm-Rf & FIP)... 63
13. Dummy test ... 66
ix
LIST OF FIGURES
1. Number of firms ... 9
2. Total market capitalization ... 9
3. Total trade volume ... 10
4. Net inflow ... 10
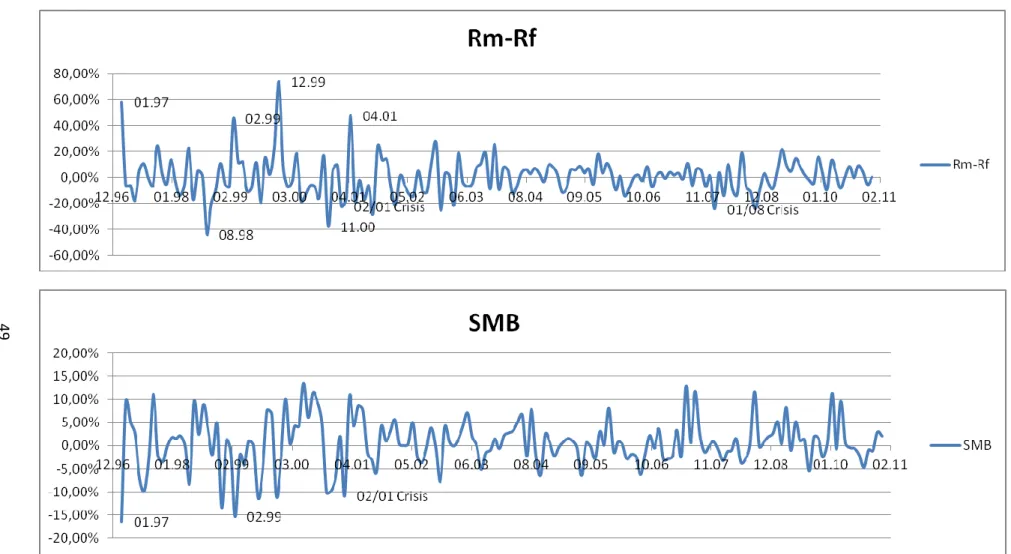
5. Rm-Rf & SMB ... 49
1
CHAPTER I
INTRODUCTION
The topic of asset pricing is a fundamental research area within the finance literature. The pricing of equities has attracted the interest of numerous researchers and maintained its popularity since the early 1950s. Along with the rise of globalization in financial markets and the tremendous increase in the information technology; this strand of research has gained even more importance both within the academia and the business world for its practical implications. In the last decades, an extensive amount of research has focused on the financial markets in search of an empirically successful model for explaining the common variation in average stock returns.
The Capital Asset Pricing Model (CAPM) of Sharpe (1964), Lintner (1965) and Black (1972) is one of the first and most influential models developed for this purpose; which states that there is a linear relationship between market return and average stock returns. However by the discovery of additional priced risk factors in the stock market; the CAPM has been shown to be misspecified and
2
empirically inadequate for the US market. Thus, several researchers have attempted to come up with stronger models of asset pricing.
In their two famous papers, Fama & French (1992, 1993) develop a three-factor model which incorporates the mimicking factors SMB (small minus big) & HML (high minus low) as proxies for size and book-to market effects besides the market factor. The superiority of this model to the CAPM in explaining the common variation of average stock returns is proven to be sound for the US market.
The application of the three-factor model in the developed markets generally provides supportive evidence. Fama & French (1998) reveals the presence of a value premium (higher returns for high book-to-market stocks) for 12 EAFE countries including Japan, Great Britain, France, Germany, Italy, the Netherlands, Belgium, Switzerland, Sweden, Australia, Hong Kong and Singapore. Bauer et al. (2010) investigate 16 European markets and show that the three-factor model performs better than the CAPM and the size effect is persistent throughout Europe. Additional studies on individual countries which use time-series or cross-sectional approaches also confirm the superiority of the Fama & French model over the CAPM.
On the other hand, the evidence in the emerging markets remains ambiguous both because of the limited number of studies and the poor quality of available data as indicated by Rouwenhorst (1999). Some of the studies on the emerging markets report only a size effect but no BE/ME effect such as Herrera & Lockwood (1994); Wang & Xu (2004) and Hearn et al. (2010). Conversely some others show
3
that only BE/ME effect is present in a number of countries (Anderson et al., 2003; Hart et al., 2003). Furthermore, there are studies which discover both of these effects such as Claessens et al. (1995) and Rouwenhorst (1999). To sum up, the evidence in the emerging markets is mixed and the results are muddied because of the problems with the accessibility of data.
The investigations in the Turkish stock market are also inadequate and most of these studies either suffer from unavailability of data or very short periods of investigation. Akdeniz et al. (2000) use the cross-sectional approach to investigate the years between 1992 and 1998; and report weak size and BE/ME effects in the Turkish market. All of the studies employing time-series methodology for the examination the stock returns in the ISE confirm that the three-factor model performs better. Among these studies Aksu & Onder (2003) and Misirli & Alper (2010) consider shorter investigation periods than the period considered in this thesis. Doganay (2006) and Yuksel et al. (2010) on the other hand use the logarithmic computation method for calculating stock returns; which causes overestimation of the returns and leads to suspicious results. The shortcomings of these studies imply that it is a necessity to perform a comprehensive application of the Fama & French model in the Turkish stock market.
The ambiguous results from the studies mentioned above reveals a gap in the literature. There is still a significant need for testing the Fama & French model in an emerging market setting. The Istanbul Stock Exchange (ISE) is a good candidate for such research being a highly volatile securities exchange and reflecting the basic characteristics of the emerging markets. This thesis tries to fill
4
in the gap by investigating whether the Fama & French (1993) three-factor model is successful in explaining the common variation in stock returns trading in the ISE. It contributes to the literature by considering the longest investigation period until now and conducting robustness checks to remove the possibility of sample-specific results. Finally this thesis introduces a unique variable (FIP – foreign investor participation) and tests whether it is a common risk factor in the stock market. The effect of the FIP on the average returns is tested since the foreigner participation is commonly perceived to be an important factor in Turkey. The Credit Default Swap (CDS), country specific risk, exchange rate volatility and aggregate (index) volatility are also examined as additional explanatory variables in this study but found to have no effect on the average returns1.
The main hypothesis of this thesis is that the Fama & French three-factor model should be able to explain the common variation in stock returns better than the CAPM. As a secondary research question, the significance of the foreign investor participation effect in the stock market is examined. This thesis also uses different approaches to prove that the model is sound in the sub-periods and there is no structural break during the period of investigation.
The performances of different models are measured using the time-series regression approach of Black et al. (1972). The coefficients and R2 values are interpreted and the cross-sectional implications of intercept terms (Jensen’s (1968) alpha) are considered. The Gibbons et al. (1989) methodology is used to comment on the pricing errors produced by these models. This thesis examines
5
the sub-periods as well as the full sample to make sure that the results are not sample-specific. Finally it conducts structural break tests employing the dummy variable technique and Chow’s (1960) methodology; and using the 2001 and 2008
crises as breakpoints. This study investigates a sample of 111 to 201 stocks trading in the ISE between 1997 and 2010. The financial firms and negative book value firms are excluded from the sample in order to estimate the size and BE/ME effects appropriately. The delisted stocks on the other hand are included to avoid a possible survivorship bias.
The outcome from the time-series regressions reveals that the Fama & French three-factor model outperforms the CAPM. The market beta is proven to be significant for all model specifications and in each sub-period; whereas the SMB and HML are shown to be weakly related to the common variation in average returns. The inclusion of the foreign investor participation factor only slightly improves the results; thus it has relatively less impact on the Turkish stock market despite its statistical significance. The intercept values (Jensen’s alpha) and F-test
results indicate that the CAPM produces significant pricing errors but the three-factor model has lower pricing errors. The inclusion of the FIP reduces the pricing bias even more. Finally the structural break tests find no parameter instability between pre-crisis and post-crisis periods.
The thesis is organized as follows: Chapter 2 describes the Istanbul Stock Exchange and provides information about the two recent financial crises experienced in Turkey. Chapter 3 reviews the literature on asset pricing with an emphasis on the Fama & French three-factor model and its applications in both
6
developed and emerging markets. Chapter 4 introduces the data and methodology used in this study. Chapter 5 presents the empirical results from both informal tests and the time-series regressions; and finally Chapter 6 concludes.
7
CHAPTER II
ISTANBUL STOCK EXCHANGE AND THE FINANCIAL
CRISES
The Istanbul Stock Exchange (ISE) was established in January 1986 as the main organized securities exchange in Turkey. Except for the futures and options which are traded on TURKDEX (Turkish Derivatives Exchange); all of the stock market, bond market, emerging companies market and foreign securities market instruments are traded on this autonomous and computerized public organization. The stock market securities include equities, exchange traded funds, warrants and investment trusts whereas government bonds, treasury bills, corporate bonds and repos are traded as the instruments of the bond market. Turkish Eurobonds are the main constituent of the foreign securities market. The emerging companies market was established in 2010 for the purpose of giving the opportunity to small firms to get listed on the exchange.
Being the most developed and liquid securities exchange in the region, the ISE was the top seventh among emerging markets in terms of its trade volume of 426 billion US dollars in 2010. The ISE ranked 14th in total market capitalization with
8
308 billion US dollars in 2010 among emerging markets. In 2009, the market capitalization of companies was 36.7 % of total gross domestic product (GDP). As of the second quarter of 2011, there are 433 equities being traded in the ISE including the exchange traded funds. 251 of these equities belong to the national market, 129 to the collective products market and 41 to the secondary national market. Without the inclusion of ETFs, there are 331 stocks traded in the ISE.
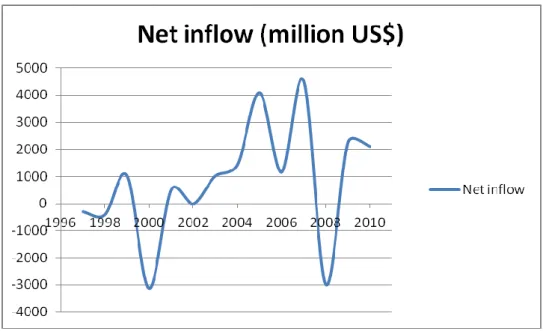
The ISE is widely known in the international capital markets and is recognized by the U.S. Securities and Exchange Commission. There is strong foreign participation in the ISE including both the institutional and individual investors where the share of foreign investors in total market capitalization was 68% in 2010. In terms of trading volume, the share of foreign investors was 31% for the same year. The net inflow on the other hand is on average only 0.42% of the total trade volume.
The Istanbul Stock Exchange has been a growing securities exchange since the financial liberalization, deregulation and privatization started taking place in Turkey in 1983; and is continuing to increase its attractiveness with the rise in the equity trading culture within the country and the region. For the investigation in this thesis, ISE is a good candidate since it reflects the basic characteristics of an emerging market. The average of monthly stock returns is 3.93% for the period covered in this study and the monthly standard deviation of the stock returns is more than 15%; which are considerably high as expected in an emerging market.
9
Figure 1: Number of firms
Source: ISE website
Figure 2: Total market capitalization
10
Figure 3: Total trade volume
Source: ISE website
Figure 4: Net inflow
11
The financial crises Turkey has suffered from during the investigation period are emphasized in this study. The first one was a severe financial crisis in 2001 which was mainly resulted from the fragile financial system in the country. The poor performing macroeconomic indicators such as the high current deficit and high inflation levels made the country inevitably pursue an IMF supported economic program at the beginning of 2000. Despite some improvements due to the implementation of this program during the year, the current deficit was already too high and the financing mechanism of this deficit relied on non-transparent and poorly regulated domestic banking sector. The banks were collecting deposits to lend the government with high interest rates through government debt instruments (GDIs); however it was not sustainable for those banks to borrow with shorter maturities and lend for longer terms. This financing mechanism triggered the high interest rates so that overnight interest rates reached 80% in November 2000. Right after the announcement that the crawling peg exchange system had been left; the currency crisis burst in the beginning of 2001 with the rapid depreciation of the Turkish Lira (TL) of almost 40% against US dollars. The stock market fell by 17% in February 2001 which is the date considered as the starting month of the crisis. The GDP growth rate (adjusted for inflation) was - 6.95% for the second quarter of 2001. As a remedy to this disaster, Banking Regulation and Supervision Agency (BRSA) were formed and it started a restructuring program in the banking sector. The full recovery is assumed to be completed in December 2003, when the overall market return increased above the pre-crisis levels.
The global financial crisis in 2007 has affected almost every country although the magnitude of the effect has varied. Also known as the mortgage crisis, it was
12
originated in the US and its roots went back to the beginning of 2000. The low interest rates and lax lending conditions for mortgage loans increased the demand for real estate; thus the prices increased in the 2000s. The mortgages were included in financial products through the securitization process. Unfortunately the borrowers of these mortgages could not repay their loans when the low interest rates had increased. The decreased real estate prices made the financial products including these mortgages very risky and it became very hard for the investors to trade these products since the risks could not be assessed appropriately. The securitization process and the high leveraged financial system made the crisis inevitable. After the collapse of Lehman Brothers, the US Federal Reserve has lent many banks and other financial institutions to avoid defaults; and also many acquisitions in the financial sector have occurred. The crisis caused a high decline in credit volume thus a severe recession followed. Even though the banking sector in Turkey was strong in terms of its balance sheets; there was a significant decline after the crisis in the funds from abroad which were available to both banks and big firms. This decline was directly reflected to the credits for the real sector and consequently the GDP growth rate fell to -% 4.7 in 2009 which was 4.7% in 2007. The ISE-100 index almost lost 50% of its value during 2008. The crisis period is assumed in this study to last until the end of 2010.
13
CHAPTER III
LITERATURE REVIEW
1. The CAPM
Over the past 50 years many approaches have come into the stage resulting in the creation of different asset pricing theories and the investigation of their empirical tests. The Capital Asset Pricing Model (CAPM) is the most recognized among these theories which is developed by Sharpe (1964), Lintner (1965) and Black (1972). The essential claim of this model is that the excess return on an individual stock is only related to its market beta; which is the coefficient derived from the regression of average returns on a risk premium of the overall market excess return. Supporting the mean-variance efficiency hypothesis of Markowitz (1959); the model argues that beta should construct a basic linear relationship between systematic risk and return. It also implies that the market beta, measuring the sensitivity of a stock return against the market return, is the only explanatory variable for the prediction of excess returns. Despite the presence of strong empirical evidence against these claims; the CAPM is still used in many applications in finance and for educational reasons within the academia.
14
The most important line of criticism against Sharpe (1964), Lintner (1965) and Black (1972) model (which will be referred as SLB hereafter) targets its inability to explain the cross-section of expected returns. This finding is usually associated with the existence of possible common risk factors that are not captured by beta. These factors include ME (market equity, size or market capitalization), BE/ME (book-to-market ratio), leverage and E/P (earnings over price ratio). There are many other firm-specific, macroeconomic and behavioral factors that have been considered in the literature. However this thesis will focus on the mentioned factors because it uses the methodology of Fama & French (1993) paper; where the effects of these factors are investigated.
Banz (1981) first introduces the size effect as an additional significant factor besides the market beta to explain the cross-section of expected returns. In his seminal paper, ME is defined as the product of market price and the number of outstanding shares, and it is shown to be a relevant factor in explaining the average returns. For a given level of beta, the stocks with lower market capitalization are demonstrated to have higher returns. Banz (1981) also points out that the size effect is concentrated in the smallest ME quintiles. The BE/ME effect is discovered by Stattman (1980) and Rosenberg et al. (1985). In these two influential papers it is proven that BE/ME, which is the ratio of a firm’s book
value over market value, is one of the factors that explain the cross-section of average returns. It is shown that the returns increase with higher BE/ME levels. The stocks with higher book values relative to their market equity are also called value stocks in the literature; while the low book-to-market ratio stocks are defined as the growth stocks. The higher average returns on the value stocks,
15
namely the value premium, is shown to be persistent internationally (Fama & French, 1998). This is basically resulted from the expectation of higher risk incurred by holding these stocks. The leverage effect is an addition of Bhandari (1988) where a positive relation between returns and debt to equity ratio is uncovered. The leverage effect is explanatory when it is included with the market beta and also controlled for the size effect. Finally the E/P effect is documented by Basu (1983) and Ball (1978) where risk-adjusted returns increase with increasing E/P. This effect also persists in a model where market beta and size factors are taken into account.
2. Cross-section of Expected Returns
The very early contradictions for the explanatory power of market beta are presented by Reinganum (1981) and Lakonishok & Shapiro (1986). They find that the market beta is not systematically related to the average returns; while the size effect is significant in the cross-sectional regressions. In the 1990s, two lines of research have come into stage for improvements in asset pricing. The first strand of research is the time-series approaches which determine the time variation in betas and offer conditional models such as the papers by Ferson & Harvey (1993) and Jagannathan & Wang (1996). However Ghysels (1998) shows that these models produce larger pricing errors because the beta risk is essentially misspecified. The second strand of research explores for additional risk factors in the cross-section of expected returns. Several researchers have investigated
16
macroeconomic or firm-specific variables as candidates for capturing the systematic risk for stock returns.
One important investigation on the misspecification of CAPM is made by Fama & French (1992) for the period between 1963 and 1990. They test the cross-sectional relations between the average returns and the four factors (size, BE/ME, leverage and E/P) along with the market beta. The purpose is an exploration for further evidence supporting the claims against the beta-return relationship demonstrated in earlier work; and to find which factors are acting as proxies for risk. They examine the stocks in a portfolio context and thus make it possible to observe the effects of different factors separately and in interaction. Hence, they demonstrate which factors are absorbing the effect of others and standing as the true explanatory variables.
Fama & French (1992) first conduct some informal tests to gain preliminary evidence. They first create portfolios formed on size and beta alone. The average returns for the size portfolios both support the SLB model and the size effect of Banz (1981). However by sorting stocks on beta alone, no relation between betas and average returns is observed in line with the results of Reinganum (1981). As a simple method to disentangle the size and beta effects, they create portfolios formed both on size and beta; and find that the spread of betas increase in each size group without having any relation to size. Therefore the average returns of these portfolios provide the opportunity of observing the size and beta effects separately. The calculated average values indicate that the returns are decreasing with size but not related to the market betas. The result of this preliminary
17
estimation casts doubt on the validity of SLB model, documenting that there is no effect of betas on average returns when the size effect is taken apart.
They also create portfolios formed on BE/ME, E/P and leverage. The outcome shows that there is a U-shape pattern (decreasing from the lowest E/P quintile to the middle and then increasing to the highest) in the average returns for E/P portfolios; which is a consistent result with the literature. For BE/ME portfolios, they observe a positive and stronger relation with returns compared to the size effect. The variation in betas for different BE/ME quintiles is again insignificant and therefore contradicts the SLB model’s findings. Finally they investigate the interaction between size and book-to-market effects by constructing two-pass portfolios for them. The result is a positive and strong relation with returns for BE/ME ratio and a negative one for size; controlling one variable for another.
Next they conduct cross-sectional regressions using the Fama & Macbeth (1973) methodology. The average monthly returns are regressed on the aforementioned factors and the average values of the slopes are calculated. In any of the combinations of factors, size effect is always significant and beta has no explanatory power on the cross-section of expected returns. Considering the BE/ME ratio, the effect is again always significant and it is stronger than the size effect when returns are regressed on these two variables alone or together. The case of leverage and E/P ratio is quite interesting on the other hand. They use two leverage ratios which are the natural logarithms of market leverage (A/ME) and book leverage (A/BE). The slopes of these two variables have opposite signs and almost same absolute values. The authors show that BE/ME factor absorbs the
18
effect of these leverage factors; emphasizing that the difference of the two variables is equal to the natural logarithm of the book-to-market ratio. The E/P effect has the U-shaped pattern again supporting the preliminary evidence. Although it has a significant effect on his own; being regressed with size and BE/ME factors, E/P ratio loses its explanatory power. The effect for negative E/P stocks is absorbed by the size factor; whereas for positive E/P stocks the BE/ME ratio wipes out the effect.
The robustness tests including the sub-period examinations and January seasonals check support the results leaving no caveat. The cross-sectional inspection of returns clarify that the SLB model is not correctly specified and there is no significant relation between average returns and market beta. On the contrary, the size and BE/ME effects have strong explanatory power on equity returns absorbing the effects of leverage and E/P.
3. Common Variation in Average Returns
Fama & French (1993) extends the previous analysis on the cross-sectional asset returns by adding bond returns as dependent variables and two term-structure factors as independent variables. The stock market factors in this study are the excess market return and two mimicking portfolio returns. The first mimicking factor is SMB (small minus big); which is the difference between average returns of small size portfolios and big size portfolios. The second is HML (high minus low); which is the difference between average returns of high BE/ME and low BE/ME portfolios. These factors are zero-investment portfolio returns that are
19
proxies for size and BE/ME effects respectively. The bond-market factor TERM is the spread between long-term government bond and t-bill returns; and DEF is the difference between long term government and corporate bond returns. The dependent variables are from 25 portfolios formed on size and BE/ME for stocks; and 5 bond portfolios; two are for government bonds and three for corporate bonds. In this study, the authors intend to find the shared effect of the stock market and bond market factors; assuming the markets to be integrated. Responding to Roll’s (1977) critique; the idea here is to include all assets (stocks
and bonds) in the market portfolio.
They also apply a different methodology compared to Fama & French (1992). Instead of the Fama & Macbeth (1973) procedure, they use the time-series regression method of Black et al. (1972); where they regress the excess returns on the aforementioned factors and interpret the slopes from these regressions as sensitivities to those factors. By using this approach they aim to uncover the causes of common variation in average returns by interpreting the slopes and R2 values. They also intend to examine the intercepts (Jensen’s (1968) alpha) from
the regressions and find out the cross-sectional implications of different factor combinations. Jensen’s alpha measures the abnormal return on a stock or
portfolio.
The preliminary evidence supports the findings of the earlier studies. The average returns are positively related with BE/ME ratio and negatively with size. Hence, they perform time-series regressions in order to discover which factors are responsible for the common variation in returns. Having the market return as the
20
only factor; the model captures most of the variation in stock returns. However the R2 values between 0.7 and 0.9 indicate that there should be some other explanatory variables. Considering only the SMB and HML factors, again a considerable percentage of returns up to 0.65 can be explained. However, adding all three factors together remarkably increases the explanatory power of the model compared to the previous two regressions. The t-values of market return, SMB and HML are highly significant for each portfolio. Moreover the SMB slopes are negatively related with size and HML slopes are positively related with BE/ME ratios. In the three-factor model, almost all of the R2 values are above 0.9. They also find that the bond market factors have explanatory power on stock returns, but this effect is absorbed by the overall market return. The addition of TERM and DEF to the stock market factors does not provide better results; and the three-factor model suffices.
In order to observe the cross-sectional effects of the factors, they focus on the intercept (Jensen’s alpha) values. The intercepts should be statistically indifferent
from zero as a proof that the factors are able to explain the cross-section of average returns according to Merton (1973) and Ross (1976). When the market return is the only explanatory variable, the intercepts increase from low BE/ME quintiles to high BE/ME and decrease from small size quintiles to big size; thus it is obvious that SMB and HML factors are affecting the returns. Regression only on these two variables produce similar and large intercepts with significant values; which indicates that these factors are able to explain the cross-section of returns but not the excess returns. Including all factors in the model diminishes the intercepts to values very close to zero. Therefore the three-factor model is
21
satisfactory in explaining the cross-section of returns. They interpret that the market factor is necessary for explaining the difference between stock returns and the risk-free rate; however SMB and HML are the proxies for the risk factors for average returns. Fama & French (1993) also conduct an F-test for checking whether the intercepts are jointly equal to zero using the methodology of Gibbons et al. (1989). The results show that the test is rejected for all of the three model specifications indicating significant pricing errors but the lowest probability level is for the three-factor model. The rejection of the joint equality of intercepts to zero for the model including market factor, SMB and HML is interpreted to be due to the lack of size effect in the lowest BE/ME quintile. Still, the GRS F-test points out that the three-factor model is better at explaining the cross-section of average returns.
The robustness checks include the investigation for the predictability of residuals, the January seasonals effect, the spurious results due to the usage of the portfolios formed in the same manner on the both sides of the regression (split-sample tests) and the outcomes for the portfolios formed on E/P and D/P (dividend over price ratio). The authors conclude that although the January seasonals and split-sample tests weaken the previous findings, the model remains sound. The three stock market factors, namely overall excess market return, SMB and HML are sufficient to explain both the common variation in returns and the cross-section of average returns. The mimicking portfolios are priced factors affecting the stock returns and the market factor is responsible for the difference between stock returns and risk-free rate (t-bill rate) connecting the stock and bond markets.
22
4. International Evidence – Developed Markets
There is an extensive literature on the international applications of the three-factor model or the measurement of the size and BE/ME effects on the average stock returns. The evidence from the developed markets is generally supportive of the US market findings; especially in the studies that the time-series regression methods are employed. Fama & French (1998) use a two-factor model with market beta and BE/ME ratio to investigate the value premium for 12 EAFE countries (Japan, Great Britain, France, Germany, Italy, the Netherlands, Belgium, Switzerland, Sweden, Australia, Hong Kong and Singapore) plus the US. They find that the BE/ME effect (value premium) is present in twelve of the thirteen most important markets and the two factor model performs better than the international CAPM with a global market portfolio return. In another comprehensive study Bauer et al. (2010) focus on 16 European markets and show that the three-factor model has higher explanatory power for the common variation in the merged data of European stock returns. The size effect is persistent in Europe in contrast to the US market.
There are also a significant number of studies on individual developed countries. For the UK stock market Agarwal & Poshakwale (2010) find strong evidence of size and BE/ME effects from the time-series regressions. The results of Bagella et al. (2010); Miles & Timmermann (1996) and Leledakis & Davidson (2001) are generally supportive of this finding although the effects are shown to be weak or non-existent for some sub-periods in the UK. Several studies revealed that the three-factor model performs better than CAPM in the Australian market where a
23
strong size effect is persistent; however the model’s explanatory power is partial
and the pricing errors are large (Gharghori et al., 2009; Gaunt, 2004; Kassimatis, 2008). The studies by De Pena et al. (2010) and Jareno (2008) find a strong size effect and weak BE/ME effect in the Spanish stock market. Finally for Hong Kong and Singapore, Shum & Tang (2005) show that Fama & French model outperforms the CAPM; but the coefficients of the mimicking factors are not significant in some cases.
The cross-sectional investigations have mixed results: Doeswijk (1997) discovers a value premium in the Dutch market but no size effect; Amel-Zadeh (2011) reports the existence of size anomaly for the German market; Novak & Petr (2010) proves the both effects to be significant in the Stockholm Stock Exchange; and finally the two studies on the Hong Kong stock exchange prop up the explanatory power of both effects and provides contradictory evidence against the SLB model (Lam & Spyrou, 2003; Ho et al., 2000). To sum up, almost all of the time-series investigations and most of the cross-sectional tests for the developed countries support the superiority of the three-factor model over the CAPM.
5. International Evidence – Emerging Markets
Shifting the focus towards developing countries including the emerging and frontier markets; the empirical studies are observed to be concentrated on specific regions of the world and the evidence is muddied because of the insufficient data. The previously mentioned Fama & French (1998) paper also takes the emerging markets into consideration and reports the presence of size and BE/ME effects in
24
16 markets. However they do not report any regression results because of the shortness of the period investigated and the high volatility of returns.
The research on the factors responsible for the common variation in average returns which takes individual countries into account is mostly focused on South-East Asia (Pacific Basin Markets). Wang & Xu (2004) report a size effect but no BE/ME effect and they link this result to the speculative nature of the Chinese market and the poor accounting standards; while for a more recent period Lin & Chen (2008) conduct asset pricing tests for both Shangai and Shenzhen stock markets of China and find different results. They show that the coefficients for the market, SMB and HML portfolios are significant and the intercepts are not; which is an indication of the success of three-factor model in these markets. Jung et al. (2009) demonstrate the improvement for the addition of the two mimicking factors in the Korean market; however the joint tests on intercepts produce lower pricing errors for the one-factor model (CAPM). Investigating the seven Pacific Basin stock markets (Japan, Hong Kong, South Korea, Malaysia, Thailand, Indonesia and Singapore); Chen & Fang (2009) find supporting evidence for the strength of the Fama & French model in comparison with the SLB model; with a stronger size premium rather than value. For the Taiwanese market, Shum & Tang (2005) confirm the superiority of the three-factor model but they show that the mimicking factors are weak predictors. For a more recent period all three factors are shown to be significant for the same market (Chou & Wang, 2007). The Pakistan stock market provides supportive evidence where the size and book-to-market factors are priced and book-to-market factor is insignificant (Iqbal et al., 2010). The Stock Exchange of Mauritius is shown by Bundoo (2008) to be another
25
example where the three-factor model holds. Examining most of the states in Africa Hearn (2009, 2011) and Hearn et al. (2010) report a significant size effect for these markets. Confirming these studies the investigation on the Johannesberg Stock Market by Basiewicz & Auret (2010) glorify the three-factor model by discovering a high explanatory power and low pricing errors. Finally Grandes et al. (2010) clarify the invalidity of the model for Latin American markets.
The cross-sectional tests that do not consider the time variation in returns yield ambiguous results. For instance Claessens et al. (1995) report size and value premium for 19 emerging markets but in many countries the factors have opposite signs compared to the coefficients for developed markets. This is probably due to the weakness of cross sectional tests against outliers as interpreted by Fama & French (1998). Hart et al. (2003) document a significant value premium but no size effect using data from 32 emerging markets. They also emphasize that the value trading strategy should be used at once for all emerging markets since the results are unsound for individual countries. Rouwenhorst (1999) investigates 20 emerging markets and shows the significant relation between returns and size, BE/ME and momentum factors. He clarifies that the market beta has no effect on the cross-section of returns. Chen et al. (2010) provide evidence of the validity of the three-factor model but with weaker predictability for China. Mukherji et al. (1997) discover positive value and size premiums for the Korean market and Chae & Yang (2008) confirm this finding in their examination of several factors in the same market. Herrera & Lockwood (1994) document a size effect for Mexico and they report that the market factor is also priced. As a final example Anderson et al. (2003) find evidence for the value premium in Mongolian stock market which
26
is an interesting case where the stocks are bought in exchange of vouchers during the privatization program.
Regarding the evidence presented above for both studies allowing time variation in returns and ones only exploring the cross-sectional effects; the outcomes are mixed. Still, in most of the cases at least one of the size or BE/ME effects exist and the three-factor model almost always performs better than the SLB specification of CAPM. One important problem with the emerging market applications of the three-factor model is that most of the studies use the data from IFC Emerging Markets database which is not reliable at all. This data consists of an insufficient number of stocks for individual countries (biased towards large and frequently traded ones), includes missing or incorrect data and presents survivorship bias (Rouwenhorst, 1999). Furthermore most of the aforementioned work focus on shorter periods compared to the developed country studies. Thus there is still a very limited number of studies in the literature that precisely test the Fama & French three-factor model in an emerging market setting; and this fact creates room for the investigation in this paper.
6. Evidence from the Turkish Stock Market
The asset pricing literature includes only a few papers that apply Fama & French methodologies to the Istanbul Stock Exchange. Yet these studies either focus on a short data range or lack some of the tests or remain unreliable in terms of the variable calculation.
27
Akdeniz et al. (2000) is the first paper to investigate the cross-sectional variation in stock returns for the Turkish market. They use the Fama & French (1992) approach but also make some modifications in the estimation method because of the small number of stocks and the short period of investigation. They include the adjusted returns of 80 to 150 stocks between 1992 and 1998 for the analysis. The post-ranking betas are calculated using the returns of previous 24 months rather than 60 months of Fama & French (1992) because of the limitations of the dataset. Furthermore they form the portfolios each month instead of each year. Before conducting the asset pricing tests, they provide some preliminary evidence. For the portfolios formed only on beta, the average returns are shown to have no relation with the market betas; while the firm specific values (size, BE/ME and E/P) also do not exhibit a pattern across the quintiles. On the other hand, portfolios formed only on size have decreasing returns from the smallest to the largest except for the second sub-period and the BE/ME values are negatively related with size. The formation of the size-beta portfolios reveals that there is a size effect despite its weakness and there is no relation at all between betas and average returns. Sorting the stocks on BE/ME ratio shows that the average returns increase with higher BE/ME values and the relation is very strong in the first sub-period. Tabulating the size and BE/ME together, the effect of one variable becomes weaker while controlling for another and this is interpreted by the authors to be due to the reduction in the sample size. They also control for the E/P ratio and find that its effect is absorbed by the other factors. After presenting these descriptive statistics; Akdeniz et al. (2000) conduct Fama & Macbeth (1973) regressions. The stock returns are regressed on the relevant factors each month
28
and the average slopes are computed. The results show that excess market return is not priced even when it is the only independent variable. The size and BE/ME effects exist for the whole sample but they are rejected for the second sub-sample. They think that the rejection might be due to the self-destruction process of the anomalies because of the similar investor behaviour or it is simply a sample-specific result. Hence they leave the floor to new research covering a longer time period.
The working research paper by Aksu & Onder (2003) on the other hand, employs the Fama & French (1993) methodology. The authors test the three-factor model in comparison with the CAPM for the 1993-1997 period and also search for any relation between the firm-specific factors and macroeconomic fundamentals. They replicate the Fama & French portfolio design with using 16 portfolios instead of 25; and they regress the average returns on the factors both individually and in a portfolio context. The summary statistics reveal that there is a weak BE/ME effect and relatively a strong size effect for the period. The time-series regressions of individual stocks show that the three-factor model does not perform better than the model with market and SMB factors; and the coefficient on HML in the three-factor model is not significant. This outcome confirms the preliminary findings of the strong size effect. The authors interpret that the absence of the BE/ME effect in the time-series regressions might be due to the high correlation between excess market return and HML. The test is repeated using the 16 portfolio returns as dependent variables and the three-factor model is shown to have higher explanatory power than the CAPM with increased R2 values; though almost half of the coefficients for the both mimicking portfolios remain insignificant. The
29
model is proven to be better at explaining the returns on firms with high book-to-market ratio and small capitalization. To sum up, Aksu &Onder (2003) discover a relatively strong size effect and a weak BE/ME effect for the Turkish market; yet these results are from a working paper which is focused on a very short period of time.
The first complete application of the Fama & French (1993) model to the Turkish stock market is made by Doganay (2006). He investigates the years between 1995 and 2005 with an almost exact replication of the model. The time-series regression output points out that the 25 portfolios and especially portfolios with smaller size and higher BE/ME are explained better by the three-factor model. The coefficients on SMB and HML are related with size and BE/ME respectively and most of them are significant. The author finds that intercept values are individually insignificant which is presented as a proof of the model’s explanatory power; yet he does not perform an F-test to measure the joint equality of intercepts to zero. The relatively low R2 values for the 25 portfolios in comparison with the results for the US market are interpreted by the author to be a sign of the underdevelopment of the financial markets, macroeconomic instability and problems with corporate governance in Turkey; which lead to higher unsystematic risk. Overall, this study confirms the three-factor model’s superiority over CAPM, even though the mimicking portfolio factors are weakly effective and the market beta is priced. Still there are some points which cast doubt on the findings of Doganay (2006). First, he includes the financial firms as well as the non-financials to increase the number of firms in the sample; which is not appropriate since the high leverage of the former might distort the results. Second, he uses the actual
30
book equity values in June for portfolio formation. This is not intuitive because the effect of the financial statement information is considered to be lagged as it is stated by Fama & French (1992, 1993). Finally the lack of joint F-test for the intercepts leaves the pricing error of the model poorly explained. All of the weaknesses explained above create the need for a better examination of the Turkish stock market.
A more recent and extended study by Yuksel et al. (2010) uses both Fama & French (1992) and Fama & French (1993) procedures for analyzing the period between 2000 and 2007; while including the liquidity as an additional risk factor in the model. They estimate the post-ranking betas by regressing the previous 36 months’ stock returns on the market return. The dependent variables are 12
portfolios formed on size, book-to-market ratio and liquidity (measured by share turnover rate). The cross-sectional regression results show that the average returns are not significantly related to beta or size (unlike the relation to size in the period covered by Akdeniz et al., 2000). On the other hand BE/ME and liquidity variables are priced factors; regardless of whether they are either single independent variables in the model or included with the three other factors. The time-series regressions reveal that all of the included factors have explanatory power with significant coefficients. The slopes are related with size, BE/ME and liquidity. The R2 values indicate that three-factor model explains the average returns much better than the CAPM but adding the liquidity as a fourth factor just makes a slight contribution. The intercept (Jensen’s alpha) values from the regressions with one-factor and three-factor models exhibit a decreasing pattern from the illiquid portfolios to liquid portfolios. This trend disappears in the
four-31
factor model as another supportive evidence for the liquidity effect. The authors also conduct a GRS F-test for each model specification and find out that the joint equality of intercept values to zero is not rejected only when the liquidity is included as a factor. Finally they control for January seasonals and discover no significant effect. In short, Yuksel et al. (2010) make an extensive analysis and conclude that three-factor model has more explanatory power compared to the CAPM and adding the liquidity factor to the model increases its explanatory power even more. On the other hand, the Fama & Macbeth (1973) regressions reject the size as a priced factor for the sample. One line of criticism against the findings of this paper might target the calculation method of stock returns and market return. The authors use the difference between the natural logarithm of the prices; which might not be a good method for the Turkish stock market. In order to capture the high volatility in returns, calculating the percentage changes would be a safer method. In order to shed light on this issue, the difference between log and percentage returns will be discussed in the later chapters. Another weakness of this paper is that the authors form only twelve portfolios which divide the sample into only two size and three BE/ME groups; and thus they are not able to observe the relation between risk factors and firm characteristics perfectly.
Finally Misirli & Alper (2010) examine the Istanbul Stock Exchange by both using multivariate and cross-sectional tests. They investigate the effect of coskewness after comparing the three-factor model with the CAPM. They form 16 Fama & French portfolios for the 1999-2005 period and estimate the post-ranking betas using 36 month rolling-windows. Based on the descriptive statistics they state that the coskewness measures are significant for size and industry portfolios;
32
but the relation is weak between size-BE/ME portfolios and coskewness. They demonstrate the existence of size and BE/ME effects for the average excess returns and find out that the size premium can be explained by the coskewness measures. Next, they compare the models in terms of the pricing bias using GRS f-test methodology in time-series regressions. The three-factor model is shown to decrease the pricing error; although the hypothesis of joint equality of intercepts to zero is rejected for all specifications. The inclusion of the coskewness factor improves the F-statistic; but only a little over the three-factor model. Finally the cross-sectional regressions reveal that the model with market return and coskewness factor is superior to the SLB specification of the CAPM but not to the Fama & French model. The authors interpret that this result is probably because the same financial risk is reflected by the Fama & French factors and the conditional coskewness measure. Nevertheless this paper also confirms the better performance of the three-factor model despite its focus on the effect of another variable on the expected returns.
The time-series regression results of the studies mentioned above more or less complement each other; while there is contradiction in terms of the cross-sectional results. These studies give a broad picture of the risk factors in the Istanbul Stock Exchange but have their own shortcomings. First of all, almost all of them have relatively short time periods of investigation; which makes it necessary to perform an extended analysis for this market. Furthermore no sub-period analysis is carried out except for the examination by Akdeniz et al. (2000); thus a possibility of sample-specific results remains unresolved. The risk-free rate data used in these studies is also problematic; since it is either the imperfect proxy of Turkish
33
Central Bank overnight rate or a series gathered from the Treasury Department of Turkey for the irregularly issued t-bill returns. Thus a more detailed evaluation of the asset pricing tests with a more trustworthy dataset would explain the drivers of expected returns in Istanbul Stock Exchange accurately; and this is what this thesis intends to do.
34
CHAPTER IV
DATA & METHODOLOGY
1. Data
This study focuses on the period between 1997 and 2010 for investigating the stock returns trading in the Istanbul Stock Exchange. The earlier years are not included because of either the insufficiency or the poor quality of data for most of the variables. The financial firms such as banks, holding companies, investment trusts and insurance companies are excluded from the sample; since the highly levered capital structure of these firms would distort the results. In order to measure the book-to-market effect accurately, the firms with negative book values are also excluded. For each year t, the market equity for the June of year t and book-to-market value for the December of year t-1 are required for a stock to be included in the sample. All firms are assumed to have December fiscal year-ends in line with the previous literature. Fama & French (1992) show that; the usage of actual fiscal year-end values does not alter the results significantly. The delisted stocks are also included to prevent a possible survivorship bias. The number of
35
companies in the sample ranges from a minimum of 111 (in 1997) to a maximum of 201 (in 2010) after these modifications.
The monthly stock prices are downloaded from DATASTREAM; which are the closing prices adjusted for stock splits, cash dividends and stock dividends. The ISE-100 index values are also downloaded from the same source to be used as a proxy for the market portfolio. The percentage monthly returns for these variables are calculated; since the logarithmic difference underestimates the returns on stocks in a highly volatile market such as the ISE. The unadjusted prices of stocks and the number of outstanding shares are gathered from DATASTREAM and their product is used as the market equity. The book-to-market ratio from DATASTREAM is dependable only after 1998; thus it is merged with the data downloaded from the ISE website for 1997 and 1998. The additional factor to the Fama & French model used in this study, the ―FIP‖, is the monthly difference of total foreign purchases and sales of equity divided by the total trade volume. This variable is constructed from the ISE website and used as a proxy for foreign investor participation. The risk-free rate is the most problematic variable for any investigation on the ISE. Most of the studies use the overnight interbank rates from the Central Bank of Turkey website or datasets derived from the returns of the irregularly issued treasury bills. The usage of overnight rate is not trustable since it is not a good proxy at all for the crisis periods. This study is the first to use the interpolated t-bill return series from the ―Global Financial Data‖ database which seems to be the most reliable short-term risk-free rate measure available for the Turkish market. This unique risk-free rate series provides the opportunity to come up with more reliable results compared to the previous studies.
36
2. Portfolio Formation
For the informal tests; portfolios are first formed on size and BE/ME alone. These portfolios provide the opportunity of observing the individual effects of these variables on the cross-section of average stock returns. The size portfolios are formed in the following way: In each year ―t‖ at the end of June, stocks are sorted
with respect to their size and the sorted stocks are divided into five quintiles. The stocks in each quintile form a size portfolio. After creating the size portfolios; the average return and book-to-market ratio are calculated for the stocks in each portfolio from July of year t to June of year t+1. The time-series averages of these values are used to provide preliminary evidence of the relation between size and average return or BE/ME. The same procedure is used for creating BE/ME portfolios and exploring the relation of BE/ME to average return and size. The market equity for June of the respective year is used for forming portfolios whereas December t-1 values are used for the book-to-market ratio. The reason for allowing six months of lag for BE/ME effect is that the impact of the financial statement announcements is not immediate.
After analyzing the individual effects of these factors, a deeper insight can be achieved by investigating the interaction between the effects. Using two-pass sorts for the variables, the effect of one factor is examined while controlling for the other factor. For this purpose size-BE/ME portfolios are formed and the effects of these variables are disentangled from each other. The stocks are first ranked on their market equity and grouped into five quintiles. Then, the stocks in each size quintile are sorted with respect to their book-to-market ratios and five BE/ME
37
portfolios are formed for one size quintile. The outcome of this process is 25 portfolios each of which belongs to one size and one BE/ME group. The average returns for these portfolios are calculated again for the 12 months beginning in July of the respective year and the time-series averages including all years in the sample are computed.
The time-series tests are performed with the portfolios. The dependent variables for all model specifications are the excess returns (Rit – Rft) on the 25 size-BE/ME portfolios. These portfolios are formed at June of each year ―t‖ as discussed
previously. The excess returns on a portfolio are calculated for each year from July of year t to the June of year t+1; and this process is repeated. The reason for using size-BE/ME portfolios in the regressions is to see whether the mimicking factors explain the common variation in returns related to size and book-to-market ratio.
Pricing ability of four explanatory variables is investigated in this study. Among these, excess market return and the foreign investor participation (FIP) variables are formed independently from the portfolio context. The market factor is simply the difference between the return on the ISE-100 index and the risk-free t-bill rate. FIP is the difference between monthly purchases and sales of total equity by foreigners divided by the total monthly trade volume in the ISE. Umutlu et al. (2008) also use net inflow as a proxy for foreign investor participation; however they normalize this variable by the total market capitalization instead of total volume. In this study the monthly trading volume is used for normalization in
38
order to calculate the net inflow activity as a share of that month’s total trading
activity.
The FIP is hypothesized as a risk factor because the foreigner participation is commonly perceived in Turkey to have an important impact on the stock market. The huge amount of capital inflows are expected to be related with the rise of the stock market and the capital outflows are thought to be related with the fall of the market. This thesis intends to clarify whether it is the case by including the FIP as an explanatory variable in the time-series regressions.
The third and fourth factors on the other hand, are mimicking portfolios which are discovered by Fama & French (1993). SMB (small minus big) proxies the size effect whereas HML (high minus low) proxies the book-to-market effect. In order to construct these variables six portfolios are formed using the same procedure for the 5x5 portfolios mentioned before. The stocks are first sorted on size each year and divided into two groups called small and big (S and L). Then these groups are sub-divided into three BE/ME groups where the stocks within the lowest BE/ME fraction (30%) are called low (L); the stocks in the middle (40%) are named medium (M); and the stocks with highest book-to-market ratio (30%) are defined as high (H). Hence six portfolios are created (S/L, S/M, S/H, B/L, B/M, B/H); which contain stocks in different size and BE/ME groups. The SMB factor is produced for each month by calculating the difference between the average returns on small portfolios (S/L, S/M, S/H) and the average returns on big portfolios (B/L, B/M, B/H). The HML is similarly the difference between the average returns on the high (S/H, B/H) and low (S/L, B/L) portfolios. These two