894
http://journals.tubitak.gov.tr/medical/ © TÜBİTAK
doi:10.3906/sag-1908-44
Validating the Turkish version of the Weinstein noise sensitivity scale:
effects of age, sex, and education level
Melis KESKİN YILDIZ1, Yusuf Kemal KEMALOĞLU2,*, Yetkin TUAÇ3, Güven MENGÜ4, Recep KARAMERT5, Çağıl GÖKDOĞAN6
1Department of Audiology, Faculty of Health Sciences, Gazi University, Ankara, Turkey
2Deaprtment of Otolaryngology & Audiology Subdivision, Faculty of Medicine, Gazi University, Ankara, Turkey 3Department of Statistics, Faculty of Science, Ankara University, Ankara, Turkey
4Department of Western Languages and Literatures, Faculty of Letters, Ankara Hacı Bayram Veli University, Ankara, Turkey 5Department of Otolaryngology, Faculty of Medicine, Gazi University, Ankara, Turkey
6Department of Otorhinolaryngology, Faculty of Medicine, Muğla Sıtkı Koçman University, Muğla, Turkey
* Correspondence: [email protected]
1. Introduction
Noise has been described as unwanted sound. The American Hearing and Speech Association (ASHA) points out that one person’s music is another person’s noise [1]. However, a part of population appears to be more prone to perceive sound as a negative condition and present strong emotional reaction to noisein the same acoustical conditions [2–7]. It has been reported that the subjects with negative tendency to sound are resistant to adaptation to noise for longer periods of time [3–5,7], and that it is related with a genetic or familial tendency [8]. This concept has been named as subjective noise sensitivity (SNS) [5,6] or noise annoyance susceptibility [2].
The researchers clearly presented that SNS was a predictor of noise annoyance [5,7,9]. It is known that some clinical conditions such as head trauma, migraine headaches, facial paralysis, otologic infections and surgeries such as stapedectomy, and some medicines are also related with increasing annoyance from aloud sound (hyperacusis) [10,11]. Although the association of SNS
with hyperacusis or phonophobia is still an unanswered question, the SNS concept summarized above appears to be a consistent and stabile personality traitin the subjects without such a clinical problem. No relationship of SNS with auditory acuity was reported [2,5,12,13]. It was also documented that noise sensitive people did not have more experience of exposition to noise [14].
However, it has been reported that SNS is related with behavioral differences, tendencies towards some psychological conditions, poor health perception, and social differences. Weinstein[3]reported that theywere lower in scholastic ability, felt less secure in social interactions, and had a greater desire for privacy. Weinstein [4] and Stansfeld [5,12] pointed out that people with SNS were more sensitive to sensory stimuli around them and hence more critical of their environmental quality. Stansfeld [5,15], Öhrström et al. [16], Belojevic and Jakovlevic [6], and Stansfeld and Shipley [17] pointed out a tendency toward neuroticism, depressive symptoms, and psychological distress. Furthermore, Babisch et al. Background/aim: Subjective noise sensitivity (SNS) is not only one of the most important predictors of perceived noise annoyance for the subjects exposed to the noise, but also strongly related with some psychological conditions and poor health perception of the subjects. Weinstein’s Noise Sensitivity Scale (WNSS) is widely used for measuring of SNS.
Materials and methods: In this study we adapted WNSS to Turkish (Tr-WNSS) and evaluated its psychometric properties and effect of age, sex and education level on SNS.
Results: The study included 105 males and 105 female subjects between 18 and 55 years of age.
Conclusion: Our data demonstrated that Tr-WNSS was a reliable, valid, and invariant scale for the Turkish population, and not affected by sex, age and education level.
Key words: Noise annoyance, noise sensitivity, questionnaire survey, Weinstein’s noise sensitivity scale
Received: 08.08.2019 Accepted/Published Online: 11.04.2020 Final Version: 23.06.2020 Research Article
[18], Fyhri and Klaeboe [19], and van Kamp and Davis [11] reported higher cardiovascular problems, while Stansfeld and Shipley [17] documented only a meaningful association between SNS and angina in people from lower employment grades. Besides, Shepherd et al. [20] found that SNS was negatively associated with self-reported health-related quality of life scores. Stansfeld and Stanley[17] recently documented that SNS has been identified as a predictor of mental ill-health, while Schreckenberg et al. [21] reported an association of SNS with physical health. These data point out that SNS is an important predictor not only for noise annoyance but also for health perception of the subjects and their predisposition to the psychological problems.
Although the studies presented that environmental high noise appears to be important problem in Turkey [22– 24] and there are some noise-annoyance questionnaires adapted to Turkish [23,25] and developed in Turkish [24], noise sensitivity has never been subject to any research in the Turkish population as much as we found in the English and Turkish literature. For the measurement of SNS, long and short questionnaires have been proposed [7]; the Weinstein noise sensitivity scale (WNSS) has been one of the most widely used standard questionnaires with high validity, reliability, and internal consistency [3,4,26,27]. In this study we aimed to adapt WNSS to Turkish and looked for its reliability, internal consistency, factor structure, and furthermore its stability regarding sex, age, and educational level in the Turkish population without any otologic and neuro-otologic problem.
2. Material and method
This study was approved by the clinical research ethics board in Gazi University (Approval date and no: 23.03.2015, 176). This research was conducted at the audiology department of the university hospital.
In the first step of the study, WNSS [3] was translated into Turkish by 2 of the authors and translated back to English. Then, the preliminary Turkish version was evaluated in a pilot study including 20 interviewers, and it was noticed that only small changes were needed, because all items were found to be clear in Turkish and understanding of the interviewers was in accordance with the original target of each question. After these small corrections, the Turkish version of WNSS (Tr-WNSS), which is comprised 21 items with a 6-point scale ranging from 1 (agree strongly) to 6 (disagree strongly) was completed. Hence, summing up the scores of all items created a noise sensitivity score (NSS) of each subject. For test reliability, Tr-WNSS questionnaire was refilled out by 64 subjects after a 15-day interval. The test/retest reliability was assessed with Pearson’s test. Then, validation of the scale was calculated with confirmatory factor analysis (CFA). The internal consistency for
Tr-WNSS was calculated with Cronbach’s alpha (α) coefficient. In order to test homogeneity of variances, Levene’s test was used. According to result of Levene’s tests, homogeny or nonhomogeny group of variances decided and independent 2 sample t-test was conducted. By using analysis of variance test, the differences between groups were assessed.
In the second step of the study, Tr-WNSS was applied to 210 subjects (M: 105, F: 105) aged between 18 and 55 years. Inclusion criteria were as follows: no chronic health problem causing functional impairment in daily life (only exception was use of eyeglasses), no craniofacial abnormality or congenital disorders, and normal hearing as personal perception without history of any otologic and/or neuro-otologic disorders.
NSS was calculated for each subject and compared between i) males and females, ii) age groups (age subgroup-1: the subjects younger than 35 years of age; age subgroup-2: the subjects between 35 and 55 years of age), and iii) education groups (education subgroup-1: elementary, secondary and high school; education subgroup-2: 2-years of higher education after high school or Bachelor’s degree). Furthermore, correlation of NSS with age was tested.
Then according to NSS, the lowest (lowest 30%) and highest (highest 30%) SNS subgroups were found, and the lower and upper SNS groups were compared regarding sex, age, and education level in addition to NSS.
3. Results
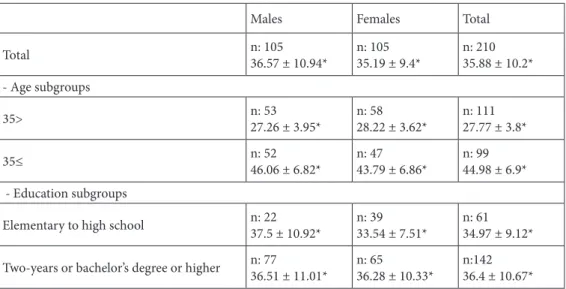
In whole study group, mean age of 105 male subjects (36.57 years, minimum: 19; maximum: 56) was not different from those of females (35.19 years, minimum: 19; maximum: 62). Of 210 subjects, 111(M: 53, F: 58) were younger than 35 years of age, and 149 (70.95%) were graduates of 2-years of higher education after high schoolor Bachelor’s degree or higher (Table 1).
At the first step of the study, by using the data of 64 subjects (37 males with mean age of 33.95 ± 3.37 months and 27 females with mean age of 34.23 ± 9.88), it was found that test reliability was high by Tr-WNSS (Pearson’s test, r: 0.92, P < 0.001). Levine test presented that the data were distributed in accordance with normal distribution.
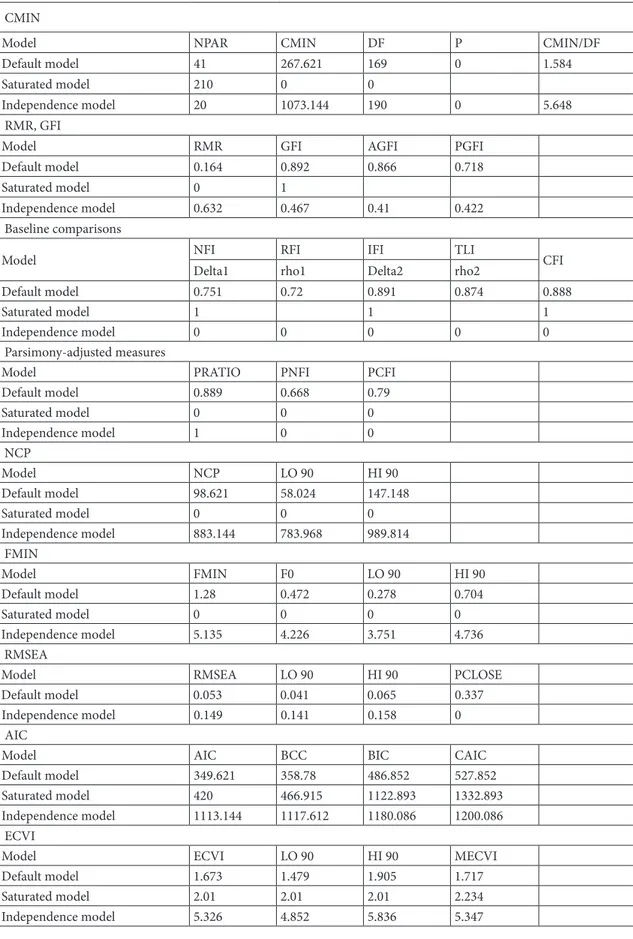
The factor structure of the 21-item scale was tested by using CFA. The CFA was conducted using IBM SPSS AMOS 26 software. We follow the same strategy for the factor model case with Senese et al. [28]. Items 2, 4, 5, 6, 7, 10, 11, 13, 16, 17, 18, 19, and 21 were specified to the first factor, while items 1, 3, 8, 12, 14, 15, and 20 were specified to the second factor. From this setting of the items, we summarized the following results in Table 2.
According to Table 3 the default model fit has the following parameters. χ² = 267.621 with df = 169 which
means that the default model is statistically significant. We can also support the result from CMIN/DF ratio is below 3, which is a good metric for an acceptable model (CMIN/DF = 1.584). We do note that the RMSEA is below the accepted threshold (<0.10) for the default model (RMSEA = 0.054). The CFI value is 0.888 which is between traditional bounds and it is acceptable for the default model. The GFI value is a little below than the acceptable value but it is in satisfactory limits (GFI = 0.892). The AGFI value is above the accepted threshold (>0.80), which is 0.866. The SRMR value is way below than .09 for our model (SRMR = 0.00). The TLI parameter value is close to 1 (TLI = 0.874), which indicates a very good fit for the default model. Also, according to the AIC values, the default model has the minimum value among the others (AIC = 349.621). This means that the default model has the best fit. All other values for the parameters of the CFA results can be seen in the Table 3. Figure is the diagram of the CFA analysis which shows the relations and the correlations coefficients between the factors. Our results support the conclusion that the 2 latent factors are strong reflections of the associated observed variables.
When participants were asked 21 questions, the CFA was used for validity of Turkish scales. CFA results showed that 2-factor model fits the model according to the significance value P < 0.05 (Table 2). These 2 factors are highly correlated to each other (r = 0.656; P < 0.05). As supported by different researches, the scale can be considered substantially unidimensional because the second factor can be accounted for as an effect of the direction of item wording more than an expression of a
different dimension. This was also confirmed by the strong correlation between the 2 factors.
At the second step of the study, it was observed that the mean NSS value was 88.72 ± 17.97 for 210 volunteers, and 89.22 ± 16.21 (minimum: 48 and maximum: 124) for males and 88.23 ± 19.63 (minimum: 30 and maximum: 119) for females (Table 4). No statistical difference between males and females and between age subgroups and between education subgroups was detected (Student-t test, P > 0.05) (Table 4). Pearson’s correlation analysis declared that NSS was not correlated with age in either total group or male and female subgroups (Pearson’s test, P > 0.05).
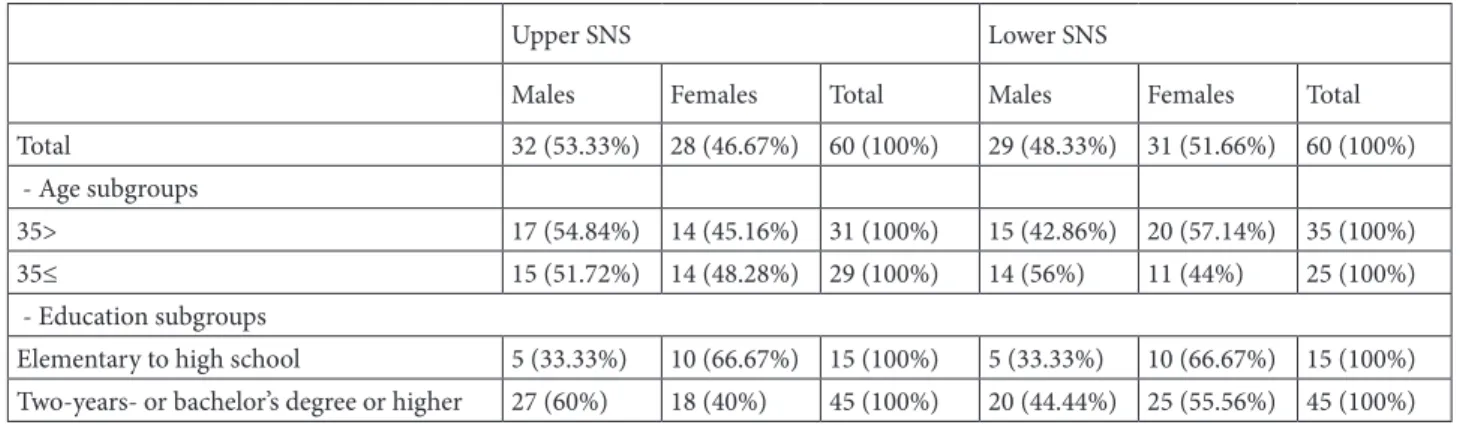
It was observed that there were 60 subjects (M: 32, mean age: 35.81 ± 9.82, min: 19, max: 54, F: 28, mean age: 35.93 ± 10.97, min: 21, max: 55) in the lowest SNS group (NSS was 81 or lower) and 60 subjects (M: 29, mean age: 35.86 ± 11.09, min: 23, max: 55, F: 31, mean age: 34.23 ± 9.01, min: 19, max: 55) in upper SNS group (NSS was 99 or higher). NSS was significantly higher in the upper SNS group (108.73 ± 6.66) than the lower SNS group (66.23 ± 11.8) (Student-t test, P < 0.001). A statistically significant difference between upper and lower SNS groups was also found in male (70.0 ± 9.31 vs. 107.9 ± 7.54, P < 0.001) and female (61.93 ± 12.99 vs. 109.52 ± 5.94) subgroups. No statistical difference in age was detected between the upper and lower groups (Student-t test, P > 0.05). No difference in male/female rate and education and age subgroups was detected between the upper and lower SNS groups (x2 test,
P > 0.05) (Table 5). Besides, it was observed that 30.48% of all male subjects of the study were in the upper SNS group while it was 26.67% for females (x2 test, P > 0.05). Of 111
Table 1. Sex and age data of the study group and subgroups.
Males Females Total
Total n: 10536.57 ± 10.94* n: 10535.19 ± 9.4* n: 21035.88 ± 10.2* - Age subgroups
35> n: 5327.26 ± 3.95* n: 5828.22 ± 3.62* n: 11127.77 ± 3.8* 35≤ n: 5246.06 ± 6.82* n: 4743.79 ± 6.86* n: 9944.98 ± 6.9* - Education subgroups
Elementary to high school n: 2237.5 ± 10.92* n: 3933.54 ± 7.51* n: 6134.97 ± 9.12* Two-years or bachelor’s degree or higher n: 7736.51 ± 11.01* n: 6536.28 ± 10.33* n:14236.4 ± 10.67* * mean age, years.
subjects who were younger than 35 years of age, 27.93% was in the upper group; 29.29% of 99 subjects who were 35 years or older were in the upper SNS group. It was seen that 24.6% of 61 subjects in the lower education group were in the upper SNS group; this rate was 31.69% of 142 subjects in higher education groups (x2 test, P > 0.05). 4. Discussion
Garrioch [29] reported that the prosperous Greek colony Sybaris in Italy prohibited industrial noises in residential areas in 720 BCE. The historical papers present that not only noise exposure but also noise annoyance increases in modern life since the time of Sybaris [29–32]. Belojevic et al. [7] say that noise affects the person who is “doing nothing” by annoying him, while it affects the person who works by impairing his performance or making it more costly in terms of increased effort. Therefore, during the last century, not only annoyance but also its impact on human performance and interpersonal behavior has been subjected to studies by social psychologists [33]. SNS has been documented as a predictor or modulator for noise annoyance level when exposed [2–7,9]. In this study, we adapted WNSS to Turkish (Tr-WNSS) to make it available
for multidisciplinary researches related to noise. Our data documented that Tr-WNSS was a convenient tool with strong internal and external consistency in the Turkish population, as reported in other adaptation studies of WNSS to non-English languages including Swedish [26], German [34], Japanese [35], Persian [27], and Italian [28]. Hence, WNSS could be used in Turkish for predicting personal behavior in the case of noise exposure without language barrier.
Besides, although it has been developed with college student samples by Weinstein [3], the studies documented that it is valid and convenient in other populations, such as the depressed subjects and hospital staff between 18 and 65 years of age [5], the adult residents living close to heavy traffic roads in Japan between 20 and 70 years of age [35], nonindustrial employees between 17 and 76 years of age in Iran [27], and adults living in the neighborhoods of southern Italy [28]. In our study, Tr-WNSS presented a convenient assessment of SNS in adults between 18 and 55 years of age so that the highest 30% could be significantly different from the lowest 30%.
Nevertheless, it could be said that the average score in our study revealed some differences from previous studies. While it was 54.6 ± 12.1 (with 1–6 rating) in the study of Weinstein [3], it was found to be 89.41 ± 17.38 (with 1–6 rating) in our study. The other studies conducted on university students in Switzerland and Germany reported 57.5 ± 12.61 (with 0–5 rating; it must have been 69 by 1–6 rating) and 63.08 ± 14.07, respectively [26,34]. Furthermore, Stansfeld [5] used WNSS (with 1–6 rating) in depressed subjects and control group composed of the hospital staff between 18 and 65 years of age, and the average score was found to be 56 and 57.21 for male and female controls, respectively. No average data was available in the Italian and Japanese studies. On the other hand, the study by Alimohammadi et al. [27] also reported a higher average score (74.93 ± 13.42 with 0–5 rating; it must have been 89.92 by 1–6 rating) for Persian nonindustrial employees. We may speculate that higher average scores found in Persian and Turkish studies could be related with the sociocultural differences in comparison to the Western countries; this aspect has never been questioned before and needs further research, which will be conducted in different countries.
Beyond this difference, our data was in accordance with the previous reports revealing that NSS was not different between males and females, and within the age subgroups [2,3,6]. However, Senese et al. [28] reported that females and people older than 45 years were more noise sensitive than males and younger people, respectively.
van Kamp and Davies [11] pointed out importance of focusing of noise research on vulnerable groups which could be defined by socioeconomic and/or education status. Table 2. Factor loadings of the items.
Item Factor Estimate
s2 Factor 1 .342 s4 Factor 1 .440 s5 Factor 1 .460 s6 Factor 1 .541 s7 Factor 1 .580 s10 Factor 1 .550 s11 Factor 1 .158 s13 Factor 1 .565 s16 Factor 1 .564 s17 Factor 1 .512 s18 Factor 1 .552 s19 Factor 1 .674 s9 Factor 1 .502 s21 Factor 1 .758 s1 Factor 2 .357 s3 Factor 2 .406 s8 Factor 2 .597 s12 Factor 2 .316 s14 Factor 2 .640 s15 Factor 2 .400 s20 Factor 2 .476
Table 3. The summary of the CFA model results CMIN
Model NPAR CMIN DF P CMIN/DF
Default model 41 267.621 169 0 1.584
Saturated model 210 0 0
Independence model 20 1073.144 190 0 5.648
RMR, GFI
Model RMR GFI AGFI PGFI
Default model 0.164 0.892 0.866 0.718
Saturated model 0 1
Independence model 0.632 0.467 0.41 0.422 Baseline comparisons
Model NFI RFI IFI TLI CFI
Delta1 rho1 Delta2 rho2
Default model 0.751 0.72 0.891 0.874 0.888
Saturated model 1 1 1
Independence model 0 0 0 0 0
Parsimony-adjusted measures
Model PRATIO PNFI PCFI
Default model 0.889 0.668 0.79 Saturated model 0 0 0 Independence model 1 0 0 NCP Model NCP LO 90 HI 90 Default model 98.621 58.024 147.148 Saturated model 0 0 0 Independence model 883.144 783.968 989.814 FMIN Model FMIN F0 LO 90 HI 90 Default model 1.28 0.472 0.278 0.704 Saturated model 0 0 0 0 Independence model 5.135 4.226 3.751 4.736 RMSEA
Model RMSEA LO 90 HI 90 PCLOSE
Default model 0.053 0.041 0.065 0.337
Independence model 0.149 0.141 0.158 0 AIC
Model AIC BCC BIC CAIC
Default model 349.621 358.78 486.852 527.852 Saturated model 420 466.915 1122.893 1332.893 Independence model 1113.144 1117.612 1180.086 1200.086 ECVI
Model ECVI LO 90 HI 90 MECVI
Default model 1.673 1.479 1.905 1.717
Saturated model 2.01 2.01 2.01 2.234
Although noise exposure was found to be associated with income level [36], no direct data presenting a relationship between SNS and any measure of socioeconomic status was published. In our study, we used high school education
as a cut–off and found that education after high school alone did not address any difference regarding increased or decreased risk of SNS, as reported by Moriera and Brian [2] and Belojevic and Jakovljevic [6]. Michaud et al. [37] Figure. The path diagram of the CFA.
reported that education level had statistically significant associations with traffic noise annoyance.
As a conclusion, it is said that WNSS is convenient tool for evaluation of SNS in Turkey even if the average score
was higher than reported in the Western countries. No difference was detected between males and females, age subgroups (< 55 years of age), and education level (with cut–off of high school).
Table 5.The subjects in upper and lower subjective noise sensitivity (SNS) groups.
Upper SNS Lower SNS
Males Females Total Males Females Total
Total 32 (53.33%) 28 (46.67%) 60 (100%) 29 (48.33%) 31 (51.66%) 60 (100%)
- Age subgroups
35> 17 (54.84%) 14 (45.16%) 31 (100%) 15 (42.86%) 20 (57.14%) 35 (100%) 35≤ 15 (51.72%) 14 (48.28%) 29 (100%) 14 (56%) 11 (44%) 25 (100%) - Education subgroups
Elementary to high school 5 (33.33%) 10 (66.67%) 15 (100%) 5 (33.33%) 10 (66.67%) 15 (100%) Two-years- or bachelor’s degree or higher 27 (60%) 18 (40%) 45 (100%) 20 (44.44%) 25 (55.56%) 45 (100%)
Table 4. Noise sensitivity scores of the study group and subgroups.
Males Females Total
Total n: 10589.22 ± 16.21 n: 10588.23 ± 19.63 n: 21088.72 ± 17.97 - Age subgroups
35> n: 5388.23 ± 16.31 n: 5890.09 ± 18.85 n: 11188.19 ± 18.42 35≤ n: 5290.23 ± 16.21 n: 4785.94 ± 20.53 n: 9989.2 ± 17.63 - Education subgroups
Elementary to high school n: 2292.14 ± 11.58 n: 3988.03 ± 19.73 n: 6189.51 ± 17.24 Two-years or bachelor’s degree or higher n: 7787.77 ± 17.19 n: 6588.32 ± 19.88 n:14288.02 ± 18.4
References
1. Moreira NM, Bryan M. Noise annoyance susceptibility. Journal of Sound and Vibration 1972; 21 (4): 449-462. doi: 10.1016/0022-460X(72)90829-2
2. Weinstein ND. Individual differences in reactions to noise: a longitudinal study in a college dormitory. Journal of Applied Psychology 1978; 63 (4): 458-466. doi: 10.1037/0021-9010.63.4.458
3. Weinstein ND. Community noise problems: evidence against adaptation. Journal of Environmental Psychology 1982; 2 (2): 87-97. doi: 10.1016/S0272-4944(82)80041-8
4. Stansfeld SA. Noise, noise sensitivity and psychiatric disorder: epidemiological and psychophysiological studies. Psychological Medicine Monograph Supplement 1992; 22: 1-44. doi: 10.1017/S0264180100001119
5. Belojevic G, Jakovljevic B. Factors influencing subjective noise sensitivity in an urban population. Noise and Health 2001; 4 (13): 17-24.
6. Belojevic G, Jakovljevic B, Slepcevic V. Noise and mental performance: personality attributes and noise sensitivity. Noise and Health 2003; 6 (21): 77-89.
7. Heinonen-Guzejev M, Vuorinen HS, Mussalo-Rauhamaa H, Heikkilä K, Koskenvuo M et al. Genetic component of noise sensitivity. Twin Research and Human Genetics 2005; 8 (3): 245-249. doi: 10.1375/twin.8.3.245
8. Klæboe R, Engelien E, Steinnes M. Context sensitive noise impact mapping. Applied Acoustics 2006; 67 (7): 620-642. doi: 10.1016/j.apacoust.2005.12.002
9. Katzenell U, Segal S. Hyperacusis: review and clinical guidelines. Otology & Neurotology 2001; 22 (3): 321-327. 10. Van Kamp I, Davies H. Noise and health in vulnerable groups:
a review. Noise and Health 2013; 15 (64): 153-159. doi: 10.4103/1463-1741.112361
11. Stansfeld SA, Clark CR, Turpin G, Jenkins LM, Tarnopolsky A. Sensitivity to noise in a community sample: II. Measurement of psychophysiological indices. Psychological Medicine 1985; 15 (2): 255-263. doi: 10.1017/S0033291700023539
12. Ellermeier W, Eigenstetter M, Zimmer K. Psychoacoustic correlates of individual noise sensitivity. The Journal of the Acoustical Society of America 2001; 109 (4): 1464-1473. doi: 10.1121/1.1350402
13. Raw GJ, Griffiths ID. Individual differences in response to road traffic noise. Journal of Sound and Vibration 1988; 121 (3): 463-471. doi: 10.1016/S0022-460X(88)80369-9
14. Stansfeld SA, Clark CR, Jenkins LM, Tarnopolsky A. Sensitivity to noise in a community sample: I. Measurement of psychiatric disorder and personality. Psychological Medicine. 1985; 15 (2): 243-254. doi: 10.1017/S0033291700023527
15. Öhrström E, Björkman M, Rylander R. Noise annoyance with regard to neurophysiological sensitivity, subjective noise sensitivity and personality variables. Psychological Medicine 1988; 18 (3): 605-613. doi: 10.1017/S003329170000828X 16. Stansfeld SA, Shipley M. Noise sensitivity and future risk of
illness and mortality. Science of the Total Environment 2015; 520: 114-119. doi: 10.1016/j.scitotenv.2015.03.053
17. Babisch W, Neuhauser H, Thamm M, Seiwert M. Blood pressure of 8–14 year old children in relation to traffic noise at home—Results of the German Environmental Survey for Children (GerES IV). Science of the Total Environment 2009; 407 (22): 5839-5843. doi: 10.1016/j.scitotenv.2009.08.016 18. Fyhri A, Klæboe R. Road traffic noise, sensitivity, annoyance
and self-reported health—A structural equation model exercise. Environment International 2009; 35 (1): 91-97. doi: 10.1016/j.envint.2008.08.006
19. Shepherd D, Welch D, Dirks KN, Mathews R. Exploring the relationship between noise sensitivity, annoyance and health-related quality of life in a sample of adults exposed to environmental noise. International Journal of Environmental Research and Public Health. 2010; 7 (10): 3579-3594. doi: 10.3390/ijerph7103580
20. Schreckenberg D, Griefahn B, Meis M. The associations between noise sensitivity, reported physical and mental health, perceived environmental quality, and noise annoyance. Noise and Health 2010; 12 (46): 7-16. doi: 10.4103/1463-1741.59995 21. Gökdag M. Study of the road traffic noise in
Erzurum-Turkey. Iranian Journal of Environmental Health Science & Engineering 2012; 9 (1): 22. doi: 10.1186/1735-2746-9-22 22. Tamer Bayazıt N, Şan Özbilen B, Savcı Özgüven Z. Subjective
and objective assessment of environmental and acoustical quality in schools around İstanbul Ataturk International Airport. ITU Journal of the Faculty of Architecture 2016; 13 (2): 101-119. doi: 10.5505/itujfa.2016.82713
23. Gokdogan O, Gokdogan C. Determination of the level of noise in nurseries and pre-schools and the teachers’ level of annoyance. Noise & Health 2016; 18 (84): 256-259. doi: 10.4103/1463-1741.192475
24. Fields JM, De Jong RG, Gjestland T, Flindell IH, Job RFS et al. Standardized general-purpose noise reaction questions for community noise surveys: Research and a recommendation. Journal of Sound and Vibration. 2001; 242 (4): 641-679. doi: 10.1006/jsvi.2000.3384
25. Ekehammar B, Dornic S. Weinstein’s noise sensitivity scale: reliability and construct validity. Perceptual and Motor Skills 1990; 70 (1): 129-130. doi: 10.2466/pms.1990.70.1.129 26. Alimohammadi I, Nassiri P, Azkhosh M, Sabet M, Hosseini
M. Reliability and validity of the Persian translation of the Weinstein noise sensitivity scale. Psychological Research 2006; 9 (1): 2.
27. Senese VP, Ruotolo F, Ruggiero G, Iachini T. The Italian version of the Weinstein nNoise sensitivity scale: measurement invariance across age, sex, and context. European Journal of Psychological Assessment 2012; 28 (2): 118-124. doi: 10.1027/1015-5759/a000099
28. Garrioch D. Sounds of the city: the soundscape of early modern European towns. Urban History 2003; 30 (1): 5-25. doi: 10.1017/S0963926803001019
29. Payer P. The age of noise: early reactions in Vienna, 1870— 1914. Journal of Urban History 2007; 33 (5): 773-793. doi: 10.1177/0096144207301420
30. Mazer SE. Music, noise, and the environment of care: history, theory, and practice. Music and Medicine 2010; 2: 182-191. doi: 10.1177/1943862110372773
31. Thurston FE. The worker’s ear: a history of noise‐induced hearing loss. American Journal of Industrial Medicine 2013; 56 (3): 367-377. doi: 10.1002/ajim.22095
32. Cohen S, Spacapan S. The social psychology of noise. Noise and Society 1984; 221-245.
33. Zimmer K, Ellermeier W. Psychometric properties of four measures of noise sensitivity: a comparison. Journal of Environmental Psychology 1999; 19 (3): 295-302. doi: 10.1006/ jevp.1999.0133
34. Kishikawa H, Matsui T, Uchiyama I, Miyakawa M, Hiramatsu K et al. The development of Weinstein’s noise sensitivity scale. Noise and Health 2006; 8 (33): 154-160. doi: 10.4103/1463-1741.34703
35. Evans GW, Lercher P, Kofler WW. Crowding and children’s mental health: the role of house type. Journal of Environmental Psychology 2002; 22 (3): 221-231. doi: 10.1006/jevp.2002.0256 36. Michaud DS, Keith SE, McMurchy D. Annoyance and
disturbance of daily activities from road traffic noise in Canada. The Journal of the Acoustical Society of America 2008; 123 (2): 784-792. doi: 10.1121/1.2821984