THE EFFECTS OF INTERNATIONAL FINANCIAL INTEGRATION ON
OUTPUT AND CONSUMPTION VOLATILITIES IN DEVELOPING
COUNTRIES
*Özgür Ergül Doç. Dr. Türkmen Göksel
Ankara Üniversitesi Ankara Üniversitesi
Doktora Öğrencisi Siyasal Bilgiler Fakültesi
● ● ● Abstract
In this paper, the effects of international financial integration on macroeconomic volatilities in developing countries are analyzed over the period 1980-2014. The following results are reported as a result of examination of macroeconomic volatility series in developing countries; average output and consumption volatilities have decreased for developing countries especially since 2000. However, relative volatility (the ratio of consumption volatility to output volatility) has increased in the 2000s compared to 1990s in some developing countries like Turkey and South Korea. In other developing countries like Brazil and Mexico, it has decreased. In the econometric part of the analysis, it has been concluded that financial openness decreases output volatilities and increases consumption volatilities. On the other hand, trade openness does not have any impact on macroeconomic volatilies. Finally, financial development increases macroeconomic volatilities.
Keywords: International Financial Integration, Output and Consumption Volatilities, Developing
Countries, Trade Openness, Capital Flows
Uluslararası Finansal Bütünleşmenin Gelişmekte Olan Ülkelerdeki Tüketim ve Milli Gelir Oynaklıklarına Etkisi
Öz
Bu makalede, uluslararası finansal entegrasyonun gelişmekte olan ülkelerdeki makroekonomik oynaklıklar üzerindeki etkisi 1980-2014 dönemi için analiz edilmiştir. Öncelikle gelişmekte olan ülkelerin makroekonomik oynaklık serileri incelenmiş ve ortalamada bu ülkelerdeki tüketim ve milli gelir oynaklıklarının 2000’li yıllarla birlikte düşmeye başladığı tespit edilmiştir. Ancak, 1990’lı yıllarla karşılaştırıldığında 2000’li yıllarda Brezilya ve Meksika gibi görece oynaklıkların (tüketim oynaklığı/milli gelir oynaklığı) azaldığı ülkelerin aksine Türkiye ve Güney Kore gibi bazı gelişmekte olan ülkelerde görece oynaklıklar artmıştır. Ekonometrik analiz bölümünde ise şu sonuçlara ulaşılmıştır: finansal entegrasyon çıktı oynaklığını azaltmakta ve tüketim oynaklığını ise artırmaktadır. Öte yandan, ticari açıklığın makroekonomik oynaklıklar üzerinde istatistiki olarak anlamlı bir etkisi bulunmamaktadır. Son olarak, finansal gelişmişlik
makroekonomik oynaklıkları artırmaktadır.
Anahtar Sözcükler: Uluslararası Finansal Bütünleşme, Çıktı ve Tüketim Oynaklıkları, Gelişmekte
Olan Ülkeler, Ticari Açıklık, Sermaye Hareketleri
* Makale geliş tarihi: 20.09.2016
The Effects of International Financial
Integration on Output and Consumption
Volatilities in Developing Countries
Introduction
For the past few decades, the global economy has changed with the developments in areas like technology, transportation, and telecommunication. Most of the capital controls have been lifted and fixed exchange rate regimes have been replaced with flexible ones. Domestic economies are now affected by economic policy decisions of foreign countries as well as their own decisions. In searching for yield, capital can flow among different countries and markets very easily. International financial integration has taken a place as economies have experienced increase in cross-country capital movements, including an active participation of local borrowers and lenders in international markets and a widespread use of international financial intermediaries. Although developed countries are the most active participants in the financial integration process, developing countries (primarily middle-income countries) have also started to participate (Schmukler, 2004: 39).
The level of international financial integration and capital flows to developing countries are determined by the pull and push factors. Push factors are related to the conditions in the world economy such as low US interest rates, the health of world economy or QE (Quantitative Easing) programs in advanced countries. On the contrary, there are pull factors related to domestic economic conditions like financial development level, institutional quality, the stability of the political system, liberalization of capital accounts and the strength of the banking system. There are different studies about which factors are more important in attracting capital inflows. Cerutti et al. (2015) find that global push factors in advanced economies mostly explain the common dynamics of capital flows to developing countries. On the other hand, Çulha (2006) reaches the conclusion that pull factors are in general dominant over push factors in determining capital flows to Turkey.
As financial market integration and capital flows to developing countries have been increasing, economists and policy makers begin to discuss the advantages and disadvantages of them. One of the advantages for developing countries is easier access to international financial markets and funding needed for their economic development process. For example, the real sector in Turkey
is under financial constraint caused by both the sector’s low profitability and the structure of domestic financial markets. Mainly due to low operating profits, Turkish firms have lower average profits compared to firms in similar developing countries like South Africa, Brazil (Özmen et al., 2012: 8). As they could not raise the capital from internal funds, they need domestic capital markets, especially the banks for funding. Due to the fact that Turkey has one of the lowest savings rates amongst similar developing countries (Özatay, 2014: 9), the only option left for funding is foreign capital. After 2001, with macroeconomic stability supported by structural reforms in banking and public finance, capital inflows have provided Turkish banks the long-term funding which enabled them to finance the Turkish real sector. Another advantage for developing countries is getting the technical know-how via capital flows, especially in cases of foreign direct investment. Aizenman et al. (2011: 16) find that the primary gain from financial integration is not to access to the pool of foreign savings but instead access to other factors of production like advanced foreign technology and know-how.
On the other hand, adverse effects of financial integration are increases of output and consumption volatilities. Increased capital mobility may cause bubbles in some sectors in the domestic economy when the economy is in expansion phase (OECD Economic Outlook, 2011: 300). In the 1997 Asian crisis, following the implosion of asset bubble in Tokyo, the capital flows from Japan created asset bubbles in South East Asian countries like Thailand and Indonesia as well (Brunnermeier and Schnabel, 2015). As another adverse effect, capital could also go out and burst bubbles in domestic economies. For example, Iceland, Ireland, Spain and most of the East European countries first experienced rapid property price increases as a result of strong capital inflows during the 2000-2007 period. Then, capital outflowed from the same countries followed by sharp house price decreases in the aftermath of the subprime mortgage crisis in 2008 (Ansel and Broz, 2015). Similarly, having a current account deficit problem, Turkish banks’ depending too much on capital inflows for funding the real sector has increased the economy’s vulnerability to a sudden stop and put Turkey into group of countries called “fragile five”. Lastly, although the theory claims that financial integration decreases macroeconomic volatilities in domestic economies through creating foreign diversification possibilities, the risk diversification opportunities may not be as large as expected as countries become similar as a result of the international financial integration process. You and Daigler (2010: 173) find that the long-held belief of the superiority of international stock market diversification may not be true anymore due to the fact that high international index correlations imply decreasing gains from diversification.
financial flows from advanced countries. During this period, some developing countries like Turkey and Argentina have experienced a number of serious economic crises due to the reversal in capital flows and sudden stops. In the recent years, although developing countries kept growing even after the recent global financial crisis, they have not been able to sustain their performances after 2014. Capital outflows from these countries and the consequent economic turmoils have resulted in slower growth rates.
Having been exposed to such disturbances, it is natural to reconsider the expected benefits of financial integration and capital flows for developing countries. In this paper, the effects of international financial integration on the macroeconomic volatilities in developing countries are analyzed with updated data. The aim is to evaluate whether the smoothing effects of international financial integration on macroeconomic volatilities have materialized. The effect of 2008 financial crisis and individual country effects on macroeconomic volatilities are also analyzed.
First, the consumption and output volatility series of emerging countries are examined. Then, the effects of international financial integration on volatilities are analyzed econometrically. For this purpose, the pooled OLS (Ordinary Least Squares) and panel data regressions are employed. The robustness of the regression results is checked with IV (Instrumental Variable) analysis by adding country specific instrumental variables to the models. The data set covers the 1980-2014 period. The country sample includes 20 developing countries with a relatively developed financial systems or big economies. As proxy variables for international financial integration, financial openness and trade openness are included into the regression. The square of financial openness is added to the model to capture the nonlinear relation between financial openness and related dependent variable. A number of variables taken from the literature like domestic financial sector development, volatility of terms of trade, GDP per capita, the volatility of inflation, volatility of fiscal policy are included as control variables. Lastly, pooled OLS regressions with dummy variables are used for detecting individual country effects and the effect of the 2008 financial crisis on macroeconomic volatilities.
The results state that on average both output and consumption volatilities have been decreasing in developing countries. However, this effect is not uniform across the sample and time. There exist periods in developing countries in which volatilities have increased. Also, relative volatilities (the ratio of consumption volatility to output volatility) have increased in some countries in the 2000s. The regression part of the analysis concludes that financial openness measured by the ratio of gross capital flows to GDP decreases output volatility and increases consumption volatility. The impacts of the trade openness on both consumption and output volatilities are insignificant. Moreover, the financial
development level increases both output and consumption volatilities.1 The
2008 financial crisis increased output volatilities. However, its impact on consumption volatilities was insignificant. Lastly, the individual country effect increases macroeconomic volatilities in some developing countries like Argentina and Turkey and decreases them in other developing countries like Bolivia.
The rest of the paper is organized as follows. The next section discusses the previous research about the effect of international financial integration on consumption and output volatilities. Section 3 presents the historic consumption and output volatility data for developing countries in detail. Section 4 discusses the econometric part of the analysis and its results. Finally, section 5 is the concluding part.
1. The Literature Review
Rodrik (2008) states that in the 1990s, there was a broad consensus on the benefits of capital flows amongst academics. Low savings and weak financial markets in developing countries were assumed to be the main obstacles in economic growth and development. Therefore, greater access to international funds from abroad and a developed financial intermediation system would provide a powerful boost to domestic investment and growth along with better consumption smoothing. Although there exist risks associated with capital flow reversals, sufficient prudential regulation and monitoring could decrease the attendant risks substantially. Interestingly, he concluded that the benefits of financial globalization are hard to find. Financial globalization has not generated increased investment or higher growth in emerging markets. Countries that have higher growth have been those that rely less on capital inflows. Financial globalization has not led to better smoothing of consumption or reduced volatility. Similarly, Easterly et al. (2001) do not find any evidence for either the stabilizing or the exacerbating role of capital flows on output volatility.
Buch et al. (2002) analyze the data of 24 OECD countries for the period 1960-2000. They conclude that there is no consistent link between financial openness and output volatility for the entire sample period. When they make the same analysis for the individual decades, they find that the sources of business cycle fluctuations change. Financial openness seems to have a diminishing
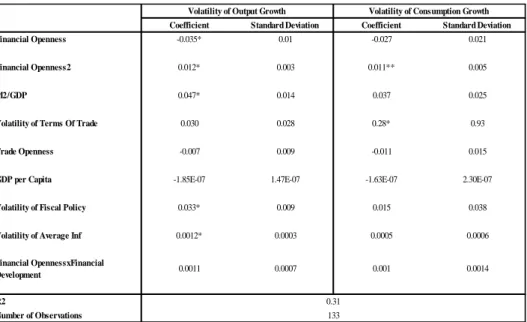
1 The significance of the interaction term for financial openness and financial development is tested in the regression analyses at Table A1. The effects of interaction term on both output and consumption volatilities are insignificant.
effect on business cycle fluctuations rather than amplifying them in 1990s contrary to the earlier decades. However, Kose et al. (2003) find that although the volatilities of output growth have declined in the 1990s compared to previous decades, on average the volatility of consumption growth relative to that of income growth has increased for financially more integrated developing countries. Also, they find little evidence that financial integration has helped developing countries to better stabilize fluctuations in consumption growth. They show that low to moderate levels of financial integration might have made some countries subject to the even greater volatility of consumption relative to that of output. Improved risk sharing and consumption smoothing effects of financial integration work only beyond a certain threshold level.
Neaime (2005) analyzes the impact of regional and international financial integration on macroeconomic volatilities in Middle East North Africa (MENA) region over the period 1980-2002. The study reveals that financial openness is associated with an increase in consumption volatility, which supports Buch et.al (2002)’s claim that improved risk sharing and consumption smoothing effects of financial integration work only beyond a certain threshold level. Also, he concludes that high degree of financial sector development reduces macroeconomic volatilities.
Instead of using net capital flows, Chen and Wang (2009) analyze the impacts of capital inflows and outflows on macroeconomic volatilities separately for a sample of 35 industrial and developing countries over the period 1970-2003. They conclude that capital outflows reduce both consumption and output volatilities. On the contrary, capital inflows increase them.
The findings of several studies about macroeconomic volatility could be summarized in following three points:
First of all, there is no concrete evidence supporting the theory that increasing financial integration decreases macroeconomic volatility and impacts output growth positively. Secondly, there are no strong results that support the claim that financial integration increases the macroeconomic volatility. Finally, in some studies, the results show that the development level of a country determines the nature of the integration-volatility relation. For a developing country, the condition for decreasing volatility during the financial integration process is stated that financial integration level of the country should exceed a certain threshold level.
2. Macroeconomic Volatilities Over Time
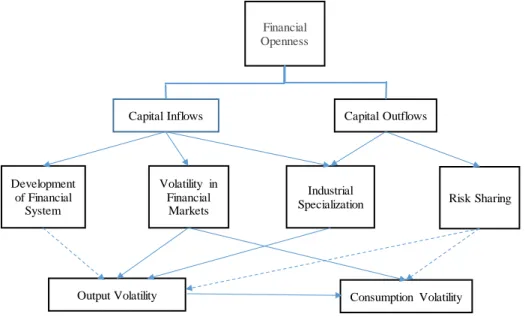
volatilities in a country through both capital inflow and outflow channels, and the effects of these channels could be different. Capital inflows could intensify industrial specialization and increase volatility in financial markets. By affecting output growth, it augments both output volatility and thereby consumption volatility. On the other hand, capital inflows also help the development of the local financial sector and the deepening of financial markets so that more stable financial sector mitigate both output and consumption volatilities. Capital outflows, the other channel, could decrease macroeconomic volatility by helping local economic agents to increase investment possibilities to diversify consumption and production risks (Chen and Wang, 2009: 2). The potential linkages between macroeconomic fluctuations and financial openness (capital inflows and outflows) are summarized in Figure 1.
Figure 1. The Linkages between Financial Openness and Macroeconomic Volatility
*Solid lines indicate positive effects and dashed lines indicate negative effects
Source: Chen and Wang, 2009: 3.
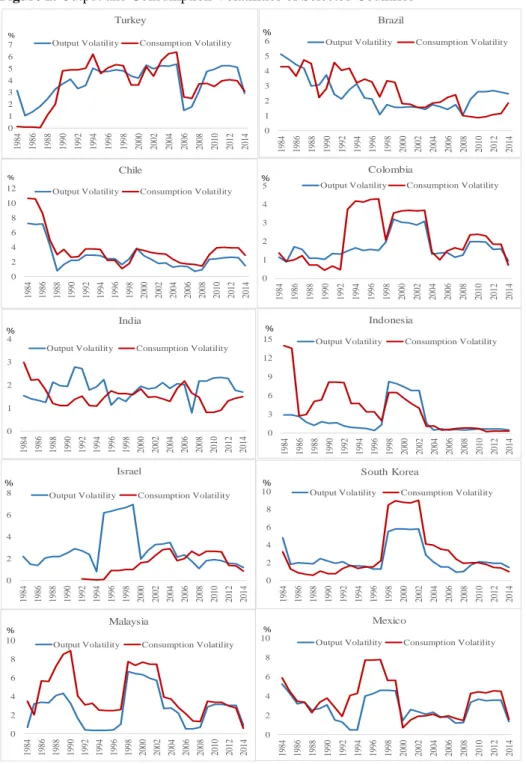
This section presents an overview of macroeconomic volatility changes in developing countries since the 1980s. Volatilities are computed over a 5-year rolling window. Figure 2 shows the consumption and output volatility series of selected developing countries starting from the second part of the 1980s.
Financial Openness
Capital Inflows Capital Outflows
Development of Financial System Volatility in Financial Markets Industrial
Specialization Risk Sharing
Developing countries seem to differentiate from each other in terms of output and consumption volatility trends. Output and consumption volatilities in Turkey, Singapore, South Africa, Argentina, Nigeria, and Pakistan do not show any sign of smoothing. In Turkey and South Africa, current account deficit problems or low saving rates increase their vulnerabilities to capital flow reversals. Singapore’s small open economy and political instabilities and weak institutional structures in Argentina, Nigeria and Pakistan make them fragile. In another group of countries which consists of Indonesia, South Korea, Malaysia, and Thailand, consumption and output volatilities increased in the second part of the 1990s, but, since then they have decreased. The current account balances of these countries have turned to surpluses after the 1997 Asian crisis which make them less vulnerable to capital flow reversals. In a third group which consists of Brazil, Chile, India, Peru, Philippines and Bolivia, volatilities first decreased and then have followed a steady pattern.
Figure 2. Output and Consumption Volatilities of Selected Countries 0 1 2 3 4 5 6 1984 1986 1988 1990 1992 1994 1996 1998 2000 2002 2004 2006 2008 2010 2012 2014 Brazil
Output Volatility Consumption Volatility
% 0 2 4 6 8 10 12 1984 1986 1988 1990 1992 1994 1996 1998 2000 2002 2004 2006 2008 2010 2012 2014 Chile
Output Volatility Consumption Volatility
% 0 1 2 3 4 5 1984 1986 1988 1990 1992 1994 1996 1998 2000 2002 2004 2006 2008 2010 2012 2014 Colombia
Output Volatility Consumption Volatility
% 0 1 2 3 4 1984 1986 1988 1990 1992 1994 1996 1998 2000 2002 2004 2006 2008 2010 2012 2014 India
Output Volatility Consumption Volatility
% 0 3 6 9 12 15 1984 1986 1988 1990 1992 1994 1996 1998 2000 2002 2004 2006 2008 2010 2012 2014 Indonesia
Output Volatility Consumption Volatility
% 0 2 4 6 8 1984 1986 1988 1990 1992 1994 1996 1998 2000 2002 2004 2006 2008 2010 2012 2014 Israel
Output Volatility Consumption Volatility
% 0 2 4 6 8 10 1984 1986 1988 1990 1992 1994 1996 1998 2000 2002 2004 2006 2008 2010 2012 2014 South Korea
Output Volatility Consumption Volatility
% 0 2 4 6 8 10 1984 1986 1988 1990 1992 1994 1996 1998 2000 2002 2004 2006 2008 2010 2012 2014 Malaysia
Output Volatility Consumption Volatility
% 0 2 4 6 8 10 1984 1986 1988 1990 1992 1994 1996 1998 2000 2002 2004 2006 2008 2010 2012 2014 Mexico
Output Volatility Consumption Volatility
% 0 1 2 3 4 5 6 7 1984 1986 1988 1990 1992 1994 1996 1998 2000 2002 2004 2006 2008 2010 2012 2014 Turkey
Output Volatility Consumption Volatility
Source: Calculated from WDI database. 0 2 4 6 8 10 12 1984 1986 1988 1990 1992 1994 1996 1998 2000 2002 2004 2006 2008 2010 2012 2014 Peru
Output Volatility Consumption Volatility
% 0 2 4 6 8 1984 1986 1988 1990 1992 1994 1996 1998 2000 2002 2004 2006 2008 2010 2012 2014 Philippines
Output Volatility Consumption Volatility
% 0 1 2 3 4 5 6 7 1984 1986 1988 1990 1992 1994 1996 1998 2000 2002 2004 2006 2008 2010 2012 2014 Singapore
Output Volatility Consumption Volatility
% 0 1 2 3 4 1984 1986 1988 1990 1992 1994 1996 1998 2000 2002 2004 2006 2008 2010 2012 2014 South Africa
Output Volatility Consumption Volatility
% 0 1 2 3 4 5 6 7 8 1984 1986 1988 1990 1992 1994 1996 1998 2000 2002 2004 2006 2008 2010 2012 2014 Thailand
Output Volatility Consumption Volatility
% 0 2 4 6 8 10 12 1984 1986 1988 1990 1992 1994 1996 1998 2000 2002 2004 2006 2008 2010 2012 2014 Uruguay
Output Volatility Consumption Volatility
% 0 1 2 3 4 5 1984 1986 1988 1990 1992 1994 1996 1998 2000 2002 2004 2006 2008 2010 2012 2014 Bolivia
Output Volatility Consumption Volatility
% 0 5 10 15 20 25 30 1984 1986 1988 1990 1992 1994 1996 1998 2000 2002 2004 2006 2008 2010 2012 2014 Nigeria
Output Volatility Consumption Volatility
% 0 1 2 3 4 5 6 1984 1986 1988 1990 1992 1994 1996 1998 2000 2002 2004 2006 2008 2010 2012 2014 Pakistan
Output Volatility Consumption Volatility
% 0 2 4 6 8 10 12 1984 1986 1988 1990 1992 1994 1996 1998 2000 2002 2004 2006 2008 2010 2012 2014 Argentina
Output Volatility Consumption Volatility
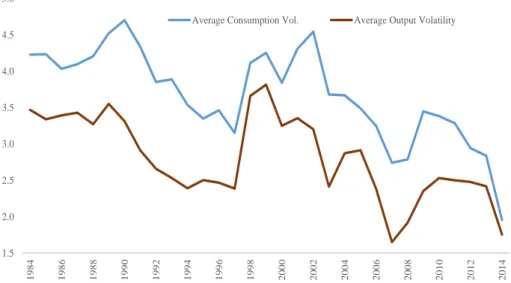
Figure 3 shows arithmetic mean values of output and consumption volatilities for developing countries. Average output volatility has been higher than the average consumption volatility and they have been moving in the same direction since the 1980s. They decreased in the first half of the 1990s when compared with the previous decade. However, after the second half of the 1990s, volatilities started to increase and almost reach to levels of the 1980s. This result can partially be explained by the fact that some of these countries like Turkey or Argentina underwent financial crises during this period. However, since the start of the 2000s, macroeconomic volatilities have decreased significantly except the period following the 2008 global financial crisis.
Figure 3. Average Consumption and Output Volatilies of Selected Developing Countries
Source: Calculated from WDI database.
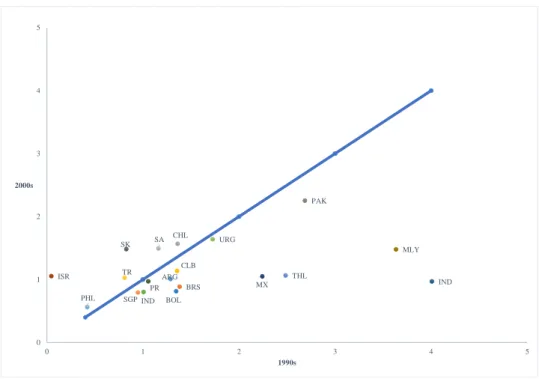
Another volatility measure which shows how much international financial integration helps to consumption smoothing is relative volatility (the ratio of consumption volatility to output volatility). Figure 4 shows the change in relative volatility in developing countries from the 1990s to the 2000s. Volatilities are computed over a 10 year period. In countries like Turkey, South Africa and Israel, relative volatility has increased. On the other hand, for a large number of other countries like Uruguay, India, Brazil, Mexico and Thailand, relative volatility has decreased.
1.5 2.0 2.5 3.0 3.5 4.0 4.5 5.0 1 9 8 4 1 9 8 6 1 9 8 8 1 9 9 0 1 9 9 2 1 9 9 4 1 9 9 6 1 9 9 8 2 0 0 0 2 0 0 2 2 0 0 4 2 0 0 6 2 0 0 8 2 0 1 0 2 0 1 2 2 0 1 4
Figure 4. Relative Volatilities of Selected Developing Countries
Source: Calculated from WDI database.
3. Empirical Analysis of Macroeconomic
Volatilities
In this section, first, we will discuss the econometric model and the variables we include in the econometric model.
Pooled OLS, fixed-effects panel, and IV regression analyses are used to examine the effect of international financial integration on consumption and output volatilities. Each regression takes the following form:
=α+θ* + ρ* + φ* + ψ* + (1)
where is the standard deviation of the dependent variable of interest for country i. and stand for financial and trade openness respectively. The
variable is added to capture any possible nonlinear relationship between
financial openness and dependent variables. Zit is a vector of control variables. For a financial openness variable, similar to Lane and Milesi-Fretti (2003: 6) we take volume-based measure defined as follows:
ARG BRS CHL CLB IND IND ISR SK MLY MX PR PHL SGP SA TR THL URG BOL PAK 0 1 2 3 4 5 0 1 2 3 4 5 2000s 1990s
Where foit refers to the financial openness variable, Clit and COit refer to the gross capital inflows and outflows respectively and GDPit refers to the gross
domestic production of country i at time t. We do not use de jure measures of financial openness in our main econometric models because many economies that have put controls on capital account transactions have found them ineffective especially in periods of capital outflows. Then, we put another complementary measure for economic openness, which is trade openness. For the measure, we use gross trade flows divided by GDP.
In the empirical analysis, in addition to the variables mentioned above, we also include a number of other control variables taken from the literature. This set of independent variables consist of a financial development indicator, the level of GDP per capita, volatility of the terms of trade, volatility of average inflation and volatility of fiscal policy. Moreover, due to the reason that we are also interested in the sensitivity and robustness of our results, in IV analysis, we add a number of country specific control variables like rural population rate, the number of scientific journals, woman labor participation rate, financial restriction index, etc to the main models. We also check individual country effects and the effect of the 2008 financial crisis on macroeconomic volatilities.
As shown in Table 1, our annual data for 20 developing countries covers the period 1980-2014. In the country selection process, there are constraints like data availability (in the case of Venezuela), whether it is a market economy (in the case of Iran or Poland before 1990) or whether it represents sample characteristics (in the case of China which could distort all data results). Data are obtained from the sources detailed in Table A2 in the appendix. The data for GDP growth and the household final consumption expenditure per capita are obtained from the World Bank's World Development Indicators (WDI). Capital flows data are obtained from IFS. It includes foreign direct investment, portfolio equity, portfolio debt, other assets and liabilities.
Table 1: Countries in the Sample
In the analysis, first, pooled OLS method is used. Similar to Lane and Milesi-Fretti (2003: 13), we start with two variable (one of them is financial openness) regression, then we add other variables to detect any change in the significance of main variables. Then, we run panel regression with the all variables of our main models. Lastly, we run IV regression which includes both the variables of our main model and country-specific variables to eliminate the possible endogeneity problem of regressors. For example, the level of consumption or output volatility could affect the level of capital flows or even trade flows. Similarly, increasing volatility could force policymakers to put capital account restrictions, which in turn influence the level of volatility (Kose et al., 2003).
In baseline regressions, the dependent variables are the standard deviation of the growth rate of the relevant variables. For the volatility measures, 4 year period as a time span is selected as parallel to panel data analysis in the article of Lane and Milesi-Fretti (2003: 12). Similar to the study of Kose et al. (2003: 11), the explanatory variables are non-overlapping averages of the underlying annual data. Volatility measures in explanatory variables are constructed with the same method used for the dependent variables.
Two tables for regression results are created. Table 2 shows the results for the regression in which the dependent variable is output volatility. Table 3 shows the results for the regression in which the dependent variable is consumption volatility.
Similar to the results of Buch et al. (2002: 17), the effect of financial openness on output volatility is negative and significant. However, the relationship is nonlinear in pool OLS regressions. For consumption volatility, only the coefficient of the quadratic term for financial openness is significant and financial openness increases the consumption volatility similar to the results of Neaime (2005: 12). The effects of trade openness on both output and consumption volatilities are not significant. On the other hand, financial sector development increases both output and consumption volatilities consistent with the results of Aghion et al. (2000: 2) which show that countries with an intermediate level of financial development are more unstable than either very developed or underdeveloped economies. Relative income level decreases the output volatility. This indicates that in developing countries, relatively developed ones have lower output volatilities. However, its effect on consumption volatility is not significant.
Changes in the terms of trade affect the volume of imports that can be purchased for a given level of exports. Therefore, it also affects the economy's real domestic income and consumption. Similar to the results in Andrews and Rees (2009: 20), we find that terms of trade volatility increases consumption volatility. However, its effect on output volatility is not significant. Similar to Kose (2003: 11) volatility of fiscal policy and volatility of average inflation are added to the models to detect the effects of discretionary fiscal and monetary policies which are common in developing countries on macroeconomic volatilities. According to the results, both volatilities of fiscal policy and inflation increase output volatility and their effects are significant. Volatility of fiscal policy also increases consumption volatility, but only in panel data analysis, its effect is statistically significant. On the other hand, the effect of volatility of inflation on consumption volatility is statistically insignificant.
V o la ti li ty o f O u tp u t G ro w th 1 2 3 4 5 6 (I V ) 7 ( P -F E ) 8 (C r is is E ff e c t) F in a n c ia l O p e n n e s s -0 .0 2 3 * * -0 .0 2 0 * -0 .0 1 9 * * -0 .0 2 3 * -0 .0 2 3 5 * -0 .0 2 4 * -0 .0 1 4 * * * -0 .0 2 1 * (0 .0 0 9 ) (0 .0 0 8 ) (0 .0 0 8 ) (0 .0 0 8 ) (0 .0 0 7 6 ) (0 .0 0 9 ) (0 .0 0 8 ) (0 .0 0 6 ) F in a n c ia l O p e n n e s s 2 0 .0 0 8 5 * * 0 .0 0 9 * * 0 .0 0 8 * * 0 .0 0 9 * 0 .0 0 9 1 * 0 .0 1 0 * * 0 .0 0 4 0 .0 0 8 6 * (0 .0 0 4 ) (0 .0 0 3 5 ) (0 .0 0 3 4 ) (0 .0 0 3 ) (0 .0 0 3 2 ) (0 .0 0 4 ) (0 .0 0 5 ) (0 .0 0 3 ) M 2 /G D P 0 .0 3 * * 0 .0 3 * * 0 .0 3 7 * 0 .0 4 1 * 0 .0 4 1 * 0 .0 4 6 * 0 .0 6 * 0 .0 4 7 * (0 .0 1 4 ) (0 .0 1 5 ) (0 .0 1 4 ) (0 .0 1 4 ) (0 .0 1 4 ) (0 .0 1 6 ) (0 .0 1 9 ) (0 .0 1 3 ) V o la ti li ty o f Te rm s O f Tr a d e 0 .0 3 1 0 .0 3 1 0 .0 3 2 0 .0 3 3 0 .0 2 7 0 .0 3 8 -0 .0 0 1 4 0 .0 2 6 (0 .0 4 7 ) (0 .0 4 6 ) (0 .0 5 ) (0 .0 3 ) (0 .0 3 ) (0 .0 3 6 ) (0 .0 4 3 ) (0 .0 2 6 ) Tr a d e O p e n n e s s -0 .0 1 -0 .0 1 3 -0 .0 1 -0 .0 1 -0 .0 0 3 -0 .0 0 2 1 -0 .0 0 4 (0 .0 1 1 ) (0 .0 1 1 ) (0 .0 0 8 ) (0 .0 0 8 4 ) (0 .0 0 9 ) (0 .0 0 9 ) (0 .0 0 8 ) G D P p e r C a p ita -2 .0 1 E -0 7 -2 .0 8 E -0 7 -1 .8 3 E -0 7 -2 .6 1 E -0 7 -4 .4 2 E -0 7 * * -1 .9 5 E -0 7 (1 .5 0 E -0 7 ) (1 .4 7 E -0 7 ) (1 .4 8 E -0 7 ) (1 .7 6 E -0 7 ) (1 .8 2 E -0 7 ) (1 .4 9 E -0 7 ) V o la ti li ty o f F is c a l P o li c y 0 .0 3 3 * 0 .0 3 3 4 * 0 .0 3 2 * 0 .0 3 1 * 0 .0 3 4 6 * (0 .0 0 9 ) (0 .0 0 9 ) (0 .0 0 9 ) (0 .0 0 1 1 ) (0 .0 0 9 ) V o la ti li ty o f A v e ra g e I n f 0 .0 0 1 * 0 .0 0 1 * * 0 .0 0 1 1 * * 0 .0 0 1 * (0 .0 0 0 3 ) (0 .0 0 0 7 ) (0 .0 0 0 5 ) (0 .0 0 0 3 ) C ri s is Ef fe c t 0 .8 7 * (0 .3 4 ) R2 0 .0 6 0 .0 7 0 .0 8 0 .2 8 0 .3 1 0 .3 8 0 .4 6 0 .3 3 N u m b e r o f O b s e rv a ti o n s 133 133 133 133 133 120 120 133 T h e s y m b o ls * , * * a n d * * * i n d ic a te st a ti st ic a l si g n ifi c a n c e a t th e 1 p e rc e n t, 5 p e rc e n t a n d 1 0 p e rc e n t le v e ls re sp e c ti v e ly T h e n u m b e rs i n p a ra n th e si s sh o w s ta n d a rt e rro rs . T a ble 2 . R eg res sio n s R e su lts : V o la ti li ty o f O u tp u t G ro w th
V o la ti li ty o f C o n s u m p ti o n G ro w th 1 2 3 4 5 6 (I V ) 7 ( P -F E ) 8 (C r is is E ff e c t) F in a n c ia l O p e n n e s s -0 .0 1 7 -0 .0 1 6 -0 .0 1 4 -0 .0 1 6 -0 .0 1 6 -0 .0 6 2 -0 .0 3 2 -0 .0 1 5 (0 .0 1 5 ) (0 .0 1 7 ) (0 .0 1 6 ) (0 .0 1 6 ) (0 .0 1 6 ) (0 .0 8 1 ) (0 .0 5 ) (0 .0 1 5 8 ) F in a n c ia l O p e n n e s s 2 0 .0 1 * * * 0 .0 0 9 9 * * * 0 .0 0 9 * * * 0 .0 0 9 6 * * * 0 .0 0 9 * * * 0 .2 9 * * * 0 .2 2 * * * 0 .0 0 9 * * * (0 .0 5 ) (0 .0 0 5 ) (0 .0 0 5 ) (0 .0 0 5 ) (0 .0 0 5 ) (0 .1 6 ) (0 .1 1 ) (0 .0 0 5 ) M 2 /G D P 0 .0 4 * * * 0 .0 4 2 * * * 0 .0 4 5 * * * 0 .0 4 7 * * 0 .0 4 7 * * * 0 .0 5 * * * 0 .0 9 * * 0 .0 3 7 (0 .0 2 3 ) (0 .0 2 3 ) (0 .0 2 4 ) (0 .0 2 4 ) (0 .0 2 4 ) (0 .0 3 ) (0 .0 3 ) (0 .0 2 5 ) V o la ti li ty o f Te rm s O f Tr a d e 0 .2 8 6 * 0 .2 8 * 0 .2 8 * 0 .2 8 * 0 .2 8 0 * 0 .1 6 * * 0 .0 8 0 .0 2 8 * (0 .0 9 0 7 ) (0 .0 9 ) (0 .0 9 1 ) (0 .0 9 ) (0 .0 9 3 ) (0 .0 6 7 ) (0 .0 5 ) (0 .0 9 2 ) Tr a d e O p e n n e s s -0 .0 1 2 -0 .0 1 3 -0 .0 1 1 -0 .0 1 1 -0 .0 1 4 -0 .0 1 2 -0 .0 1 3 (0 .0 1 5 ) (0 .0 1 6 ) (0 .0 1 4 ) (0 .0 1 3 ) (0 .0 1 9 ) (0 .0 1 4 ) (0 .0 1 3 8 ) G D P p e r C a p ita -1 .8 2 E -0 7 -1 .8 5 E -0 7 -1 .7 1 E -0 7 -5 .2 0 E -0 9 1 .3 4 E -0 7 -1 .6 5 E -0 7 (2 .2 0 E -0 7 ) (2 .2 1 E -0 7 ) (2 .2 5 E -0 7 ) (2 .3 6 E -0 7 ) (2 .7 1 E -0 7 ) (2 .3 2 E -0 7 ) V o la ti li ty o f F is c a l P o li c y 0 .0 1 3 0 .0 1 4 0 .0 0 7 0 .0 0 6 * 0 .0 1 5 (0 .0 3 8 ) (0 .0 3 8 ) (0 .0 3 4 ) (0 .0 0 1 8 ) (0 .0 3 8 ) V o la ti li ty o f A v e ra g e I n f 0 .0 0 1 8 .1 9 E -0 4 0 .0 0 1 1 0 .0 0 1 (0 .0 0 0 5 ) (8 .8 4 E -0 4 ) (0 .0 0 0 9 ) (0 .0 0 0 5 ) C ri s is Ef fe c t 0 .0 3 1 (0 .6 4 5 ) R2 0 .2 4 0 .2 4 0 .2 5 0 .2 6 0 .2 6 0 .3 9 0 .3 8 0 .2 6 N u m b e r o f O b s e rv a ti o n s 131 131 131 131 131 114 114 131 T h e s y m b o ls * , * * a n d * * * i n d ic a te st a ti st ic a l si g n ifi c a n c e a t th e 1 p e rc e n t, 5 p e rc e n t a n d 1 0 p e rc e n t le v e ls re sp e c ti v e ly T h e n u m b e rs i n p a ra n th e si s sh o w s ta n d a rt e rro rs . T a ble 3 . R eg res sio n s R e su lts : V o la ti li ty o f Co n su m p ti o n G ro w th
For the effect of the 2008 financial crisis on macroeconomic volatilities, it is concluded that it has increased output volatilities, however, its impact on consumption volatilities is insignificant.
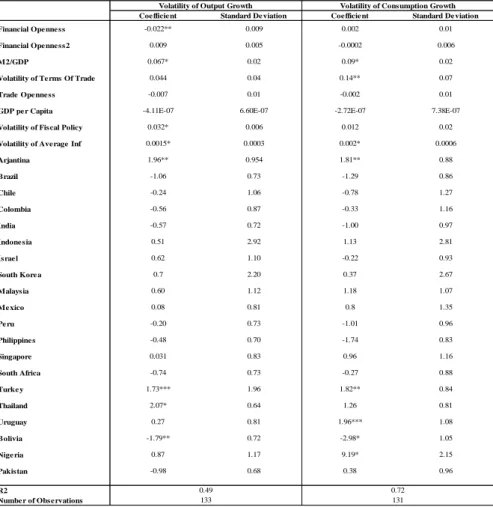
Table 4 shows individual country effects on output and consumption volatilities. In Argentina, Turkey and Thailand, the individual country effect increases output volatility, whereas in Bolivia it decreases output volatility. In other countries, individual country effects on output volatilities are insignificant. In consumption volatilities, the country effect is significant and positive for Arjantin, Uruguay, Turkey and Nigeria whereas in Bolivia, the effect is significant and negative. In other countries, individual country effects are not significant.
Table 4. OLS Regressions With Country Dummies
Coe fficie nt Standard De viation Coe fficie nt Standard De viation
Financial Ope nne ss -0.022** 0.009 0.002 0.01
Financial Ope nne ss2 0.009 0.005 -0.0002 0.006
M2/GDP 0.067* 0.02 0.09* 0.02
Volatility of Te rms Of Trade 0.044 0.04 0.14** 0.07
Trade Ope nne ss -0.007 0.01 -0.002 0.01
GDP pe r Capita -4.11E-07 6.60E-07 -2.72E-07 7.38E-07
Volatility of Fiscal Policy 0.032* 0.006 0.012 0.02
Volatility of Ave rage Inf 0.0015* 0.0003 0.002* 0.0006
Arjantina 1.96** 0.954 1.81** 0.88 Brazil -1.06 0.73 -1.29 0.86 Chile -0.24 1.06 -0.78 1.27 Colombia -0.56 0.87 -0.33 1.16 India -0.57 0.72 -1.00 0.97 Indone sia 0.51 2.92 1.13 2.81 Israe l 0.62 1.10 -0.22 0.93 South Kore a 0.7 2.20 0.37 2.67 Malaysia 0.60 1.12 1.18 1.07 Me xico 0.08 0.81 0.8 1.35 Pe ru -0.20 0.73 -1.01 0.96 Philippine s -0.48 0.70 -1.74 0.83 Singapore 0.031 0.83 0.96 1.16 South Africa -0.74 0.73 -0.27 0.88 Turke y 1.73*** 1.96 1.82** 0.84 Thailand 2.07* 0.64 1.26 0.81 Uruguay 0.27 0.81 1.96*** 1.08 Bolivia -1.79** 0.72 -2.98* 1.05 Nige ria 0.87 1.17 9.19* 2.15 Pakistan -0.98 0.68 0.38 0.96 R2
Numbe r of Obse rvations
The symbols *, ** and *** indicate statistical significance at the 1 percent, 5 percent and 10 percent levels respectively 131 0.49
133
Volatility of Consumption Growth Volatility of Output Growth
Conclusion
In this paper, the impacts of international financial integration on macroeconomic volatilities in developing countries are analyzed. Firstly, the economic literature is reviewed, and it is concluded that the economic literature does not provide clear results for the effects of international financial integration on macroeconomic volatilities.
Then, output and consumption volatility series of developing countries are examined and it is concluded that on average, macroeconomic volatilities have been decreasing in developing countries in time. However, this trend is not uniform throughout the sample. For Brazil, Mexico and India, the macroeconomic volatilities have decreased as the theory expects. However, in other countries like Turkey, South Africa and Argentina, volatilities have not shown any sign of smoothing. The relative volatilities have acted differently in different country sets as well. From 1990s to 2000s, the relative volatilities have risen in Turkey, South Korea and Israel in contrast to countries like Uruguay, Brazil and Mexico in which the relative volatilities have fallen during the same period.
The results of the econometric analysis show that financial openness decreases output volatility, but it increases consumption volatility. The impacts of trade openness on consumption and output volatilities are insignificant. Lastly, the financial development level increases both output and consumption volatilities
Reference
Aghion, Philippe, Philippe Bacchetta and Abhhijit Banerjee (2000), “Capital Markets and the Instability of Open Economies”, CEPR Discussion Papers 2083.
Aizenman, Joshua, Yothin Jinjarak and Donghyun Park, (2011), “Capital Flows and Economic
Growth in the Era of Financial İntegration And Crisis, 1990-2010”, Open Economies
Review, 24 (3): 371-396.
Andrews, Dan and Daniel Rees (2009), “Macroeconomic Volatiliy and Terms of Trade Shocks”,
Reserve Bank of Australia Research Discussion Paper 2009-05.
Ansell, Ben and Lawrence Broz (2015), “Global Capital Markets, Housing Prices, and Partisan
Fiscal Policies”, SRC Discussion Paper, No 31., Systemic Risk Centre, The London School of Economics and Political Science (London).
Brunnermeier, Markus and Isabel Schnabel, (2015), “Bubbles and Central banks: Historical Perspectives”, CEPR Discussion Papers 10528.
Buch, M. Claudia, Jörg Döpke and Christian Pierdzioch (2002), “Financial Openness and Business
Cycle Volatility”, Kiel Institute of World Economics Working Paper 1121.
Chen, Shiu-Sheng and Chien-Chiang Wang (2009), “Financial openness and Macroeconomic Volatility: An Empirical Investigation”, http://grid.ntu.edu.tw/projects/pro103/pro103.pdf (20.09.2016).
Cerutti, Eugenio, Stjn Claessens and Damien Puy (2015), “Push Factors and Capital Flows to
Emerging Markets: Why Knowing Your Lender Matters More Than Fundamentals”, IMF
Working Papers 15/127.
Culha, Ali (2006), “A Structural VAR Analysis of the Determinants of Capital Flows into Turkey”,
Central Bank Review, 2: 11-35.
Easterly, Wiliam R., Roumeen Islam and Joseph Stiglitz (2001), “Shaken and Stirred: Explaining
Growth Volatility”, Annual World Bank Conference on Development Economics 2000-
Washington,191-211.
Kose, M. Ayhan, Eswar S. Prasad and Marco E. Terrones (2003), “Financial Integration and
Macroeconomic Volatility”, IMF Staff Papers (Washington: International Monetary Fund),
50: 119-142.
Kose, M. Ayhan, Eswar S. Prasad and Marco E. Terrones (2006), “How does trade and financial
integration affect the relationship between growth and volatility?”, Journal of International
Economics, 69 (1): 176-202.
Lane, Philip R. and Gian Maria Milesi-Ferretti (2003), “International Financial Integration”, IMF Staff
Papers (Washington: International Monetary Fund), 50: 82-113.
Neaime, Simon (2005), “Financial Market Integration and Macroeconomic Volatility in the MENA
Region: An Empirical Investigation”, Review of Middle East Economics and Finance, 3
(3): 231-253.
OECD Economic Outlook (2011), Volume 2011 Issue 1 (No. 89 May)
Özatay, Fatih (2013), “Turkey’s Distressing Dance with Capital Flows”, Working Papers 1306, (Ankara: TOBB University of Economics and Technology, Department of Economics). Özmen, Erdal, Saygı Şahinöz ve Cihan Yalçın (2012), “Profitability, Saving and Investment of
Non-Financial Firms in Turkey”, Working Papers 1214 (Ankara: Research and Monetary Policy
Department, TCMB).
Rodrik, Dani and Arvind Subramanian (2008), “Why Did Financial Globalization Disappoint?”, IMF
Staff Papers, 56 (1).
Schmukler, Sergio L. (2004), “Financial Globalization: Gain and Pain for Developing Countries”,
Economic Review, Federal Reserve Bank of Atlanta, Second Quarter: 39-66.
You, Leyuan and Robert T. Daigler (2010), “Is International Diversification Really Beneficial”,
Appendix
Table A1. OLS Regressions With Interaction Terms
Table A2. Description of Dataset and Sources
The data used in the analysis are downloaded from World Bank's World Development Indicators (WDI), IMF's International Financial Statistics (IFS). The variables are described below.
Variable description Source
GDP growth, annual % growth WDI
Consumption growth, annual % growth WDI
GDP per capita,constant LCU. WDI
Trade, imports +exports, percent of GDP, WDI
Net barter terms of trade index (2000=100) IMF
Inflation, consumer prices (annual %), IFS
Financial Openness IFS
Money and quasi-money (M2) as % of GDP IMF, WDI
General Government Consumption Expenditure, constant LCU WDI
Coefficient Standard Deviation Coefficient Standard Deviation
Financial Openness -0.035* 0.01 -0.027 0.021
Financial Openness2 0.012* 0.003 0.011** 0.005
M2/GDP 0.047* 0.014 0.037 0.025
Volatility of Terms Of Trade 0.030 0.028 0.28* 0.93
Trade Openness -0.007 0.009 -0.011 0.015
GDP per Capita -1.85E-07 1.47E-07 -1.63E-07 2.30E-07
Volatility of Fiscal Policy 0.033* 0.009 0.015 0.038
Volatility of Average Inf 0.0012* 0.0003 0.0005 0.0006
Financial OpennessxFinancial
Development 0.0011 0.0007 0.001 0.0014
R2
Number of Observations
The symbols *, ** and *** indicate statistical significance at the 1 percent, 5 percent and 10 percent levels respectively 0.31
133
As an instrumental variables, we use capital account restrictions data from the Chinn-lto index and series of total population, rural population (% of total population), manufacturing value added (% of GDP), electricity production from nuclear sources (% of total), fertility rate (births per woman), ores and metals exports (% of merchandise exports), agriculture value added (% of GDP), cereal yield (kg per hectare), electric production from oil sources, electric production from hydroelectric sources, labor force participation rate for ages 15-24, Manufactures exports (% of merchandise exports), ores and metals exports (% of merchandise exports), ores and metals imports (% of merchandise imports), scientific and technical journal articles from WDI database.