Breathing Detection Based on the Topological
Features of IR Sensor and Accelerometer Signals
Fatih Erden and A. Enis Cetin
Department of Electrical and Electronics Engineering Bilkent University
Ankara, Turkey
Email: [email protected], [email protected]
Abstract—This paper describes a non-contact breathing detec-tion system using a pyro-electric infrared (PIR) sensor and an accelerometer. The multi-sensor system can be used to detect the respiratory disorders. A PIR sensor is placed onto a stand near a bed and an accelerometer is placed on the mattress. We recently developed a PIR sensor which is capable of producing 1-D time-varying signals corresponding to the motions in its field of view. The PIR sensor signal due to the thoracic movements turns out to be an almost periodic signal. Similarly, the accelerometer pro-duces an almost periodic signal in response to vibrations in bed. Sensor signals are processed using a topological approach. Point clouds are constructed from the delay-coordinate embedding of the time series sensor data first. Then, periodic structures in the point clouds are detected using persistent homology. The sensors, with the proposed method, complement each other to produce more accurate decisions in different lying positions.
I. INTRODUCTION
Respiratory activity is one of the most import vital signs in assessing the physical and psychological health of people. It is a good predictor of the level of anxiety [1]. Alterations in respiratory function are known to be the early indicators of a cardiac arrest, lung and heart diseases such as pneumonia [2]. Therefore tracking the respiratory activities of individuals is a crucial tool in hospitals, intensive care units, and home medical care services to complement pharmacological approaches to treating the diseases. Respiratory monitoring systems can be categorized into two groups according to the sensor types employed: (i) systems which use wearable sensors, and (ii) systems which use sensors that measure the human’s near-environment. The first group includes electromagnetic biosen-sor, wearable actigraphy and bioimpedance devices based systems [3]–[5]. Radar sensors, pressure sensors, and infrared cameras may be given as examples of the second group [6]– [8]. Cost, privacy issues, user convenience and measurement accuracies determine the choice of the system to use.
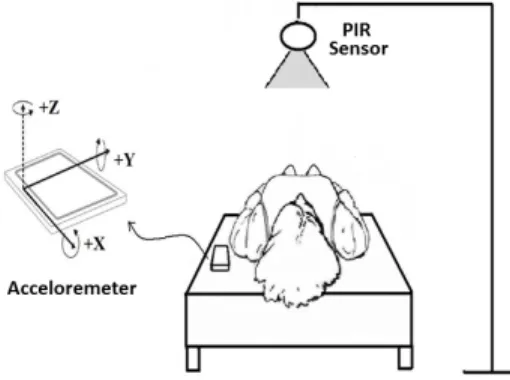
In this paper, we propose a multi-sensor system and a method to detect the breathing activity of a person lying in bed. The system is similar to the one previously described in [9] and it consists of a single pyro-electric infrared (PIR) sensor and an accelerometer. During inhalation, the chest of the human expands and becomes closer to the PIR sensor and when the person exhales, the chest contracts and moves away from the sensor. These body movements can be captured by a PIR sensor in the form of almost periodic signals. The
Fig. 1. Breathing activity detection system.
vibrations in the bed due to the breathing activity also exhibits a periodic behaviour and can be sensed by the accelerometer. The sensors, with the proposed set-up, complement each other making the system more robust to different lying positions. We use persistent homology as a topological data analysis tool to detect the periodicity in the sensor signals. Time-delay coordinate embedding is a widely used method in the analysis of dynamical systems [10], [11]. Sensor signals are expressed in terms of delay-coordinate embeddings and mapped into the geometric objects called simplicial complexes. The underlying topological structure is interpreted using barcodes. We show that the barcodes are stable under perturbations of the data and the topological features are preserved even when the data is subsampled to its 3% size.
The remainder of the paper is organized as follows. System set-up is described in Section II. Extraction of the delay-coordinate embeddings from the sensor signals and their topological characterization is explained in Section III. Exper-imental results are presented in Section IV, and finally Section V concludes the paper.
II. SYSTEMDESCRIPTION
The multi-sensor breathing detection system comprises of a PIR sensor and an accelerometer. PIR sensors and accelerom-eters are both low-cost passive devices and used to detect the moving bodies from stationary objects. In the proposed set-up, the PIR sensor is located onto a stand near a bed and the ac-celerometer is attached on the mattress of the bed as shown in Fig. 1. Thoracic movements and the vibrations in the bed due
to the breathing activity are detected by the PIR sensor and the accelerometer, respectively. Corresponding sensor signals are then transferred to a general-purpose computer and processed to recognize the breathing activity.
A. PIR Sensor
A PIR sensor functions by measuring the difference in infrared radiation between the two pyro-electric elements inside of it. This difference occurs due to the movement of hot bodies in the viewing range of the sensor and is outputted as a time-varying voltage signal. When the two pyro-electric elements are subject to the same infrared radiation level, the effect of one negates the effect of the other and the sensor eventually generates an almost constant offset voltage signal. Commercially available PIR sensors use the binary outputs produced by an additional comparator structure in their cir-cuits. A binary ”1” is sent to the controller if there are activities from a hot body and a binary ”0”, otherwise. The capability of those sensors are limited to on/off mode operations and it is not possible to achieve smart monitoring systems. However, a continuous-time analog signal, which corresponds to the amplitude of the voltage signal and represents the transient behaviour of the sensor circuit, can be captured as described in [12]. These analog signals provide more rich content related to the motions in the area being viewed and more complicated tasks can be accomplished by processing them.
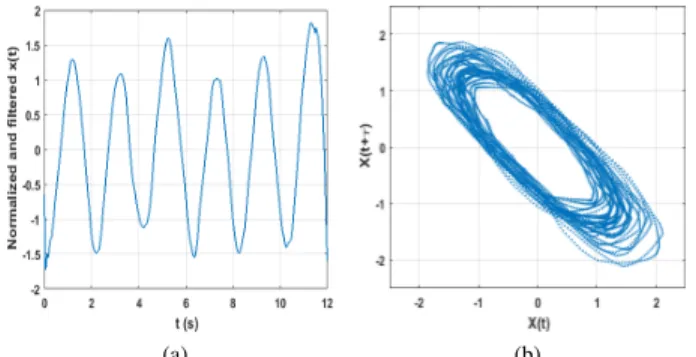
The analog output signal obtained form the modified PIR sensor circuit is digitized using an analog-to-digital converter and transferred to the computer for further processing. The respiratory rate for an adult at rest is 12-20 breaths\minute and increases to 30-50 breaths\minute in an exercise testing [13]. Thus, the breathing activity is said to be a low-frequency activity with the highest frequency ∼1 Hz and the sensor signal should be sampled at a rate equal to at least 2 Hz. A typical PIR sensor signal x(t) (sampled at 100 Hz and digitized using 8-bit quantization) due to a person lying on the bed and breathing normally is shown in Fig. 2(a). The distance between the PIR sensor and the person is 0.5 m. B. Accelerometer
Accelerometers designed to measure vibration are either based on the piezoelectric effect or electromechanical energy conversion. All of the commercially available wearable fall detection systems are based on accelerometers. They convert vibrations into electrical signals depending on the intensity of the vibration waves in the axis of the accelerometer.
In this study, a 3-axis accelerometer embedded in a mobile phone is used to detect the vibrations that occur in bed due to the breathing activity. When the accelerometer is placed on the bed frame as in Fig. 1, the relevant information come from the x and y axes. The signals representing the intensity of the vibrations in these axes, x(t) and y(t), are denoted by a single signal v(t), where v(t) = px2(t) + y2(t). Accelerometer
output, which is recorded for the same activity as of Fig. 2(a) and sampled at 100 Hz, is depicted in Fig. 2(b). Note that the output signal is almost periodic for both of the sensors and the
(a)
(b)
Fig. 2. 12-second long (a) PIR sensor and (b) accelerometer signal due to normal breathing activity.
person takes a breath approximately in every 1.9 seconds. The topological approach to be described in the next section makes use of this property to detect whether a regular breathing activity takes place.
III. METHOD
This section describes the steps of the topological method used to discover the quasi-periodic patterns in the sensor signals. Data received from the sensors is split into frames of certain lengths and each frame is analysed by applying the same procedure repeatedly. The results of analyses carried out for each sensor are fused and expressed as a single decision at the end of each frame.
Prior to proceeding with the topological analysis, a pre-processing algorithm takes place, in which the sensor data is normalized and filtered by a moving average filter. The former avoids the inconsistencies between the data from different types of sensors and the latter, by removing the noise, makes the quasi-periodic patterns in the breathing signals more conspicuous. Normalized and filtered PIR sensor signal in Fig. 2(a) is depicted in Fig. 3(a). Following the preprocessing step, point clouds are constructed from the sensor signals using the delay-coordinate embedding method. Finally, persistent homology is applied to the point clouds to search for the breathing activity related features. The discussion will be carried out, for simplicity, in terms of the PIR sensor signal. A. Point Clouds
Topology deals with the intrinsic geometric properties of the objects. The objects are assumed to be the point clouds in this study. A point cloud is a finite set of points that are equipped
(a) (b)
Fig. 3. (a) PIR sensor signal after preprocessing and (b) the corresponding delay-coordinate embedding with τ = 0.2s.
with a notion of distance. We use time-delay coordinate embeddings of the digital sensor signals to construct the point clouds. Delay-coordinate embedding method defines a multidimensional space where each dimension subsumes a delayed version of a time series signal [14]. That is, given a time series x(t) and an embedding dimension m, a vector quantity of m components can be described as follows:
X(t) = {x(t), x(t + τ1), x(t + τ2), . . . , x(t + τm−1)}, (1)
where τiis time delay constant. Transformation of a signal for
each choice of the delay times and the embedding dimension results in a different geometry. Thus, these parameters should be determined such that the resulting geometry reveals the problem-specific features. This can be done either experimen-tally or by using some prior knowledge about the signal.
We use (1) with m = 2 and construct a point cloud by specifying the coordinates of the points in Euclidean space. The selection of the delay constant τ is critical. If it is too small, the points are aligned on a straight line and if it is too large, successive points may become uncorrelated. In both cases, the point cloud cannot exhibit the desired features. We determine the delay constant by making use of the autocorrelation function (ACF) of the signal x(t) as suggested in [15]. The ACF of the time-varying signal x(t),
Rx(t) =
X
n
x(n)x(n + t) (2)
is computed first. Then, τ is selected such that t1< τ < t2,
where t1and t2 are the first and the second critical points of
Rx(t). Delay-coordinate embedding of the PIR sensor signal
with τ = 0.2s is shown in Fig. 3(b). It exhibits an elliptical structure with a clean hole in the center. Note that this is the case when an almost periodic signal is of concern. The homological analysis will investigate the presence of this hole structure in the point cloud.
B. Persistent Homology
Homology is an algebraic method which enables us to infer topological features, such as components, holes and voids, from the samples of geometric objects. A topological space can be approximated by a set of combinatorial objects called simplicial complexes. A simplicial complex is built
(a) (b)
Fig. 4. Point cloud subsampling, (a) randomly and (b) by maxmin method, with a ratio of 60 to 1.
from vertices, edges, triangular faces, and higher dimensional analogues, called simplices; a point is a 0-dimensional sim-plex, an edge between two points is a 1-dimensional simsim-plex, a triangular face is a 3-dimensional simplex, and so on. If the intersection of any two simplices is also a simplex, then they together form a simplicial complex. Once the space in which the geometric object resides is mapped into simplicial complexes, the underlying topology can be analysed by ap-plying homology. Homology counts the number of connected components, holes, and other high dimensional surfaces so that can classify the topologically equivalent spaces.
The geometric objects of interest here are the point clouds sampled from the delay-coordinate embeddings of the sensor signals. Since the construction of the simplicial complexes by treating all the members of a point cloud as vertices is computationally expensive, we first consider reducing its size. A point cloud Z can be subsampled to a set of vertices, called landmark points, L ⊂ Z using two standart methods: randomly or by maxmin algorithm proposed in [16]. The first is to choose the landmarks randomly from the point cloud, while the second is an inductive selection process. 100 landmark points subsampled from the point cloud of Fig. 3(b), including 6000 points, for the two methods is shown in Fig. 4. Subsets produced by both methods seem to possess the same topological structure, especially the larger hole in the center, with the original point cloud. Landmarks selected by the maxmin method tend to cover the dataset and to be more evenly spaced. This makes it a better choice to avoid the detection of noise as a topological attribute.
Next step is to express the sampled point cloud L in terms of simplicial complexes. One way to construct these complexes is to choose a scale parameter r and draw balls of radius r/2 around each points. If any two points {li, lj} ∈ L are
no further apart than r, i.e., the Euclidean balls, B(li, r/2)
and B(lj, r/2), have non-empty intersection, then these points
are connected with an edge. If there exits three points that are pairwise connected to form a triangle, then the triangle is filled in with a two dimensional face. When all the complete simplices are filled in similarly, we obtain the Vietoris-Rips complex [17]. It can be denoted by V R(L, r), where L is the set of vertices and r is the distance metric. Note that other methods, such as wittness and ˇCech constructions, can also
be employed to build simplicial complexes.
Finally, we apply homology to simplicial complexes to de-tect the presence of a central hole in the sampled point cloud. Homology provides a way of summarizing the topological structure of a space in the form of so-called Betti numbers. βk gives the number of k-dimensional holes, e.g., β0 is the
number of connected components, β1is the number holes, β2
is the number of voids, and so on.
The problem is how to choose the scale parameter r. If r is too small, then homology detects many holes which refer, not to dominant features, but just to noise. On the other hand, if it is too large, then any two points get connected and we end up with a trivial homology. Hence, rather than a fixed value of r, a more useful knowledge of the space can be obtained by considering a range of values. By this way, we have a sequence of simplicial complexes, called a filtration V R(L, t), with the property that
V R(L, t1) ⊂ V R(L, t2), t1< t2. (3)
That is, a simplicial complex constructed for a smaller scale parameter is a subset of the simplicial complex constructed for a larger one.
Each hole appears and disappears at a particular filtration time and the persistence of this hole can be represented as a pair (ti, tf) that is referred to as Betti or persistence interval.
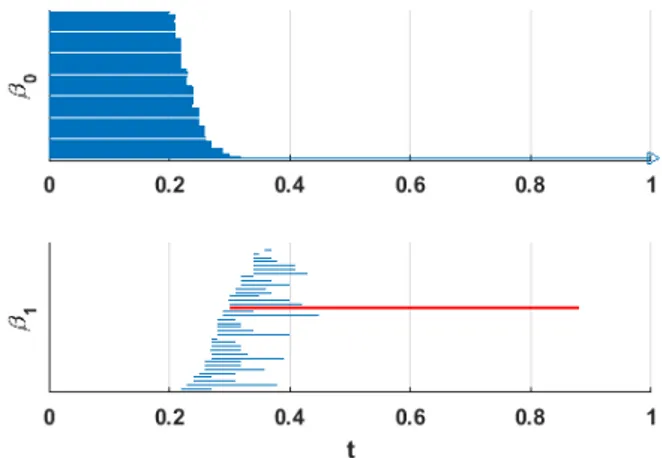
We are interested in the persistence intervals that last for a long period of filtration time. Each persistence interval can be visualized as a bar covering the lifetime of the corresponding edge or hole. The collection of bars is called the barcode. The barcodes for the first two Betti numbers of the point cloud sampled by the maxmin method is depicted in Fig. 5. The horizontal axis in the barcode plot is the filtration time. The βk number at time t is the number of bars at dimension k
that cross the vertical line at time t. As the filtration time progresses, the complex becomes gradually connected; each component joins to another and they eventually form a single complex at t = 0.3. Similarly, as t increases, small holes start to appear but they are quickly filled in and die at a nearby time. However, the large central hole, represented by the red bar, survives significantly longer than the others. We hereby conclude that the short bars represent noise and the long bars indicate topological features.
IV. EXPERIMENTS ANDRESULTS
In the experiments, data acquired from the PIR sensor and the accelerometer is split into frames of length 30 seconds and analysed individually. Two-dimensional delay-coordinate embeddings are generated from the sensor data. Topologi-cal data analysis, in particular persistent homology, studies the intrinsic geometric properties of a space, so that it is coordinate-free. That is, while obtaining the delay-coordinate embeddings, one can choose any axis for the original signal and the delayed version of it. Delay-coordinate embeddings are subsampled with a ratio of 60 to 1 using the maxmin method. Resulting point clouds after subsampling should be checked if they possess the same topolgocial structure with the original
Fig. 5. Barcodes for the PIR sensor breathing signal. The red bar corresponds to the central hole in the point cloud.
(a) (b) (c)
Fig. 6. (a) No-activity PIR sensor signal and the corresponding (b) sampled point cloud, and (c) barcode plots.
data. If not, lower sampling ratios should be considered. Point clouds are then transformed into simplicial complexes using Vietoris-Rips construction and the topological invariants are investigated with the help of persistent homology.
We use javaplex library [18] to compute the persistent homology. The inputs to the proposed algorithm are the point cloud data, maximum dimension in which the persistent homology will be computed, maximum filtration time, and number of time divisions. The parameters are problem-specific and should be selected carefully. Since we are dealing with the detection of holes, we are computing up to first dimensional persistent homology. Maximum filtration time is selected as tmax = 1, and the number of divisions is 100. The larger
the values of these parameters, the higher the computational complexity. On the other hand, they should be large enough to capture the dominant features.
We use Betti numbers and the intervals to analyse the recorded activity. If there is a single bar representing a hole, i.e., β1 = 1, with (tf − ti) > T , then it means an almost
periodic signal is captured and it is referred to a regular breathing activity. If such a bar does not exist, then the frame is affiliated to an aperiodic signal. An example is demonstrated in Fig. 6 for a “no-activity” PIR sensor signal. Since there is not a significant bar, representing a large central hole, the signal may be referred to as either an ordinary body movement or a respiratory disorder such as sleep apnea. Ordinary body movements, such as rolling in bed, produce large-amplitude
TABLE I
SUCCESSRATES FOR THERECOGNITION OF AREGULARBREATHING
ACTIVITYOVER300 TESTSIGNALS FOREACHLYINGPOSITION. PIR only Accelerometer only PIR|Accelerometer Supine 281 (94%) 176 (59%) 292 (97%)
Prone 221 (74%) 273 (91%) 284 (95%) Side-lying 269 (90%) 223 (74%) 281 (94%)
signals and can easily be distinguished from the other types of motions. Therefore, if a signal is not periodic and also does not belong to an ordinary body movement, then a respiratory disorder is concluded.
10 subjects that are not associated with a respiratory dis-order are asked to lie on a bed in different positions, i.e., supine, prone, and side-lying positions, and breath normally. 10 breathing activities, each of which lasts for 30 seconds, are recorded for each subject and lying position. That is, we have 300 test signals in total for each position. Test results are presented in Table I. We first look at the individual performances. Accelerometer yields better results in prone position, whereas the PIR sensor performs better for the remainder. We then fuse the decisions of each sensor with a logical OR operator. The results are reported in the last column of the table. We achieve an average success rate of 95% in identifying regular breathing activities.
V. CONCLUSION
We proposed a system consisting of a PIR sensor and an accelerometer to detect regular breathing activities. Persistent homology is used to reveal the almost periodic structure in the sensor signals. Subsampling the point clouds provides a substantial reduction in the computational complexity of the algorithm so that it can be implemented in low-power systems. In the up-coming papers, we will consider methods from machine learning and statistical data analysis for further interpretation of Betti numbers and persistence intervals to classify a wide range of activities.
REFERENCES
[1] I. Homma and Y. Masaoka, “Breathing rhythms and emotions,” Exper-imental physiology, vol. 93, no. 9, pp. 1011–1021, 2008.
[2] S. D. Min, Y. Yun, and H. Shin, “Simplified structural textile respiration sensor based on capacitive pressure sensing method,” IEEE Sensors J., vol. 14, no. 9, pp. 3245–3251, 2014.
[3] B. Padasdao, E. Shahhaidar, C. Stickley, and O. Boric-Lubecke, “Elec-tromagnetic biosensing of respiratory rate,” IEEE Sensors J., vol. 13, no. 11, pp. 4204–4211, 2013.
[4] Y.-T. Peng, C.-Y. Lin, M.-T. Sun, and C. A. Landis, “Multimodality sensor system for long-term sleep quality monitoring,” IEEE Trans. Biomed. Eng., vol. 1, no. 3, pp. 217–227, 2007.
[5] V. Sepp¨a, J. V¨ais¨anen, P. Kauppinen, J. Malmivuo, and J. Hyttinen, “Measuring respirational parameters with a wearable bioimpedance device,” in 13th International Conference on Electrical Bioimpedance and the 8th Conference on Electrical Impedance Tomography. Springer, 2007, pp. 663–666.
[6] D. Zito, D. Pepe, M. Mincica, F. Zito, A. Tognetti, A. Lanat`a, and D. De Rossi, “Soc cmos uwb pulse radar sensor for contactless respi-ratory rate monitoring,” IEEE Trans. Biomed. Eng., vol. 5, no. 6, pp. 503–510, 2011.
[7] Y. Kurihara and K. Watanabe, “Development of unconstrained heartbeat and respiration measurement system with pneumatic flow,” IEEE Trans. Biomed. Eng., vol. 6, no. 6, pp. 596–604, 2012.
[8] J. N. Murthy, J. van Jaarsveld, J. Fei, I. Pavlidis, R. Harrykissoon, J. F. Lucke, S. Faiz, and R. Castriotta, “Thermal infrared imaging: a novel method to monitor airflow during polysomnography,” Sleep, vol. 32, no. 11, pp. 1521–1527, 2009.
[9] F. Erden, A. Z. Alkar, and A. E. Cetin, “Contact-free measurement of respiratory rate using infrared and vibration sensors,” Infrared Physics & Technology, vol. 73, pp. 88–94, 2015.
[10] S. Emrani, T. Gentimis, and H. Krim, “Persistent homology of delay embeddings and its application to wheeze detection,” IEEE Signal Process. Lett., vol. 21, no. 4, pp. 459–463, 2014.
[11] H. L. Yap and C. J. Rozell, “Stable takens’ embeddings for linear dynamical systems,” IEEE Trans. Signal Process., vol. 59, no. 10, pp. 4781–4794, 2011.
[12] F. Erden, B. U. Toreyin, E. B. Soyer, I. Inac, O. Gunay, K. Kose, and A. E. Cetin, “Wavelet based flickering flame detector using differential pir sensors,” Fire Safety Journal, vol. 53, pp. 13–18, 2012.
[13] H.-T. Chu and T.-C. Fu, “Analysis of exercise ventilation with autore-gressive model and hilbert-huang transform,” in Intelligent Systems and Applications: Proceedings of the International Computer Symposium (ICS) Held at Taichung, Taiwan, December 12–14, 2014, vol. 274. IOS Press, 2015, p. 185.
[14] F. Takens, “Detecting strange attractors in turbulence,” in Dynamical systems and turbulence. Springer, 1981, pp. 366–381.
[15] H. Krim, T. Gentimis, and H. Chintakunta, “Discovering the whole by the coarse: A topological paradigm for data analysis,” IEEE Signal Process. Mag., vol. 33, no. 2, pp. 95–104, 2016.
[16] V. De Silva and G. Carlsson, “Topological estimation using witness complexes,” Proc. Sympos. Point-Based Graphics, pp. 157–166, 2004. [17] G. Carlsson, “Topology and data,” Bulletin of the American
Mathemat-ical Society, vol. 46, no. 2, pp. 255–308, 2009.
[18] A. Tausz, M. Vejdemo-Johansson, and H. Adams, “JavaPlex: A re-search software package for persistent (co)homology,” in Proceed-ings of ICMS 2014, ser. Lecture Notes in Computer Science 8592, H. Hong and C. Yap, Eds., 2014, pp. 129–136, software available at http://appliedtopology.github.io/javaplex/.