IC
ON
A
RP
ICONARP International Journal of Architecture & Planning Received 11 March 2018; Accepted 19 March 2018 Volume 6, Issue 1, pp: 01-28 /Published 25 June 2018 DOI: 10.15320/ICONARP.2018.36–E-ISSN: 2147-9380 Research Article
Abstract
International quick service restaurants (QSRs) have become a stand-alone sector due to their significant market share throughout the world instead of being considered under the food and beverage sector. The success of QSR site selection is directly related to land use and market potential estimation. This relationship has a significant influence on urban texture, identity and cities' development processes, given the high number of QSRs in urban spaces. Diverging from the current retail sector dynamics, the QSR sector brings to the table different needs in terms of trade area characteristics and spatial characteristics. In this respect, the aim of this research is to deliberate a methodological framework investigating site selection decisions of international QSRs and to establish a conceptual framework for an applicable model. Accordingly, first, the relationship between trade area analysis and site selection of international QSRs is examined. After that, trade area models of The Proximal Area Model, Reilly's Law of Retail Gravitation Model, Central Place Theory, Huff Model, Analog Model and Geographic
The Evaluation of Trade
Area Models and Analysis
Methods for Site Selection
from International Quick
Service Restaurants’ (QSR)
Perspective
Hanzade Kuğu Baş
Nuran Zeren Gülersoy
* **Keywords: Trade Area Models, Site Selection,
Quick Service Restaurants, Food & Beverages Industry.
*Graduate School of Science Engineering and
Technology, Istanbul Technical University, Istanbul, Turkey
E-mail: [email protected]
Orcid ID: https://orcid.org/0000-0002-1686-2225
**Prof. Dr. Faculty of Architecture, Istanbul
Technical University, Istanbul, Turkey. E-mail: [email protected]
Orcid ID: https://orcid.org/0000-0003-3268-7049
IC O N ARP. 20 18 .36 – E -I SSN : 21 47 -9380
Interdependence Model are discussed according to their competence of QSRs’ site selection. Then they are analytically evaluated within the framework of today's economic, social and spatial development variables. Finally, Regression Analysis Methods and Geographical Information Systems (GIS), which are encountered in literature and used in practice are examined, and a new theoretical framework for a site selection model integrating Regression Analysis Methods and GIS is proposed.
INTRODUCTION
The globalizing, sprawling and diversifying cities have transformed economic production processes and relations, giving rise to a fast-moving and fast-consuming society (Giddens, 2009). This transformation ushered in a new era by popularizing fast food culture and by changing people's food consumption patterns starting from the 1950s, both processes leading to significant changes in people’s habits of eating out (Jacobs and Scholliers, 2003). The changes in ways of consumption, coupled with the availability of cheap eating out options have brought about the emergence of increasingly fast-growing chains of international QSRs, which helped the retail sector in this field to develop rapidly.
Following the developments of the retail sector, the structure of society changed, the quality of service became more pronounced, and competition among QSRs intensified. These developments have enabled food and beverage businesses not only to provide people with the opportunity to eat out but also to offer them entertainment and convenience while doing so (Park, 2004). The food and beverage industry's focus on social mobility and on offering delicious and affordable options in alignment with the quick-paced life style has led to a boom in the number of such businesses (Türksoy, 2002).
The sharp divergence of international QSRs from traditional eating and drinking establishments in terms of service, production and low-cost standard products; the rapid increase in the numbers of such QSRs and changing living conditions have all contributed to changes in the factors that affect the market potential of trade areas. In addition to this, the fact that international QSRs hold the largest share of all food and beverage businesses in the world has made the site selection decisions of their restaurants even more critical.
The decision of suitable site selection depends on many factors including correct and proper collection, compilation and analysis of data about the area. It is also essential to analyse the trade areas of the location thoroughly before determining the correct
m e 6, Is su e 1 / Pu bli shed : Jun e 20 18
location. Applebaum’s (1966) argument that the performance level of any retail function depends on the interrelation of the urban characteristics of its trade area and market potential is still valid today. The resulting balance of this relationship is of vital importance for conscious city planning. Contemporary global economy, the incorporation of new technologies into people’s everyday lives, and the emergence of consumerist society have created a pressing need to redefine the market potential of trade areas in the quick service sector. This need affects many fields ranging from trade area definition, market potential, planning hierarchy to site selection models.
As a result of globalization, technological advances and rapid changes that have occurred in recent years; the inability of the QSRs to correctly predict the impact of trade area characteristics on site selection decisions emerges as a significant problem. To address this problem, this research analytically evaluates the trade area models and analysis methods used for the site selection of international QSRs, to propose a theoretical framework which can help measure the level of interdependence between the economic volumes of restaurants and the characteristics of their trade areas. To this end, first, the relationship between the site selection of QSRs and trade areas is explained. In terms of international QSRs, it is questioned how traditional models can make the right place selection and market potential measurement within the framework of current variables. While doing this, all models are analysed systematically in terms of their objectives, scope, data, and results. GIS and Regression Analysis Methods are also evaluated separately in the frame of site selection. Finally, the limitations and potentials of the analysis are discussed in terms of economic, social and urban dynamics; guidelines are provided to outline the proposed model, and suggestions are made for further studies.
The Relationship between International Quick Service Restaurants’ Trade Area Analysis and Site Selection
The economic growth of cities creates a demand for space in the city centres and causes the cities to be restructured, with changes particularly prominent in their forms and uses. Economic and social changes transform urban spaces constantly, leading to further changes not only in globalized and culturally homogenized cities but also in the development policies, strategies and physical structures of international corporations which grow continuously and independently of states (Wang and Zhou 1999). The sustainability of rapidly expanding and rapidly consumed urban spaces depends on reasonable site selection decisions based on
IC O N ARP. 20 18 .36 – E -I SSN : 21 47 -9380
economic development strategies that are explicitly devised to respond to the needs of such rapid urbanization.
For the retail sector, the choice of the right location seems to be the single most important strategic decision that ensures long-term success (Cottrell 1973; Ingene & Lusch 1980; Kuo et al. 2002). As Craig et al. (1984) argue, the search of consumers for both affordable price and easy accessibility are still two most critical criteria that give site selection a competitive advantage. In addition to consumer preferences, trade area characteristics need to be analysed carefully before site selection.
The concept of trade area has diverse definitions in literature; however, in this study, this concept is used to refer to trade impact area (trade area/trading area/market area/catchment area). Within this context, trade area is considered to be the place where potential consumer mass is concentrated rather than an urban area where the commercial activity takes place (Patel et al., 2007). Trade area, i.e. the geographic area where the majority of similar businesses is concentrated in, can be drawn as a neat geometrical shape such as a circle, square or polygon; however, the shape does not necessarily have to be a clear-cut geometrical one. It seems that more accurate outcomes will result when shaping takes place in accordance with the road network, topography, geology, land use, and natural boundaries and thresholds of the area.
When defining the trade area shape, not only the geographical and physical features but also a consumer and product-based traits should be taken into consideration. At this point, the determination of the size/boundaries of the trade area becomes crucial. The size of the trade area is usually defined as the distance between the customer's home or business and the location or area to be visited.
In the determination of the layers of trade area, usually three measures are used: linear distance (e.g., concentric rings drawn around a location), travel distance (by car or public transport) or time spent (by car or public transport). Mapping techniques are used for forecasting or researching store trade area volumes and for creating maps (McGoldrick, 2002). Examples of trade areas of international QSRs created with different methods are shown in Figure 1.
m e 6, Is su e 1 / Pu bli shed : Jun e 20 18
After the trade area is defined and its boundaries are determined, it becomes necessary to conduct trade area analysis, in order to figure out the suitable trade area characteristics for site selection. This analysis focuses on defining the target market and determining the right location. In this context, defining the target market and reaching this target successfully means that location choice has been successful (Dunne and Lusch, 1999). To stress the importance of this decision, Jones and Simmons (1987) state that the most critical three components of a successful retail store are “location, location and location”. This statement is still valid today. The most crucial point in the site selection decisions is to make a sales forecasting after the analysis of the trade area. Sales forecast, which means the realistic estimation of the profit and the amount of goods that a business can sell over a predetermined period, is influenced by macro-level factors as well as by micro-level factors such as the characteristics of its physical location. The food and beverage sector differs from other sectors in terms of working days and hours, product and service variability, personnel supply and transportation facilities, and consumer proximity. For this reason, market potential estimation based on site selection and sales forecasting analysis is also carried out differently from other sectors (Sarıışık et al., 2010).
For QSRs, various criteria such as investment risk, food quality, management strategy, eating habits and cultural differences should be assessed carefully especially when international growth is at stake (Bhutta et al., 2003). Studies investigating the factors that influence location preference and market potential of QSRs often examine the relationship between the QSR sector and socio-cultural factors such as the health conditions or eating habits of consumers (Powell et al., 2007; Larson et al., 2009; Black et al., 2011).
Figure 1. Trade Area Modelling Examples
IC O N ARP. 20 18 .36 – E -I SSN : 21 47 -9380
In addition, it is found by the current studies in literature that factors like proximity and ethnicity (Eckert and Shetty, 2011; Morland et al., 2002), household income (Cummins et al., 2005; Walker et al., 2014) and culinary culture (Zhang et al., 2014) play a significant role in the spatial distribution of international QSRs. However, the most important criteria for achieving success on the international scale seem to be the correct analysis of local data on the trade area scale and the choice of location based on sales forecasting made with these data (Thomadsen, 2007; Nieh and Pong, 2012).
Since the QSRs are primary drivers of their market, their site selection decisions based on correct sales forecasting influence urban planning more than do other sectors. For this reason, it is crucial that they make their site selection decisions in accordance with trade area characteristics. Since there seems to be a disparity between the trade area characteristics used to determine the market potential and the criteria used in the conventional trade area models, this study re-examines trading area models for international QSRs, by taking into account global economic, social and spatial changes.
Evaluation of Trade Area Models Used in Site Selection Decisions
In the trade area analysis literature for site selection, there are many trade area models that investigate the relationship between the spatial characteristics of retail store use and trade area characteristics. Trade area analysis, which is conducted particularly for each type of retail store, determines the characteristics of the area around a store or the network of stores, and attempts to answer questions such as where the store's customers come from, how many customers are in a trade area, and where to look for new customers.
The models analysed in the scope of this study are as follows: The Proximal Area Model, which makes sales forecasts and site selection decisions based on the framework of similar locations; Reilly’s Law of Retail Gravitation Model, which takes into account factors of population and proximity; Central Place Theory, which analyses the spatial behaviour of trade; Huff Model, which emphasizes the importance of product features and customer preferences; Analog Model, which is the first model to measure the first systematic sales potential by drawing on the concept of similar stores; and finally Geographic Interdependence Model, which measures the dependence of neighbouring areas to one another.
m e 6, Is su e 1 / Pu bli shed : Jun e 20 18
TRADE AREA MODELS The Proximal Area Model
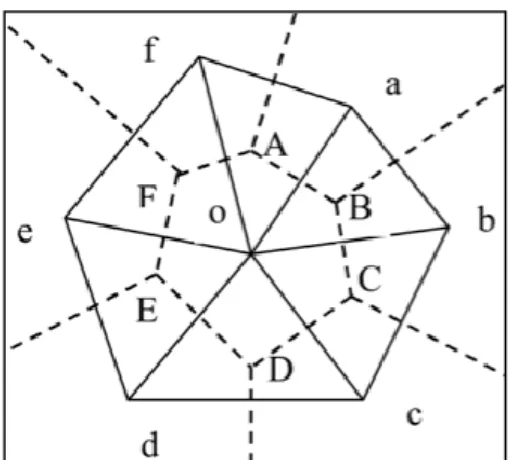
The Proximal Area Model is based on the assumption that, among all similar stores, customers tend to choose the store that is closest to them. According to this model, after the trade area is determined, sales analysis is carried out based on the demographic variables and spending habits of customers. For this reason, the trade area of a store consists of the combination of all the geographical points that are closer to the other stores around the consumers. The model suggests that stores within this area have a spatial advantage. Thiessen and Alter (1911) suggest that accurate sales forecasts can be made in this model by analysing the characteristics and purchasing habits of the surrounding population.
Illustrated below is the model known as Thiessen Polygons. In this model (as illustrated in Figure 2) a line is drawn between two attraction centres (like A, B, C, D, E and F in Figure 2) and another vertical line (i.e. the dotted lines in Figure 2) is drawn from their middle point, to intersect two lines. As Ghosh and McLafferty (1987) argue, owing to the resulting a, b, c, d, e, f and o polygons, it is possible to correctly and efficiently estimate the revenues of the businesses in distinct areas.
The Proximal Area Model is suitable for defining the trading areas of new stores. It is also useful in identifying areas with low accessibility, areas of potential future growth, and the geometric distribution of surrounding areas. Proximal areas are used both for the sales forecasting of stores in new locations and for evaluating the feasibility of a store/location. As Ghosh and McLafferty (1987) point out, this method is particularly suitable for sales forecasts where the stores are similar in terms of scale, attractiveness and products sold, and physical accessibility is an important determinant of store selection.
Figure 2. Thiessen Polygons (Source: Wang et al., 2014)
IC O N ARP. 20 18 .36 – E -I SSN : 21 47 -9380
The number of criteria the model uses is insufficient for international QSRs under today’s circumstances. Nowadays, diverse factors such as product variety, the availability of outdoor seating areas or playgrounds for kids; drive a significant portion of consumers’ store or restaurant preferences. However, the model is still reliable in that it draws attention to demographic features, and defines trade area volumes both quantitatively and geographically.
Reilly's Law of Retail Gravitation
Inspired by Newton's law of gravity, Reilly devised the Law of Retail Gravitation Model in the 1930s to explain trade area boundaries. The main premise of the model is the view that as the population of the city increases or the distance of the consumer to a store decreases, the possibility that the customer may purchase from a particular store will increase (Levy and Weitz, 1998). To differentiate the trade areas of two competing cities, Retail Gravitation Model uses a calculation method based on the populations of the two cities and the distance between them. The model rests on three assumptions: (1) The areas in the competition are equidistant, (2) Retailers on both sides are equally capable, (3) The population is homogenous (Berman and Evans, 2001). The authenticity of Retail Gravitation Model lies in the fact that it was the first-ever model to attempt to the draw trade area boundaries. However, the model’s most significant shortcoming is assuming the population as a homogenous entity, thus overlooking diverse cultural characteristics. This model has been used by various companies; however, it has also been subject to criticism for being based on the assumption that customers are only interested in shopping at stores closest to them (Dökmeci, 2005).
The model developed by Converse in the 1940s suggested that consumers’ shopping preferences may be shaped differently in different cities (Dunne and Lusch, 1999). The method is considered suitable for defining trade areas mostly in rural areas: the tendency of consumers to travel more frequently in urban areas makes it difficult to distinguish trade areas in urban areas (Converse, 1949). This is considered to be the most important limitation of the model under today’s conditions: it offers an analysis based only on travel distance and on two cities or areas that are necessarily equidistant.
Today, travel distance is not considered synonymous with travel time, and most people are more preoccupied with time than with distance. This limitation makes the model ill-suited for international QSRs in determining locations. Moreover, since
m e 6, Is su e 1 / Pu bli shed : Jun e 20 18
customers who prefer international QSRs may come from different socioeconomic backgrounds, it is erroneous to accept them as a homogenous entity, because such an assumption entails the problem of not being able to define the right trade area and boundaries.
Central Place Theory
Another theoretical study examining the spatial behaviour of retail trade is Central Place Theory. The basic aim of this theory, designed by Christaller in the 1930s and developed by Lösch in the 1950s, is to establish the principles that determine the number, size and distribution of urban settlements, in accordance with service activities that take place. According to Dennis et al. (2002), this theory presents a model in which the shopping visits of the consumers to the nearest mall for a single purpose are determined by the relationship of the retail sales area size, and the distance travelled to reach the mall.
Central Place Theory is based on two concepts: distribution and threshold. In this context, distribution refers to the maximum distance the customer will travel to buy a product. Threshold, on the other hand, refers to the minimum demand necessary for a store to survive; this demand also represents the population of the area. The model predicts that as long as local demand is sufficient, stores (together with other stores) will try to keep contributing to the urban economy, by getting concentrated in areas that are close in proximity to big cities (Mulligan et al., 2012).
However, as Christaller (1933) and Wheeler et al. (1998) state, this theory ignores the notable role of industry in the development of cities. According to Lösch (1954), the developer of the model, the most suitable location for a store is the location that will yield most massive profits. The model assumes that production and demand conditions are homogeneous. Also, it argues that the market areas will develop in the periphery of big cities and hence the stores that aim for profit-benefit maximization should focus on these areas (Koschatzky, 2012). The theory, which divides the spatial areas into hexagons, attempts to analyse the hierarchy and city systems that play a role in the growth of cities. The model was put to the test by different researchers in different regions. However, since all of these attempts were empirical studies based on observation, they could not go beyond the definition of trade areas.
Due to the heavy emphasis placed on the system of hierarchical relationships among the existing centres, the theory is ill-suited for properly guiding international QSRs site selection decisions.
IC O N ARP. 20 18 .36 – E -I SSN : 21 47 -9380
However, the hierarchy of centres is a cornerstone for the market potential estimations of such restaurants. To estimate the commercial volume, a more detailed study is required. Nowadays, the proximity or distance to the central business areas has lost its importance, because the dynamic structure of many cities led to an expansion of their access areas and changed people’s shopping preferences. It seems that the definition of trading areas and the method of market potential estimation should also change in parallel with the changing demographic
Huff Model
Spatial gravity law of Huff Model (developed in the 1960s) assumes that in the cases where there are multiple stores to choose from, the customers’ preference will be determined by the attractiveness of the store, and the distance between the customer and the store. According to this assumption, the more critical a product is for a customer, the less likely s/he will be to heed the distance s/he has to travel to get it.
Different from Reilly’s Model, Huff Model is not based on a single variable, but on diverse variables related to the size of the trade area. In this model, trade areas are determined according to product variety in stores, time spent from the consumer's home to alternative shopping centres, and how much time the consumer is willing to spend on the way (Huff, 1964). In short, Huff’s model takes account of customer preferences. Product variety in the model is ensured by allocating a specific m2 of sales area for each product category. Moreover, in the determination of product variety, factors such as customers’ sensitivity to travel time, their reasons for shopping and the specific shopping needs that drive customers to travel are taken into account (Berman and Evans, 1992). According to the model, a customer who wants to buy a speciality good will be more willing to travel than a customer who wants to access a product easily (Hasty and Reardon, 1997). In Huff Model, the trading area is divided into hierarchical zones. The model is the first in the retail sector to take a new perspective on the sales area and travel time, and to help the two concepts coalesce into a single formula (Wee and Pearce, 1985). It is also a strong model in that it explains individual shopping behaviours more clearly than the previous models and suggests that trading areas can be continuous, complex or overlapping. The identification of the variables that are used to measure the attractiveness and distance of stores constitute the limitation of the model. In the model, attractiveness is measured by the number of stores, the number of employees, sales revenue, retail sales area and the type of store. Distance, on the other hand, is
m e 6, Is su e 1 / Pu bli shed : Jun e 20 18
measured by geographical distance, travel distance, travel time and cost (Clarkson et al., 1996).
In the 1980s, Gautschi criticized the model on the grounds that the variables used in Huff Model were determined by subjective responses and that the model was based merely on prediction. In the same vein, Eppli and Benjamin (1994), and Gaustchi (1981) stressed that taking “store size” as the only criterion for store attractiveness can lead to misleading results. These criticisms are still valid today.
Today, customer preferences are shaped by many criteria, among which are the image of the store, quality, price, cosiness, and service speed. Thus, from the perspective of international QSRs, the model’s use of store size as the only criterion for attractiveness constitutes its most notable weakness. In addition, time is considered to be a very valuable asset in the contemporary world; hence, travel time is crucial for QSRs in the determination of trade area boundaries.
Analog Model
The Analog Model, published by William Applebaum in 1966, is one of the first systematic methods to predict retail sales (Ghosh, 1994). In addition, it is the first model to relate the geographical dependence of the consumer to the trade areas in urban spaces. The principal aim of the model is to define residential and trade area characteristics for stores and to facilitate the search for places with similar properties (Levy and Weitz, 2009). In this simple model that gained popularity in the 2000s, the potential sales of a store are estimated by comparing the sales of other similar stores located in the same trade area (Berman and Evans, 2001). For this reason, the model is frequently used by the chains that prefer a simple and subjective approach.
The first step in the creation of this model involves dividing the sales areas of the store as primary, secondary and tertiary. In this context, the primary area refers to the area that most customers visit, the secondary area refers to the one where customer density is relatively lower, and the remaining areas are considered as tertiary areas. These areas may not necessarily have definite shapes. In the second step, the market interaction of these areas is calculated using their demographic characteristics. Next, potential sales rate is calculated comparing these characteristics to the current sales. Finally, trade areas are compared with the areas which have a similar market share, market interaction, and market characteristics and the location of the store is determined by analysing similar trade area characteristics.
IC O N ARP. 20 18 .36 – E -I SSN : 21 47 -9380
The Analog method is often used in combination with Regression Analysis. Measuring the level of geographical dependence according to the results of the analysis presents a more reliable customer profile and trade area boundaries. For this reason, this method provides a significant advantage when choosing a location and creating a retail strategy. The Analog model is based on two premises: (1) the population in the commercial area is not homogeneously distributed; (2) some market conditions in a trade area may not lend themselves to being measured and may require subjective evaluation. However, two urban areas may not have similar market characteristics, and they may engage in different public interactions at different times. For this reason, the results of each measurement may be unlike one another (Özuduru, 2006). In addition, the demographic characteristics of trade areas may be dissimilar to each other.
This model is often used in the site selection of international QSRs nowadays. However, its most important shortcoming is that it forecasts sales based on subjective evaluation. In order to minimize subjectivity, similar locations in the model should be selected by a numerical program, and a Regression Analysis should be carried out based on the trade area and the physical characteristics of the store. It is thought that a sales analysis based on such Regression Analysis will yield more accurate results.
Geographic Interdependence Models
The concept of Geographic Interdependence put forward by Russell in 1950s is the first attempt in the retail sector to explain the extent to which the locations or surroundings of stores influence each other and their customers’ preferences. Russell found high geographical dependence among retailers in urbanized areas, but low geographical dependence in closed communities. The level of geographical dependence between retailers is crucial for determining trade area boundaries and for enabling retailers to reach realistic information about their customers. For this reason, the principal aim of these models is to determine trade area boundaries and to measure the level of dependence between customers and stores.
In literature, different methods (most notably Regression Analysis), have been used to measure Geographical Dependence. Anderson and Kaminsky (1985) attempted to explain this issue in the 1980s by drawing an explanatory framework. To this end, first, they analysed the customers, and then the goods and services these customers bought. The result of this analysis revealed that retailers do influence customers’ decision making processes.
m e 6, Is su e 1 / Pu bli shed : Jun e 20 18
Geographic Interdependence Model, developed by Mushinski and Weiler (2002) in the 2000s, states that there are significant geographic dependencies between the place of the store and its neighbouring areas and that such dependencies change according to retail sector groups. The model measures the geographical interdependence between the number of stores in an area and the number of stores in neighbouring areas (Mushinski and Weiler, 2002).
The model suggests that the level of geographic dependence changes according to the retail sector groups and the population of the trade area. The model categorizes the retail sector into three groups: The stores in the first group, i.e. building stores, food stores and pharmacies, are not found to be geographically interdependent. This result shows that the presence of these stores in a region does not affect the population and settlements outside the region. The stores in the second group, i.e. commercial stores, cars, clothing and furniture stores, are only interdependent on the supply-side. It demonstrates that only the number of settlements has a statistically significant impact. According to the model, if there are more settlements in the surrounding areas, the number of settlements in the region will decrease. The stores in the third group, i.e. petrol stations and food and beverage venues, are found to be interdependent regarding both supply and demand. The results point to the conclusion that both the number of settlements and population in the surrounding areas have a statistically significant impact on the area under scrutiny. The importance of Mushinski and Weiler’s (2002) study lies in the fact that it focuses mainly on the food and beverage sector. Their research has proven that the level of interdependence between a store’s place and its neighbouring area differs according to sectors.
In recent years, geographical interdependence has been measured using models and indices. The determination of geographical interdependence is a cornerstone in site selection for international QSRs, and a fundamental building block for drawing trade area boundaries. Since Geographic Interdependence Models rely on Regression Analysis for measuring dependence, they constitute the scientific basis for this research as well. However, there are also views that correct site selection cannot be made if it is not supported by market potential estimations and that although the model provides a strong foundation, it still falls short of determining market potential. This model is suitable for the determination of trade area boundaries but not for correct site selection
IC O N ARP. 20 18 .36 – E -I SSN : 21 47 -9380
Evaluation of Trade Area Models for International Quick Service Restaurants
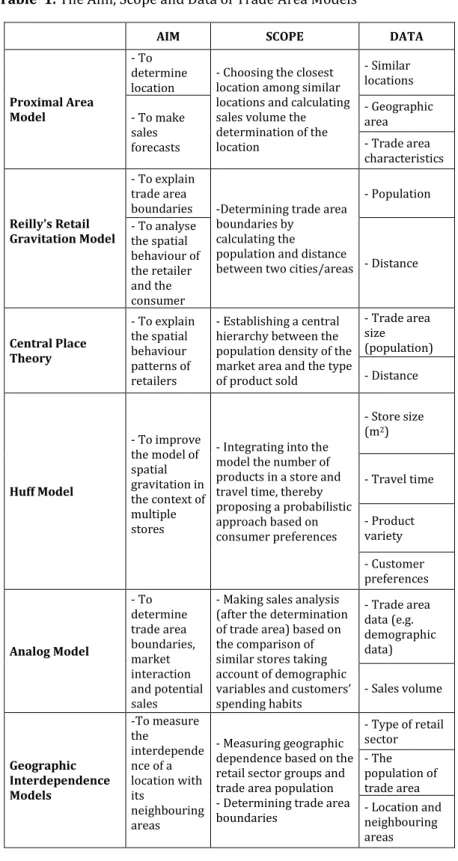
Trade area models have evolved in accordance with the ever-changing urban needs from past to present. It would not be a scientific approach to select a model that is best-suited for all needs as all models have been developed to cater to different needs and are used for different purposes. Table 1 below systematically tabulates all the models used in this study according to their purpose, scope and data, for the international QSRs. In Table 2, the strengths and weaknesses of each model are identified.
A quick glance at this chronologically arranged table demonstrates that the aims and scopes of models have diversified over time. The Proximal Area Model developed in the 1910s using Thiessen Polygons offers a simple method for site selection and sales forecasting. Reilly’s Gravitation Model, proposed in the 1930s, establishes trade area boundaries by using population and distance between two cities as measurement units, while Central Place Theory of 1960s explains the spatial behaviour of retailers through central hierarchy determined according to population density and product type. Huff Model, again developed in the 1960s, attempts to reanalyse the theory of gravitation in the context of multiple stores by factoring in consumer behaviour patterns and other variables such as store size, travel time, product variety. The goals of the Analog Model are to incorporate market interaction and effects of globalization into the current models at hand. The distinctive feature of this model, which is considered to be the cornerstone of trade volume estimation, is that it is comparison-based. Geographic Interdependence Models identify the geographic interdependencies of population and trade area boundaries; however, they are not viable for market potential estimation.
This analysis demonstrates that all the models mentioned above require comprehensive data and that most of them require data collected through extensive surveys. In addition, there is a need for company-specific data such as sales volume, which is difficult to obtain in models measuring trade volume. On the other hand, primary models require the subjective evaluation of the analyser, which leads them to be criticized for lack of reliability and accuracy.
m e 6, Is su e 1 / Pu bli shed : Jun e 20 18
Table 1.The Aim, Scope and Data of Trade Area Models
AIM SCOPE DATA
Proximal Area Model
- To determine
location - Choosing the closest location among similar locations and calculating sales volume the determination of the location - Similar locations - To make sales forecasts - Geographic area - Trade area characteristics Reilly's Retail Gravitation Model - To explain trade area
boundaries -Determining trade area boundaries by
calculating the
population and distance between two cities/areas
- Population - To analyse the spatial behaviour of the retailer and the consumer - Distance Central Place Theory - To explain the spatial behaviour patterns of retailers - Establishing a central hierarchy between the population density of the market area and the type of product sold - Trade area size (population) - Distance Huff Model - To improve the model of spatial gravitation in the context of multiple stores
- Integrating into the model the number of products in a store and travel time, thereby proposing a probabilistic approach based on consumer preferences - Store size (m2) - Travel time - Product variety - Customer preferences Analog Model - To determine trade area boundaries, market interaction and potential sales
- Making sales analysis (after the determination of trade area) based on the comparison of similar stores taking account of demographic variables and customers’ spending habits - Trade area data (e.g. demographic data) - Sales volume Geographic Interdependence Models -To measure the interdepende nce of a location with its neighbouring areas - Measuring geographic dependence based on the retail sector groups and trade area population - Determining trade area boundaries - Type of retail sector - The population of trade area - Location and neighbouring areas
The choice of a viable model depends on sectoral or local characteristics. The area and/or sector characteristics analysed in similar ways may lead the data in Table 1 to diversify and to change in number. For this reason, it seems better to make the site selection decision taking account of sectoral needs and local characteristics.
IC O N ARP. 20 18 .36 – E -I SSN : 21 47 -9380
Table 2.The Strengths and Weaknesses of Trade Area Models
STRENGTHS WEAKNESSES
Proximal Area Model
- The first-ever model to mention the spatial advantage of a store
- Unsuitable for sectors with no differentiated products - Insufficient criteria under today’s circumstances - The simple and direct
prediction of store revenue in different areas
- The identification of the geometric distribution of surrounding areas, areas with low accessibility and areas with potential future growth - The evaluation of the feasibility of a new sales point by
estimating the store sales in new locations
Reilly's Retail Gravitation Model
-The first model to define and draw trade area boundaries
- Assuming population as a homogeneous unit, ignoring cultural differences - The creation of a formula to
define trade area boundaries in cities
- Misleading because today travel distance is no longer equal to the travel time
Central Place Theory
- The first model to investigate the spatial behaviour of retail trade
- Overlooking the pivotal role of industrialization in the growth of cities. - A hierarchical outlook on
modelling
-Assuming that production and demand conditions are homogeneous.
- A systematic framework that is
easy to organize - Too theoretical for practical use
Huff Model
- The determination of probable
catchment areas - Based heavily on prediction - The first ever model to factor in
consumer behaviour
- Lack of data when measuring store
attractiveness makes it ill-suited for QSRs
Analog Model
- The first systematic sales
prediction model - Deciding on the location of a new store based on the comparison of current stores or areas may present misleading results - Providing potential sales
estimate, market interaction and trade area boundaries
- The first model based on
empirical data - Unsuitable for the use of stores in different areas because of diverse local dynamics that influence the market
- Using the most popular and simple method
- Predicting sales via a comparison-based method
Geographic Interdependence Models
- Dividing the sector into groups and measuring their geographic interdependence according to
their trade area population. - Not offering any insights into market potential or sales forecasting
-The first model to measure the interdependence between a location and neighbouring areas
In recent years, journeys within and between cities have increased globally. The desire to travel more and longer has
m e 6, Is su e 1 / Pu bli shed : Jun e 20 18
grown parallel to the developments in economic conditions: likewise, the increase in GDP per capita seems to have led to using diverse means of transportation. Such changes in global economic and social systems have influenced international QSRs’ site selection criteria as well. In this frame, trade area models have been investigated and evaluated according to the sector, for international QSRs (Table 2).
Each model has strengths and weaknesses. The strengths of the trade area models examined above may forge the basis of a feasible trade area analysis that will guide site selection decisions of international QSRs. These strengths can be listed as the sales forecasting concept of Proximal Area Model, trade area definition of Reilly’s Model, the hierarchical system of Central Place Theory, the importance of consumer behaviour in Huff Model, the comparison-based method and first systematic sales forecasting of Analog Model and the concept of geographic interdependencies as used in Geographic Interdependence Model.
The weaknesses of the model can be listed as the lack of sufficient criteria for today’s conditions in Proximal Area Model, the assumption of a homogeneous population and of equating travel distance with travel time, the lack of practicality of Central Place Theory, the use of insufficient criteria when measuring store attractiveness in Huff Model, the possibility of misleading results when choosing the new store location through the comparison of current stores or trade areas in Analog Model, lack of insight into trade area dynamics and sales forecasting in Geographic Interdependency Models. It is thought that trade area analysis of international QSRs can be made by Regression Analysis Methods and GIS, which are used in literature and practice
The Evaluation of Geographical Information Systems (GIS) and Regression Analysis Methods for Trade Area Analysis and Site Selection from International Quick Service Restaurants’ Perspective
The comprehensive analysis of Trade Area Models for international QSRs reveals the weaknesses of all models. However, such problems could be solved spatially by GIS and statistically by using Regression Analysis Methods. Below, GIS and Regression Analysis Methods are systematically analysed for international QSRs in terms of aim, scope and data (Table 3).
IC O N ARP. 20 18 .36 – E -I SSN : 21 47 -9380
Table 3. The Aim, Scope and Data of GIS and Regression Analysis
Methods
AIM SCOPE DATA
GIS
- To reach commercial area data and calculate market potential - Digitizing data by combining physical and cultural geography - Physical and cultural geography - Visualizing data with
geocoding - Maps
- Providing data for trade area analysis and drawing trade area boundaries - Geographic coding - Calculating the market potential using different models - Sales Points Regression Analysis Methods - To measure store performance/trade volume through trade area characteristics and/or spatial characteristics - Analysing the relationship between trade volume and spatial, urban, demographic, social and economic characteristics - Performance - Sales estimates - Trade area characteristics - Spatial characteristics As Levy and Weitz (1998) argue, although Regression Analysis Methods use similar logic to that of Analog Method in site selection, statistics are relied on more heavily than forecasts in site selection or economic volume estimations in Regression Analysis Models. The main premise of this method is that the factors influencing existing stores in the chain will also influence the new stores in the same way (Levy and Weitz, 2009). Population, average income, number of households, near competitors, transportation barriers, traffic or any desired data can be examined as independent variables (Berman and Evans, 2001). After the data is collected, regression procedure can start, unlike in the Analog Model. This model uses mathematical equations instead of the subjective experience of the site analyst who compares the trade area characteristics of the existing store with the potential new store (Levy and Weitz, 1998).
In 1984, Jones and Mock stated that sales sites could be divided into homogeneous groups and that regression model should be created for each group separately. As pointed out by Gosh and McLafferty (1987), Regression Analysis Models suffer from two disadvantages: (1) Multicollinearity and (2) The heterogeneity of sample stores. These criticisms are still valid today. Multicollinearity occurs when there is a clear internal correlation between the independent variables in the regression model. According to statistical theory, these variables should be uncorrelated and independent of each other. The heterogeneity of
m e 6, Is su e 1 / Pu bli shed : Jun e 20 18
sample stores is borne out of the difficulty of combining all sales locations in a model, because all locations may accommodate different trade area information. Other criticisms levelled at Regression Analysis models include discrepant definitions of store types, images and service qualities; the difficulty of measuring competition, the mistakes in defining market areas, and random distance measurements when gauging consumer characteristics (Ghosh and McLafferty, 1987). These criticisms of the 1980s should be dealt with in today's analyses, and the margin of error should be reduced.
Regression models are often preferred over other models by international QSRs because of their ability to analyse the relationship between trade area characteristics and sales volume, their competence in facilitating the analysis of complex relationships, and their objectivity owing to the use of statistics and not analyst’s evaluations. However, the spatial relations of the models, which are highly reliable mathematically, need to be reinforced with geographical information. At this point GIS, which is used both in trade area analysis and in market potential measurement, comes to the fore. GIS is seen as an important tool in trade area analysis because it has the ability to map results to various geographical regions and to map results to different map scales and to collect large data volumes in different coordinate systems. GIS can combine several databases into common data groups, each of which can be combined into a common data set, and this combination provides visibility into key market trends as well. Retailers, and restaurant chains in particular, often use GIS in site selection decisions.
Many researchers have applied GIS methods to measure economic volume when examining commercial units with regression models. Like other sectors, the international QSR sector also uses GIS through programs that work with the GIS database, where some data are digitized and transferred to maps for visualisation. Each location is transferred to the program as a point through geographic coding. After the transfer, the boundaries of the trade area are determined by performing Catchment Analysis with the GIS database program. Finally, all the data of the trade area (demographic, socioeconomic, urban, etc.) is reached through this interface.
GIS contains statistical applications supported by maps and it is becoming widespread that GIS is used as a decision tool in site selection with spatial statistical models. The main types of spatial analysis carried out by GIS are; Spatial Query, Spatial Analysis, Spatial Econometric Analysis, Statistical Analysis and Geographically Weighted Regression Analysis. There are spatial
IC O N ARP. 20 18 .36 – E -I SSN : 21 47 -9380
statistical methods that have the ability to model spatial relationships compared to traditional statistical methods (Fotheringham et al., 2002). GIS, when combined with statistical methods, provide an effective set of tools to analyze, display and manage spatial data (Anselin, 2003). When studies on geographically weighted regression are examined, it can be seen that the first studies have been put forward by Fotheringham, Brunsdon and Charlton. Brundson et al. (1996) defines geographically weighted regression as a technique, which tries to capture the variation using a sensitive approach for a multiple regression model which enables various relationships to exist at various points in space. Apart from this, market potential measurements can also be made using traditional trade area models and various methods within GIS.
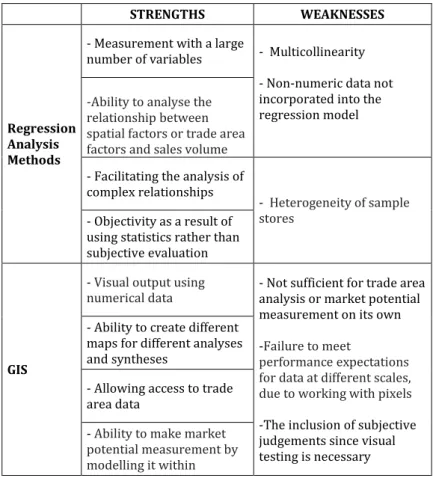
Within this framework, the strengths and weaknesses of GIS and Regression Analysis Methods regarding international QSRs have been identified (Table 4).
Table 4. Strengths and Weaknesses of GIS and Regression Analysis
Methods
STRENGTHS WEAKNESSES
Regression Analysis Methods
- Measurement with a large
number of variables - Multicollinearity - Non-numeric data not incorporated into the regression model -Ability to analyse the
relationship between spatial factors or trade area factors and sales volume - Facilitating the analysis of complex relationships
- Heterogeneity of sample stores
- Objectivity as a result of using statistics rather than subjective evaluation
GIS
- Visual output using
numerical data - Not sufficient for trade area analysis or market potential measurement on its own -Failure to meet
performance expectations for data at different scales, due to working with pixels -The inclusion of subjective judgements since visual testing is necessary - Ability to create different
maps for different analyses and syntheses
- Allowing access to trade area data
- Ability to make market potential measurement by modelling it within
The combination of the strengths of Regression Analysis Models and GIS seems to offer feasible guidelines for the site selection decisions of international QSRs, within the framework of today’s dynamics. The most notable strengths of Regression Analysis
m e 6, Is su e 1 / Pu bli shed : Jun e 20 18
methods for international QSRs are their objective approach and the incorporation of a plethora of variables in measurement. The strongest aspect of GIS for this analysis is offering access to trade area data. On the other hand, the most significant weaknesses of Regression Analysis Methods are the heterogeneity of sample stores and the inability of the model to incorporate non-numerical data into the regression formula. GIS is an insufficient method to measure market potential or analyse trade areas unless combined with other methods. In addition, since it works with pixels, it may fail to meet performance expectations when the data comes from different scales. The final shortcoming of GIS is that, apart from mathematical outputs, it relies on subjective evaluations to a considerable extent since visual testing is necessary for all conditions. For all the reasons stated above, it is thought that the strengths and weaknesses of both models will complement each other.
Theoretical Framework Proposition for A Site Selection Model for International Quick Service Restaurants
Being based on the idea that international QSRs should be located in the right places for sustainability and considering that restaurant site selection has a significant impact on city planning, this research emphasizes the importance of the evaluation of the trade area potential, and provides a theoretical state-of-the-art framework for site selection model by reassessing in today’s conditions the traditional trade area models, Regression Analysis models and GIS methods in terms of site selection for the international QSRs.
A new theoretical framework is posited in this research because the current guidelines of trade area models used in trade area analysis fail to respond adequately to the contemporary dynamics of QSRs. It appears, after the detailed analysis of Regression Analysis methods and GIS, that the shortcomings in Trade Area Models can be complemented by the strengths of these two methods. The shortcomings of trade area models have qualitative and quantitative reasons. Qualitative problems can be overcome by using data that incorporates contemporary dynamics. However, Regression Analysis Methods should be used for the quantitative analysis of the evaluation of large data.
The model, based on the proposed theoretical framework in this study, will reach the demographic, social and urban data of the trade area by determining the trade area boundaries with GIS, and the data gathered by GIS will be used in measuring the dependence level of sales volume by Regression Analysis, thereby creating an integrated trade area model with which sales forecasting can be made. The aim of the model is to identify what
IC O N ARP. 20 18 .36 – E -I SSN : 21 47 -9380
characteristics of trade area influence the sales volume for international QSRs’ site selection and to determine viable locations in alignment with the results. The resulting model is based on the assumption that the demographic, social and urban characteristics of the trade area influence the economic volumes of international QSRs.
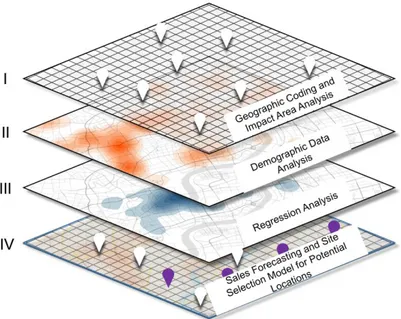
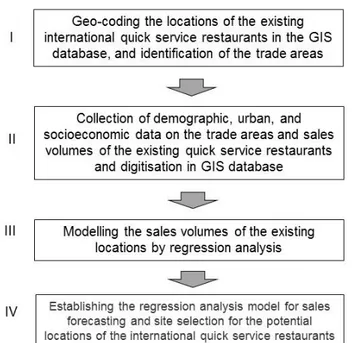
The scope of the proposed conceptual framework constitutes of making the site selection decision after the trade area is determined, and data is obtained by GIS, a model is established by Regression Analysis Models, and finally, the economic volume is measured. The model has four consecutive steps (Figure 3):
In the first step, the locations are identified and geographically coded by a GIS database program, and catchment analysis is conducted on a trade area, the size/boundaries of which have been determined prior to the analysis. In the second step, data on the demographic, socioeconomic and urban characteristics of commercial areas are obtained, and all urban and spatial data are digitized through GIS to create maps and to reach trade area data. In the third step, first, the sales data of locations are obtained. Combining the sales data and trade area data, a Regression Analysis is made using SPSS. It is aimed that a relationship between the performance of international QSRs trade area and the demographic, socioeconomic and urban data will be revealed as a result of the analysis. In the fourth and final step, the data will be analysed to check whether there is a statistically significant relationship between them, and if there is, then a model should be established to reflect this relationship. The flow chart of the steps can be seen in Figure 4.
Figure 3. Conceptual Framework Steps for International QSRs Site Selection Model
m e 6, Is su e 1 / Pu bli shed : Jun e 20 18
Before Regression Analysis begins and the model is established, it is crucial to decide which specific variables dependence will be sought. By using a Regression Analysis Method of analyst’s choice, all variables are used individually and separately to establish the model. Since a plethora of variables need to be used for international QSRs, the most suitable of all Regression Analysis models seems to be Multiple Regression Analysis model. The main reason why market volume is determined by so many variables is that the sector dynamics differ from the needs of other retail companies. The principal aim of the establishment of the desired model is to express the dependent variable as a function of the independent variables and to forecast or predict the value of the dependent variable at hand. In a model constructed as such, the dependent variable of the economic volume is expected to be a function of demographic, socioeconomic, and urban data.
Following the hypothesis that “economic volume is a function of demographic, urban, and socioeconomic variables”, it is suggested that all of the available demographic, urban, and socioeconomic variables should be modelled as independent variables, based on the results in the literature and practice. As for the economic volume, the restaurant sales should be modelled as the dependent variable.
Owing to the framework presented above, it is expected that the points which are not measurable in the conventional trade area models and which are questionable for the international QSRs will be clarified. In this model, it is foreseen that multiple variables can be handled, contrary to the single criterion approach of the Proximal Area Model. Furthermore, it is also expected that, unlike
Figure 4. Flow Chart Proposing a Model for International QSRs Site Selection
IC O N ARP. 20 18 .36 – E -I SSN : 21 47 -9380
Reilly’s model, the population can be considered heterogeneous and different population categories can be used in the model separately, and that the travel distance and time can be modelled separately. Unlike the Central Place Theory, which is quite theoretical, the framework at hand is expected to have practical and viable applications, where production and demand conditions can be used in many different ways. It is argued that, in addition to Huff model’s store variety, the framework will be able to use diverse criteria; that it will be a statistical and objective model unlike the subjective Analog Model; and that potential markets can be determined by sales forecasting, which is absent in the Geographic Interdependence Model. Thus, the inadequacies in the Traditional Trade Area Models regarding the site selection of the international QSRs, encountered in the literature and investigated in this study, can be overcome by an integrated model applicable in today’s conditions, in which Regression Analysis Methods and GIS are used in combination.
CONCLUSION
With this study, it is recognised that the sites of the international QSRs cannot be selected independently of the Trade Area analysis. The shortcomings of the Proximal Area Model, Reilly’s Retail Gravitation Model, Central Place Theory, Huff Model, Analog Model and Geographic Interdependence Model in today’s conditions for site selection of the international QSRs have been identified and following this path, GIS and Regression Analysis Methods have been examined within the scope of site selection for the international QSRs. As a result, a four-step theoretical framework incorporating GIS and Regression Analysis Methods have been put forward for modelling the site selection problems. Taking into consideration that, due to their high number, the international QSRs would affect city planning as well as the economic volume that they would create with a site selection based on the correct sales forecasts, an emphasis has been placed on the site selection according to trade area characteristics. In order to calculate the sales volume and to determine the market potential, the shortcomings of the conventional trade area models have been identified, and a theoretical framework, which can accommodate today’s variable dynamics and cover a wide range of criteria, has been developed to deal with such shortcomings. The principal aim of this assessment and the resulting proposed theoretical framework is to identify the characteristics of the international QSRs that affect the sales volume, and following this identification, to determine potential locations for the site selection and to measure the economic volume of the trade area
m e 6, Is su e 1 / Pu bli shed : Jun e 20 18
in the most accurate way. Owing to the accurate measurement of the economic volume, it is expected that the restaurants will be established in the right locations. It is expected that the research topic at hand will contribute to the development of sub-centres in urban areas and that the transportation planning and supply-demand balance will be affected positively by the land use decisions.
This study, being of the quality to guide the companies that have chosen Turkey as their new expansion market, provides a theoretical framework for establishing the right growth strategies for the city and regional planning systems, and for identifying which factors and methods should be used while determining investments. By adapting this theoretical model to different sectors, it is believed that it will positively affect the performance of the potential trade volume measurements for the decision of the correct site selection. For the future work, it is important to note that this study will shed light on the application phase and that a robust forecast for the economic volume will be made using the urban, demographic, and socioeconomic parameters of an international QSR, provided that a sufficient number of examples and reliable data are used in practice, and hence a correct site selection decision can be made
REFERENCES
Anderson, C.H., and M. Kaminsky. (1985). The Outshopper Problem: A Group Approach for Small Retailers. Entrepreneurship Theory and Practice, 9(3): 34-45. Anselin, L. (2003). Spatial externalities, spatial multipliers, and
spatial econometrics. International Regional Science Review, 26, 153-166.
Applebaum, W. (1966). Methods For Determining Store Trade Areas, Market Penetration, and Potential Sales. Journal of Marketing Research, 3, 127-141.
Berman, B. ve Evans J. R. (1992). Retail Management: A Strategic Approach (5th Edition). Mc Millan Publishing Co: New York.
Berman, B. ve Evans J. R. (2001). Retail. Management A Strategic Approach (8th Edition). USA: Prentice Hall.
Bhutta, K.S., Huq, F., Frazier, G. ve Mohamed, Z. (2003) An integrated location, production, distribution and investment model for a multinational corporation. Int. J. Prod. Econ. 86, 201–216.
Black, J.L., Carpiano, R.M., Fleming, S., Lauster, N. (2011). Exploring the distribution of food stores in British Columbia: Associations with neighbourhood socio-demographic factors and urban form. Health Place, 17, 961–970.
Brunsdon, D.; Fotheringham, A., S.; Charlton, M., E. (1996). Geographically Weighted Regression: A Method for
IC O N ARP. 20 18 .36 – E -I SSN : 21 47 -9380
Exploring Spatial Nonstationarity. Geographical Analysis, 28(4), 281–298.
Christaller, W. (1933). Die Zentralen Orte in Suddeutschland Jena (Translator : Baskın, C., 1966. The Central Places of Southern Germany Prentice Hall)
Clarkson, R.M., Clarke-Hill, C.M., Robinson T. (1996). UK supermarket location assessment. International Journal of Retail and Distribution Management, 24, 22–33.
Converse, P. D. (1949). “New laws of retail gravitation”, Journal of Marketing, 14, 379–384.
Craig, C. S., Ghosh, A. ve McLafferty, S. (1984). Models of the Retail Location Process: A Review. Journal of Retailing, 60-1, 5-36.
Cottrell, J. (1973). An environmental model of performance measurement in a chain of supermarkets. Journal of Retailing, 49, 51-63.
Cummins, S.C., McKay, L., MacIntyre, S. (2005). Mcdonald’s restaurants and neighborhood deprivation in Scotland and England. Am. J. Prev. Med. 29, 308–310.
Dennis, C., Marsland, D. ve Cockett, T. (2002). Central Place Practice: Shopping Center Attractiveness Measures, Hinterland Boundaries and the UK Retail Hierarchy. Journal of Retailing and Consumer Services, 9:185–199. Dökmeci, V. (2005). Ticaret Tesisleri Yerseçimi Modeli.
Planlamada Sayısal Yöntemler, 103-108, İTÜ, İstanbul. Dunne, P. ve Lusch, R. F. (1999). Retailing. Orlando: Dryden Press. Eckert, J., Shetty, S. (2011). Food systems, planning and quantifying access: Using GIS to plan for food retail. Appl. Geogr. 31, 1216–1223.
Eppli, M.J. ve Benjamin J.D. (1994). The Evolution of Shopping Center Research: A Review and Analysis. The Journal of Real Estate Research. 9:1, 5-32.
Fotheringham, S., Brunsdon, C., & Charlton, M. (2002). Geographically Weighted Regression: The Analysis of Spatially Varying Relationships. Chichester: Wiley.
Gautschi, D.A. (1981). Specification of Patronage Models for Retail Center Choice. Journal of Marketing Research, 18:2, 162-174.
Ghosh, A. ve McLafferty, S. L. (1987). Location strategies for retail and service firms. Lexington Books. 978- 0669120325, Lexington.
Ghosh, A. (1994). Retail Management. Orlando, FL: The Dryden Press.
Giddens, A. (2009). Sociology (6th Edition) Polity Press.
Hasty, R. ve Reardon, J. (1997). Retail Management, New York: McGraw Hill.
Huff, D. L. (1964). Defining and estimating a trading area. Journal of Marketing, 28, 34–38.
Ingene, C. A. ve Lusch, R. (1980). Market Selection Decisions or Department Stores. Journal of Retailing, 56: Fall, 21-40. Jacobs, M., & Scholliers, P. (2003). Eating out in Europe: Picnics,
gourmet dining, and snacks since the late eighteenth century. Oxford: BERG.
m e 6, Is su e 1 / Pu bli shed : Jun e 20 18
Jones, K.G. ve Mock, D.R. (1984). Evaluating Retail Trading Performances. In R.L. Davies, and D.S. Rogers (Eds.), Store Location and Store Assessment Research (333-360). Wiley, New York, NY.
Jones, K. ve Simmons, J. (1987). Location, location, location. Toronto: Methuen.
Koschatzky, K. (2012). Cluster quo vadis? The Future of The Cluster, Karlsruhe: Fraunhofer Institute for Systems and Innovation Research ISI.
Kuo, R.J., Chi, S.C. & Kao, S.S. (2002). A decision support system for selecting convenience store location through the integration of fuzzy AHP and artificial neural network. Computers in Industry, 47, 199-214.
Larson, N.I., Story, M.T., Nelson, M.C. (2009). Neighborhood environments: Disparities in access to healthy foods in the US. Am. J. Prev. Med. 36, 74–81.
Levy, M. ve Weitz, B. A. (1998). Retailing Management (3rd Edition). N.Y: Chicago: McGraw-Hills/Irwin
Levy, M. ve Weitz, B. A. (2009). Retailing Management (7th Edition). N.Y: The McGraw-Hills/Irwin.
Lösch, A. (1939). The Economics of Location, Translator : W. H. Woglom. New Haven: Yale University Press, 1954.
McGoldrick, P. (2002). Retail Marketing (2nd Edition), UK: McGraw-Hill
Morland, K., Wing, S., Roux, A.D., Poole, C. (2002). Neighborhood characteristics associated with the location of food stores and food service places. Am. J. Prev. Med. 22, 23–29. Mulligan, G. F., Partridge, M. D. ve Carruthers, J. I. (2012). Central
place theory and its reemergence in regional science. Annals of Regional Science, 48:405-431.
Mushinski, D. ve S. Weiler. (2002). A Note on the Geographic Interdependencies of Retail Market Areas. Journal of Regional Science, 42(1): 75-86.
Nieh, F.P., Pong, C.Y. (2012). Key success factors in catering industry management. Actual Probl. Econ. 130, 423–430. Ozuduru, B. (2006). An empirical analysis of shopping center
locations in Ohio. Internet: https://etd.ohiolink.edu/. Date Accessed: 5.11.2015.
Patel, A., Fik, T. ve Thrall, G.I. (2007). Trade Area Definition and Calculation, American Real Estate Society National Meeting, San Francisco, USA.
Park, C. (2004). Efficient or Enjoyable? Consumer Values of Eating Out and Fast Food Restaurant Consumption in Korea. International Journal of Hospitality Management, 23, 87-94.
Powell, L.M., Chaloupka, F.J., Bao, Y. (2007). The availability of fast-food and full-service restaurants in the United States: Associations with neighborhood characteristics. Am. J. Prev. Med. 33, 240–S245.
Sarıışık, M., Çavuş, Ş. ve Karamustafa K. (2010). Profesyonel Restoran Yönetimi İlkeler, Uygulamalar ve Örnek Olaylar. Ankara: Detay Press.