Phase diagram of the two-dimensional quantum electron freezing with external impurities
S. T. Chui
Bartol Research Institute, University of Delaware, Newark, Delaware 19716
B. Tanatar
Physics Department, Bilkent University, 06533 Ankara, Turkey ~Received 4 November 1996!
We discuss the phase diagram of the quantum electron solid-fluid transition in the presence of impurities in zero magnetic fields. This is based on recent improved understanding of the response function in both the fluid and the solid phases.@S0163-1829~97!03816-2#
Recently there has been much interest in the low-density limit of two-dimensional~2D! electrons in GaAs heterojunc-tions in an external magnetic field1 and Si-MOSFET’s
~metal-oxide-semiconductor field-effect transistors! in high
and zero field2where a freezing transition to a solid seems to occur as the density is lowered. Monte Carlo ~MC! simulations3and analytic calculations4for the pure system at zero magnetic field suggest that the solid-fluid transition oc-curs near rs'37. Here rs51/
A
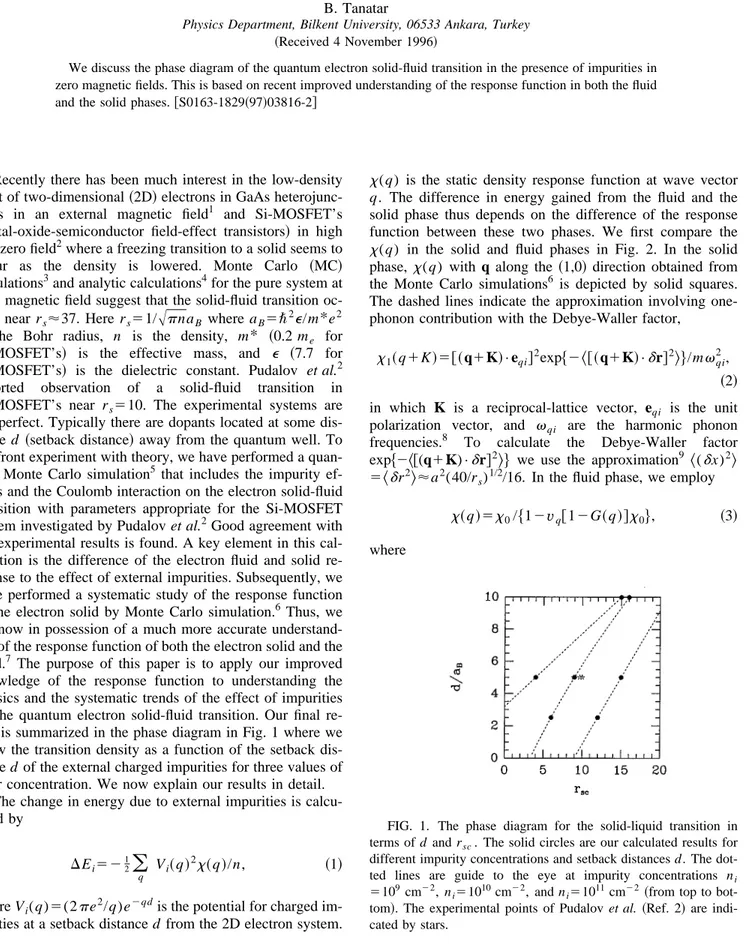
pnaB where aB5\2e/m*e2is the Bohr radius, n is the density, m* ~0.2 me for Si-MOSFET’s! is the effective mass, and e ~7.7 for Si-MOSFET’s! is the dielectric constant. Pudalov et al.2 reported observation of a solid-fluid transition in Si-MOSFET’s near rs510. The experimental systems are not perfect. Typically there are dopants located at some dis-tance d ~setback distance! away from the quantum well. To confront experiment with theory, we have performed a quan-tum Monte Carlo simulation5 that includes the impurity ef-fects and the Coulomb interaction on the electron solid-fluid transition with parameters appropriate for the Si-MOSFET system investigated by Pudalov et al.2Good agreement with the experimental results is found. A key element in this cal-culation is the difference of the electron fluid and solid re-sponse to the effect of external impurities. Subsequently, we have performed a systematic study of the response function of the electron solid by Monte Carlo simulation.6 Thus, we are now in possession of a much more accurate understand-ing of the response function of both the electron solid and the fluid.7 The purpose of this paper is to apply our improved knowledge of the response function to understanding the physics and the systematic trends of the effect of impurities on the quantum electron solid-fluid transition. Our final re-sult is summarized in the phase diagram in Fig. 1 where we show the transition density as a function of the setback dis-tance d of the external charged impurities for three values of their concentration. We now explain our results in detail.
The change in energy due to external impurities is calcu-lated by
DEi521
2
(
qVi~q!2x~q!/n, ~1!
where Vi(q)5(2pe2/q)e2qdis the potential for charged
im-purities at a setback distance d from the 2D electron system.
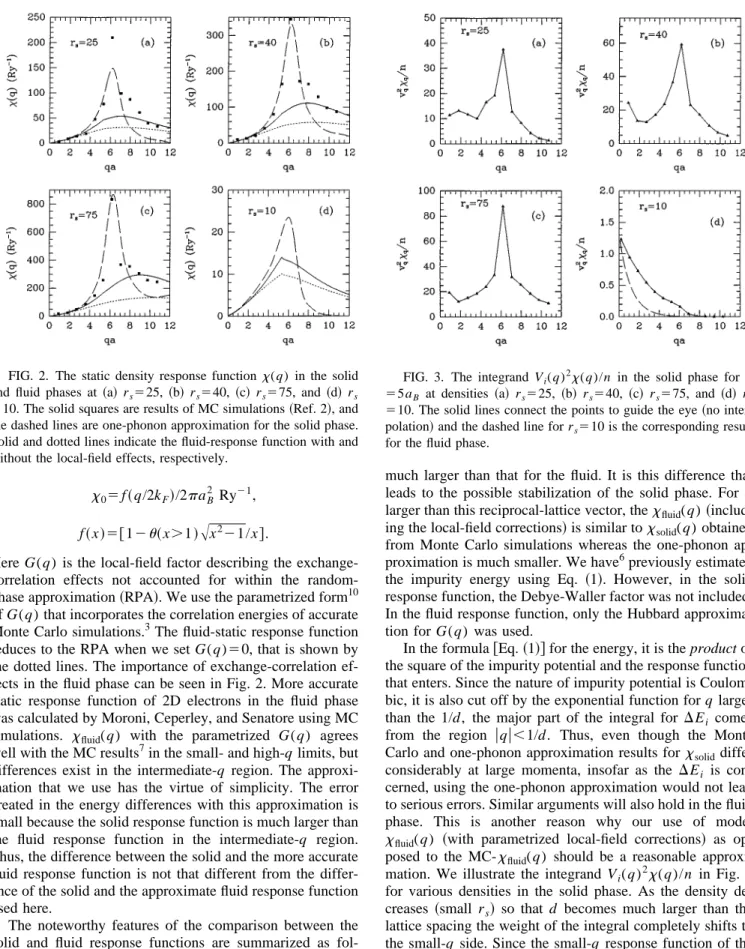
x(q) is the static density response function at wave vector q. The difference in energy gained from the fluid and the solid phase thus depends on the difference of the response function between these two phases. We first compare the
x(q) in the solid and fluid phases in Fig. 2. In the solid phase, x(q) with q along the ~1,0! direction obtained from the Monte Carlo simulations6 is depicted by solid squares. The dashed lines indicate the approximation involving one-phonon contribution with the Debye-Waller factor,
x1~q1K!5@~q1K!•eqi#2exp$2
^
@~q1K!•dr#2&
%/mvqi2
,
~2!
in which K is a reciprocal-lattice vector, eqi is the unit
polarization vector, and vqi are the harmonic phonon frequencies.8 To calculate the Debye-Waller factor exp$2
^
@(q1K)•dr#2&
% we use the approximation9^
(dx)2&
5
^
dr2&
'a2(40/rs)1/2/16. In the fluid phase, we employx~q!5x0/$12vq@12G~q!#x0%, ~3!
where
FIG. 1. The phase diagram for the solid-liquid transition in terms of d and rsc. The solid circles are our calculated results for
different impurity concentrations and setback distances d. The dot-ted lines are guide to the eye at impurity concentrations ni
5109
cm22, ni51010cm22, and ni51011cm22~from top to
bot-tom!. The experimental points of Pudalov et al. ~Ref. 2! are indi-cated by stars.
PHYSICAL REVIEW B VOLUME 55, NUMBER 15 15 APRIL 1997-I
55
x05 f~q/2kF!/2paB
2
Ry21, f~x!5@12u~x.1!
A
x221/x#.Here G(q) is the local-field factor describing the exchange-correlation effects not accounted for within the random-phase approximation~RPA!. We use the parametrized form10 of G(q) that incorporates the correlation energies of accurate Monte Carlo simulations.3The fluid-static response function reduces to the RPA when we set G(q)50, that is shown by the dotted lines. The importance of exchange-correlation ef-fects in the fluid phase can be seen in Fig. 2. More accurate static response function of 2D electrons in the fluid phase was calculated by Moroni, Ceperley, and Senatore using MC simulations. xfluid(q) with the parametrized G(q) agrees
well with the MC results7in the small- and high-q limits, but differences exist in the intermediate-q region. The approxi-mation that we use has the virtue of simplicity. The error created in the energy differences with this approximation is small because the solid response function is much larger than the fluid response function in the intermediate-q region. Thus, the difference between the solid and the more accurate fluid response function is not that different from the differ-ence of the solid and the approximate fluid response function used here.
The noteworthy features of the comparison between the solid and fluid response functions are summarized as fol-lows. In the solid phase, the one-phonon approximation
~with the Debye-Waller factor! represents the Monte Carlo
results rather well for small q at all densities. In fact, both the solid and fluidx(q) have the same long-wavelength limit as may be seen in Fig. 2. At intermediate values of q close to the reciprocal lattice vector, the solid response function is
much larger than that for the fluid. It is this difference that leads to the possible stabilization of the solid phase. For q larger than this reciprocal-lattice vector, thexfluid(q)
~includ-ing the local-field corrections! is similar toxsolid(q) obtained from Monte Carlo simulations whereas the one-phonon ap-proximation is much smaller. We have6previously estimated the impurity energy using Eq. ~1!. However, in the solid response function, the Debye-Waller factor was not included. In the fluid response function, only the Hubbard approxima-tion for G(q) was used.
In the formula@Eq. ~1!# for the energy, it is the product of the square of the impurity potential and the response function that enters. Since the nature of impurity potential is Coulom-bic, it is also cut off by the exponential function for q larger than the 1/d, the major part of the integral for DEi comes from the region uqu,1/d. Thus, even though the Monte Carlo and one-phonon approximation results for xsoliddiffer considerably at large momenta, insofar as the DEi is
con-cerned, using the one-phonon approximation would not lead to serious errors. Similar arguments will also hold in the fluid phase. This is another reason why our use of model
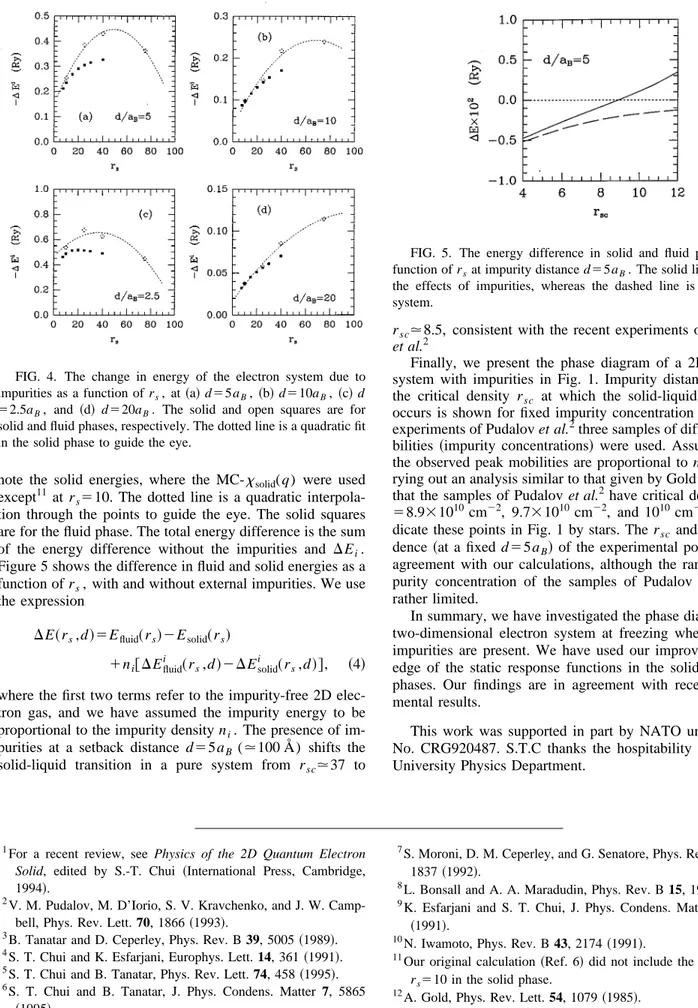
xfluid(q) ~with parametrized local-field corrections! as
op-posed to the MC-xfluid(q) should be a reasonable approxi-mation. We illustrate the integrand Vi(q)2x(q)/n in Fig. 3
for various densities in the solid phase. As the density de-creases ~small rs! so that d becomes much larger than the lattice spacing the weight of the integral completely shifts to the small-q side. Since the small-q response function of the fluid and the solid is the same, the difference in the energy gained from the external impurities becomes smaller the smaller the electron density is.
Our results of the perturbation calculation for the solid and fluid energies in the presence of impurities are given in Fig. 4 for various impurity distances. The open squares de-FIG. 2. The static density response functionx(q) in the solid
and fluid phases at ~a! rs525, ~b! rs540, ~c! rs575, and ~d! rs
510. The solid squares are results of MC simulations ~Ref. 2!, and the dashed lines are one-phonon approximation for the solid phase. Solid and dotted lines indicate the fluid-response function with and without the local-field effects, respectively.
FIG. 3. The integrand Vi(q)2x(q)/n in the solid phase for d
55aB at densities ~a! rs525, ~b! rs540, ~c! rs575, and ~d! rs
510. The solid lines connect the points to guide the eye ~no inter-polation! and the dashed line for rs510 is the corresponding result
for the fluid phase.
note the solid energies, where the MC-xsolid(q) were used
except11 at rs510. The dotted line is a quadratic interpola-tion through the points to guide the eye. The solid squares are for the fluid phase. The total energy difference is the sum of the energy difference without the impurities and DEi. Figure 5 shows the difference in fluid and solid energies as a function of rs, with and without external impurities. We use
the expression
DE~rs,d!5Efluid~rs!2Esolid~rs!
1ni@DEfluid
i ~rs,d!2DE
solid
i ~rs,d!#, ~4!
where the first two terms refer to the impurity-free 2D elec-tron gas, and we have assumed the impurity energy to be proportional to the impurity density ni. The presence of im-purities at a setback distance d55aB (.100 Å) shifts the solid-liquid transition in a pure system from rsc.37 to
rsc.8.5, consistent with the recent experiments of Pudalov et al.2
Finally, we present the phase diagram of a 2D electron system with impurities in Fig. 1. Impurity distance against the critical density rsc at which the solid-liquid transition
occurs is shown for fixed impurity concentration ni. In the
experiments of Pudalov et al.2three samples of differing mo-bilities ~impurity concentrations! were used. Assuming that the observed peak mobilities are proportional to ni and
car-rying out an analysis similar to that given by Gold12we infer that the samples of Pudalov et al.2have critical densities nc 58.931010 cm22, 9.731010cm22, and 1010 cm22. We
in-dicate these points in Fig. 1 by stars. The rsc and ni
depen-dence ~at a fixed d55aB! of the experimental points are in agreement with our calculations, although the range of im-purity concentration of the samples of Pudalov et al.2 are rather limited.
In summary, we have investigated the phase diagram of a two-dimensional electron system at freezing when charged impurities are present. We have used our improved knowl-edge of the static response functions in the solid and fluid phases. Our findings are in agreement with recent experi-mental results.
This work was supported in part by NATO under Grant No. CRG920487. S.T.C thanks the hospitability of Bilkent University Physics Department.
1For a recent review, see Physics of the 2D Quantum Electron
Solid, edited by S.-T. Chui ~International Press, Cambridge, 1994!.
2V. M. Pudalov, M. D’Iorio, S. V. Kravchenko, and J. W.
Camp-bell, Phys. Rev. Lett. 70, 1866~1993!.
3B. Tanatar and D. Ceperley, Phys. Rev. B 39, 5005~1989!. 4S. T. Chui and K. Esfarjani, Europhys. Lett. 14, 361~1991!. 5S. T. Chui and B. Tanatar, Phys. Rev. Lett. 74, 458~1995!. 6S. T. Chui and B. Tanatar, J. Phys. Condens. Matter 7, 5865
~1995!.
7S. Moroni, D. M. Ceperley, and G. Senatore, Phys. Rev. Lett. 69,
1837~1992!.
8L. Bonsall and A. A. Maradudin, Phys. Rev. B 15, 1959~1977!. 9K. Esfarjani and S. T. Chui, J. Phys. Condens. Matter 3, 5825
~1991!.
10N. Iwamoto, Phys. Rev. B 43, 2174~1991!. 11
Our original calculation~Ref. 6! did not include the response at rs510 in the solid phase.
12A. Gold, Phys. Rev. Lett. 54, 1079~1985!.
FIG. 4. The change in energy of the electron system due to impurities as a function of rs, at~a! d55aB, ~b! d510aB, ~c! d
52.5aB, and ~d! d520aB. The solid and open squares are for
solid and fluid phases, respectively. The dotted line is a quadratic fit in the solid phase to guide the eye.
FIG. 5. The energy difference in solid and fluid phases as a function of rsat impurity distance d55aB. The solid line includes
the effects of impurities, whereas the dashed line is for a pure system.