Epicardial adipose tissue thickness can be used to predict
major adverse cardiac events
Asli Tanindi, Aycan F. Erkan and Berkay Ekici
Objective Increase in epicardial adipose tissue (EAT) thickness is associated with subclinical and manifest coronary artery disease. In addition, it is associated with the severity and extent of coronary atherosclerosis. We aimed to investigate whether increased EAT thickness is associated with adverse cardiovascular outcomes.
Patients and methods Two hundred consecutive patients who were admitted with stable angina pectoris, unstable angina pectoris or acute myocardial infarction (MI), and had undergone coronary angiography were included and followed for revascularization, nonfatal MI, hospitalization for heart failure and cardiovascular death for 26 (5–30) months.
Results There were significantly more revascularizations, nonfatal MI and cardiovascular death in patients with an initial EAT thickness more than 7 mm (P < 0.001 for all). Significant predictors of cardiovascular death were identified as an EAT thickness more than 7 mm [hazard ratio (HR) 1.9, 95% confidence interval (CI) 0.4–8.3, P = 0.039] and diabetes (HR 3.42, 95% CI 0.7–17.5, P = 0.014) in the multivariate Cox regression analysis. Event-free survival for cardiovascular death in the EAT up to 7 mm group was
97.9%, whereas it was 90.7% in the EAT more than 7 mm group (P = 0.021). In addition, significant predictors of MI were identified as an EAT thickness more than 7 mm (HR 2.4, 95% CI 0.6–10.0, P = 0.021) and diabetes (HR 3.4, 95% CI 1.0–11.2, P = 0.04). Event-free survival for MI in the EAT up to 7 mm group was 96.4%, whereas it was 68.2% in the EAT more than 7 mm group (P = 0.001).
Conclusion Increase in EAT thickness independently predicts adverse cardiac events including MI and cardiovascular death. Coron Artery Dis 26:686–691 Copyright © 2015 Wolters Kluwer Health, Inc. All rights reserved.
Coronary Artery Disease2015, 26:686–691
Keywords: cardiovascular death, coronary revascularization, epicardial adipose tissue thickness, major adverse cardiac event, myocardial infarction
Department of Cardiology, Faculty of Medicine, Ufuk University, Ankara, Turkey Correspondence to Asli Tanindi, MD, Department of Cardiology, Dr. Rıdvan Ege Hospital, Faculty of Medicine, Ufuk University, Mevlana Bulvarı No. 86-88, Balgat, Ankara 06520, Turkey
Tel: + 90 312 204 4082; fax: + 90 312 204 4055; e-mail: [email protected] Received22 April 2015 Revised 17 June 2015 Accepted 16 July 2015
Introduction
Epicardial adipose tissue (EAT) is a specialized visceral adi-pose tissue (VAT) between visceral pericardium and myo-cardium [1], and it has been linked to coronary artery disease (CAD) risk factors, subclinical atherosclerosis and manifest CAD [2–5]. Many studies showed that EAT was associated with the extent and severity of CAD [6,7]. EAT has also been related to the presence of more vulnerable atherosclerotic plaques, detected using intravascular ultrasound [8]. We have recently shown that increased EAT thickness is associated with impaired epicardial and myocardial perfusion [9]. The proposed mechanism of the interaction between coronary atherosclerosis and EAT is that EAT secretes many proa-therogenic and proinflammatory hormones and cytokines, which may induce initiation and progression of CAD by endocrine and paracrine mechanisms [10].
Although there are considerable data on the relation between coronary atherosclerosis and EAT, there is limited information on whether these associations trans-late into hard clinical end points and major adverse car-diac events (MACEs). We aimed to search prospectively whether EAT thickness assessed using transthoracic echocardiography has an independent effect on clinical
outcomes such as cardiovascular death, nonfatal myo-cardial infarction (MI), hospitalization for heart failure and coronary revascularization in patients with CAD in the long term. We hypothesize that increased EAT thickness is associated with an increase in MACEs including coronary revascularization, MI and cardiovas-cular death, and might be used as a risk predictor.
Patients and methods
We consecutively enrolled 200 eligible patients with the clinical diagnosis of CAD who were admitted to our hospital with stable angina pectoris or acute coronary syndrome (ST-elevation myocardial infarction, non-ST-(ST-elevation myocardial infarction, unstable angina pectoris) between June 2012 and October 2012 and those who were decided to undergo cor-onary angiography and followed for cardiovascular outcomes after the index hospitalization. Exclusion criteria were a history of either surgical or percutaneous previous revascu-larization, pericardial effusion, more than moderate valvular pathology, poor echocardiographic imaging and patients who were lost to follow-up. Anthropometric parameters, previous medical history, presence of atherosclerosis risk factors and medications were recorded for each patient.
All echocardiographic measurements were performed by the same cardiologist, who had no knowledge of the patient’s clinical information, using a VIVID 7 ultrasound (VIVID 7 Pro; GE, Horten, Norway) with a 2.5–3.5 MHz transducer before performing coronary angiography. Each examination was recorded and two other cardiologists blinded to the clinical presentation interpreted the results offline. Parasternal and apical projections were obtained according to the recommendations of the American Society of Echocardiography. EAT thickness was measured from a standard parasternal long axis view on the free wall of the right ventricle perpendicular to the aortic annulus at end-systole. It was identified as the echo-free space between the outer wall of the myo-cardium and the visceral layer of the perimyo-cardium. The thickest point of EAT was measured each time and the average value of three cardiac cycles was recorded. Selective left and right coronary angiography was per-formed through the femoral artery using the standard Judkins technique with 6 Fr catheters (MediCath, Barcelona, Spain) using Toshiba Infinix CSI (Toshiba Corp., Tokyo, Japan). Gensini and SYNTAX scores were calculated to determine the extent, severity and com-plexity of CAD.
Patients were followed for a median of 26 months through hospital medical records, death certificates and telephone surveys. The primary outcome of the study was the occurrence of cardiovascular death. The sec-ondary outcomes were nonfatal MI, ischaemia-driven coronary revascularization and heart failure hospitaliza-tion after the index hospitalizahospitaliza-tion.
This study was carried out according to the recommen-dations of the Declaration of Helsinki on Biomedical Research involving human participants and was approved by the institutional ethics committee. Written informed consent was obtained from each participant.
The study population was analysed in two groups: up to 7 mm and more than 7 mm. This value was obtained by a receiver operating characteristic (ROC) curve analysis, which was carried out to define a cut-off value to divide and analyse the population into two categories, both for cardiovascular death and MI.
Statistical analysis
The SPSS statistical software (SPSS, 18.0 for Windows; SPSS Inc., Chicago, Illinois, USA) was used for all sta-tistical calculations. The Shapiro–Wilk test was used to test for normality. Continuous variables were described as means± SD or medians (minimum–maximum), whichever was appropriate. Numbers and percentages were used for qualitative variables. Theχ2-test was used to compare percentages; Fisher’s exact test was used when the expected minimum value was less than or equal to 5; the Yates correctedχ2-test was applied when the minimum expected value was between 5 and 25; and
the Pearson χ2-test was used when the minimum expected value was equal to or greater than 25. For the comparisons of continuous variables, Student’s t-test or the Mann–Whitney U-test was used according to the normality of distribution. A ROC curve analysis was carried out to define a cut-off value to divide the popu-lation into two categories both for cardiovascular death and MI. The Kaplan–Meier method was used for the survival analysis. Survival rates were compared using the log-rank test. Risk factors that could potentially affect survival were tested using Cox regression analysis and the variables that were found to be significant in the univariate model were included in the multivariate ana-lysis. Statistical significance was defined as P value less than 0.05.
Results
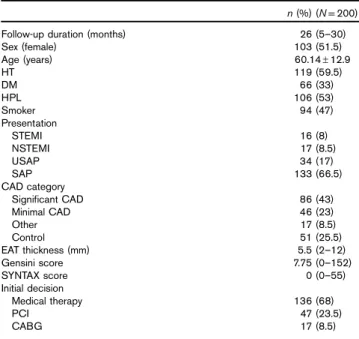
The baseline characteristics of the study population are provided in Table 1. The median duration of follow-up was 26 (5–30) months. Almost half of the patients were women, and the mean age of the study population was 60.1± 12.9. Approximately 66% of the patients were admitted with stable angina pectoris and 34% had acute coronary syndromes. Coronary angiographic findings and the choice of treatment at the onset of the study are also presented in Table 1.
Three patients died because of cardiovascular causes in the group with an EAT thickness up to 7 mm and there were five cardiovascular deaths in the group with an EAT
Table 1 Basal characteristics of the study population
n (%) (N= 200)
Follow-up duration (months) 26 (5–30)
Sex (female) 103 (51.5) Age (years) 60.14± 12.9 HT 119 (59.5) DM 66 (33) HPL 106 (53) Smoker 94 (47) Presentation STEMI 16 (8) NSTEMI 17 (8.5) USAP 34 (17) SAP 133 (66.5) CAD category Significant CAD 86 (43) Minimal CAD 46 (23) Other 17 (8.5) Control 51 (25.5) EAT thickness (mm) 5.5 (2–12) Gensini score 7.75 (0–152) SYNTAX score 0 (0–55) Initial decision Medical therapy 136 (68) PCI 47 (23.5) CABG 17 (8.5)
CABG, coronary artery bypass graft operation; CAD, coronary artery disease; DM, diabetes mellitus; EAT, epicardial adipose tissue; HPL, hyperlipidaemia; HT, hypertension; NSTEMI, non-ST-elevation myocardial infarction; other, ectasia, muscular bridge, slow or turbulent flow; PCI, percutaneous coronary intervention; SAP, stable angina pectoris; STEMI, ST-elevation myocardial infarction; USAP, unstable angina pectoris.
more than 7 mm. Incidence of primary end point was 2 versus 9.2% in patients with an EAT thickness up to 7 and more than 7 mm, respectively (P < 0.001). Incidences of secondary end points defined as nonfatal MI, coronary revascularization and hospitalization for heart failure were all significantly higher in patients with a greater EAT thickness (Table 2).
In the entire study population, there were 24 revascu-larizations in the follow-up period. Seventeen of these were patients with an EAT thickness more than 7 mm, whereas seven had an EAT up to 7 mm. At the initial hospitalization, 47 patients required a percutaneous cor-onary intervention. Eighteen out of these 47 patients underwent another revascularization at follow-up, and six of these 18 patients had an EAT thickness up to 7 mm, whereas 12 had more than 7 mm. Six out of 18 patients who were initially revascularized and underwent another revascularization at follow-up were ST-elevation myo-cardial infarction patients who had undergone primary percutaneous coronary intervention for the culprit lesion at the initial hospitalization. They received additional stent(s) for coronary atherosclerotic lesions other than the culprit, which were detected at the initial hospitalization, but deferred for a later intervention.
Five out of 136 patients, who were initially prescribed optimal medical therapy, were revascularized at follow-up; one of them had an EAT thickness less than 7 mm and four had more than 7 mm.
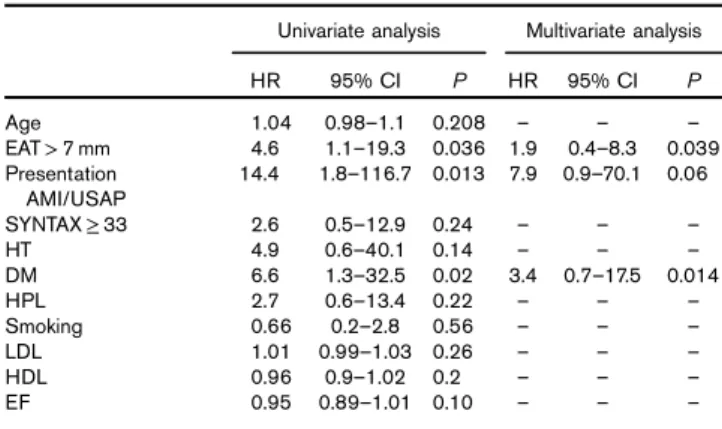
One out of 17 patients who had undergone a coronary bypass graft operation initially needed revascularization at follow-up, because of early saphenous graft failure, and this patient had an EAT thickness more than 7 mm. Univariate Cox regression analysis showed that EAT thickness more than 7 mm, presentation with an acute coronary syndrome and diabetes, among other possible correlates including age, presence of hyperlipidaemia, presence of hypertension, smoking status and ejection fraction, were found to be significant predictors of cardi-ovascular death (Table 3). However, in the multivariate Cox regression analysis, significant predictors of cardio-vascular death were identified as an EAT thickness more than 7 mm [hazard ratio (HR) 1.9, 95% confidence inter-val (CI) 0.4–8.3, P = 0.039] and diabetes (HR 3.42, 95%
CI 0.7–17.5, P = 0.014). Event-free survival in terms of cardiovascular death in the EAT up to 7 mm group was 97.9%, whereas it was 90.7% in the EAT more than 7 mm group (P = 0.021) (Fig. 1).
When regression analysis was carried out to identify predictors of MI, the univariate model showed that EAT thickness more than 7 mm, presentation with an acute coronary syndrome, diabetes, complex CAD defined as a SYNTAX score 33 or more, hyperlipidaemia and low-density lipoprotein were significant predictors (Table 4). However, in the multivariate model, significant Table 2 Major adverse cardiac events with respect to epicardial
adipose tissue thickness
n (%) (N= 200) EAT≤ 7 mm (n = 146) EAT > 7 mm (n = 54) P Revascularization 7 (4.7) 17 (31.4) < 0.001 MI 4 (2.7) 10 (18.5) < 0.001 HF hospitalization 9 (6.1) 13 (24) < 0.001 Cardiovascular death 3 (2) 5 (9) < 0.001 EAT, epicardial adipose tissue; HF, heart failure; MI, myocardial infarction. P< 0.05 is considered statistically significant.
Table 3 Univariate and multivariate Cox regression analyses for cardiovascular death
Univariate analysis Multivariate analysis
HR 95% CI P HR 95% CI P Age 1.04 0.98–1.1 0.208 – – – EAT> 7 mm 4.6 1.1–19.3 0.036 1.9 0.4–8.3 0.039 Presentation AMI/USAP 14.4 1.8–116.7 0.013 7.9 0.9–70.1 0.06 SYNTAX≥ 33 2.6 0.5–12.9 0.24 – – – HT 4.9 0.6–40.1 0.14 – – – DM 6.6 1.3–32.5 0.02 3.4 0.7–17.5 0.014 HPL 2.7 0.6–13.4 0.22 – – – Smoking 0.66 0.2–2.8 0.56 – – – LDL 1.01 0.99–1.03 0.26 – – – HDL 0.96 0.9–1.02 0.2 – – – EF 0.95 0.89–1.01 0.10 – – –
AMI, acute myocardial infarction; CI, confidence interval; DM, diabetes mellitus; EAT, epicardial adipose tissue; EF, ejection fraction; HDL, high-density lipoprotein; HPL, hyperlipidaemia; HR, hazard ratio; HT, hypertension; LDL, low-density lipo-protein; USAP, unstable angina pectoris.
P< 0.05 is considered as statistically significant.
Fig. 1 5.00 1.0 0.8 0.6 0.4 Log-rank P= 0.021 0.2 0.0 10.00 15.00 Time (months) Survival functions Event-free survival 20.00 25.00 30.00 EAT≤ 7 mm EAT>7 mm
Kaplan–Meier curve for cardiovascular death, showing event-free survival of patients with an epicardial adipose tissue (EAT) thickness up to 7 mm and more than 7 mm.
predictors of MI were identified as an EAT thickness more than 7 mm (HR 2.4, 95% CI 0.6–10.0, P = 0.021) and diabetes (HR 3.4, 95% CI 1.0–11.2, P = 0.04). Event-free survival for MI in the EAT thickness up to 7 mm group was 96.4%, whereas it was 68.2% in the EAT thickness more than 7 mm group (P = 0.001) (Fig. 2).
Discussion
In this study, it is shown that EAT thickness measured using conventional two-dimensional echocardiography may be used to predict major adverse cardiovascular events including MI and cardiovascular death.
EAT, which is in close proximity with coronary vessels, functions as a lipid depot, an endocrine organ and has inflammatory properties secreting many cytokines and chemokines [11]. In fact, EAT is a specialized VAT, and as any other VAT, it is associated with correlates of car-diovascular disease such as waist circumference, hyper-lipidaemia, diabetes and fasting blood glucose or insulin levels not only in patients with diabetes but also in nondiabetic individuals [12–15]. However, in many clinical studies, EAT was found to be associated with the presence and severity of CAD independent of these cardiovascular risk factors [6,16].
Sacks and Fain [17] reported an association between EAT and unstable clinical presentation. In addition, intravascular ultrasound studies showed that greater EAT volume was associated with features of vulnerable plaque [18,19]. These cross-sectional studies, which highlight a relationship between EAT and unstable clinical condi-tion, are hypothesis generating in terms of associations between EAT and MACEs. Hajsadeghi et al. [20] fol-lowed 245 patients with suspected CAD who underwent computed tomography (CT) angiography for 48 months. Their primary outcome was MI or cardiovascular death, and it was found that event-free survival decreased from
99% in the lowest quartile of EAT to 86.6% in the highest quartile [20]. In contrast, Albuquerqueet al. [21] found that EAT measured using echocardiography was not a strong predictor of MACE in patients with CAD. However, in that study, MACE was defined as the diagnosis of acute coronary syndrome, coronary revascu-larization, stroke, ventricular arrhythmias and death from any cause.
Cheng et al. [22] evaluated 2751 asymptomatic patients without CAD from a registry, and compared 58 patients with MACE and 174 age-matched and sex-matched event-free individuals. They reported that patients with MACE showed a greater pericardial fat volume on pre-MACE CT, and pericardial fat volume helped to predict MACE after adjustment for the Framingham risk score, coronary calcium score and BMI [22].
The Heinz–Nixdorf Recall Study was one of the largest and most informative studies on the association between EAT volume assessed using CT and fatal and nonfatal coronary events [23]. They found that greater EAT volume was associated with excessive risk for coronary events, independent of traditional cardiovascular risk factors. This finding was also independent of the cor-onary calcium score; in fact, they did not find a correlation between EAT and the coronary calcium score, in contrast to the large MESA study, where a significant association was reported between EAT and coronary calcification [24]. The Heinz–Nixdorf study and MESA studies were carried out in a population-based cohort, free of cardio-vascular disease; however, the present study included Table 4 Univariate and multivariate Cox regression analyses for
myocardial infarction
Univariate analysis Multivariate analysis
HR 95% CI P HR 95% CI P Age 1.04 0.99–1.09 0.10 – – – EAT> 7 mm 6.0 1.9–19.3 0.002 2.4 0.6–10.0 0.021 Presentation AMI/USAP 5.1 1.6–16.4 0.006 2.22 0.6–7.7 0.21 SYNTAX≥ 33 5.5 1.9–15.7 0.002 1.83 0.5–6.4 0.34 HT 1.8 0.6–5.6 0.34 – – – DM 5.7 1.8–18.4 0.003 3.4 1.0–11.2 0.04 HPL 1.45 0.48–4.33 0.047 1.762 0.5–6.3 0.38 Smoking 0.61 0.21–1.84 0.39 – – – LDL 1.01 0.99–1.02 0.04 1.01 0.99–1.02 0.46 HDL 0.96 0.9–1.01 0.14 – – – EF 0.96 0.9–1.0 0.10 – – –
AMI, acute myocardial infarction; CI, confidence interval; DM, diabetes mellitus; EAT, epicardial adipose tissue; EF, ejection fraction; HDL, high-density lipoprotein; HPL, hyperlipidaemia; HR, hazard ratio; HT, hypertension; LDL, low-density lipo-protein; USAP, unstable angina pectoris.
P<0.05 is considered statistically significant.
Fig. 2 Survival functions Event-free survival Time (months) 5.00 1.0 0.8 0.6 Log-rank P= 0.001 0.4 0.2 0.0 10.00 15.00 20.00 25.00 30.00 EAT≤ 7 mm EAT>7 mm
Kaplan–Meier curve for myocardial infarction, showing event-free survival of patients with an epicardial adipose tissue (EAT) thickness up to 7 mm and more than 7 mm.
patients with the clinical diagnosis of CAD. In addition, the present study was also different from the Heinz–Nixdorf study with respect to baseline character-istics; our participants were relatively leaner in terms of waist circumference, and yet tended to have a higher percentage of type 2 diabetes mellitus.
Another difference in the design of the present study is the method used to assess the amount of EAT. In lieu of more costly tomographic EAT volume assessment, we opted for the widely available and less costly echocardiographic EAT thickness measurement. Echocardiographic EAT thick-ness shows a good correlation with tomographic EAT volume [25,26]. To the best of our knowledge, the present study is the first to show that echocardiographic EAT thickness independently predicts future major adverse cardiovascular events. Of course, EAT has yet to be established as a routinely used risk predictor, if ever. An ideal biomarker should reflect the degree of athero-sclerosis, predict cardiovascular events and improve with intervention. In addition, it would be further desirable if a biomarker could be measured easily and noninvasively, and the measurement was reproducible and standar-dized [27].
There has been quite a debate on the preferred method to measure EAT and on the range that should be con-sidered normal. Although EAT has been studied for more than a decade, there is no universally accepted cut-off point, above which it can definitely be considered abnormal. Many studies have provided cut-off values for EAT from different points of view, such as the associa-tion with atherosclerosis, subclinical atherosclerosis, pre-sence of atherosclerotic CAD, extent of CAD, plaque morphology, etc. Thus, there are many proposed EAT cut-off values in the literature [28]. We divided our study population with respect to an EAT thickness of 7 mm because it was the cut-off obtained in ROC curve analysis for cardiovascular death and MI and it was in accordance with the cut-off used in a previous report from our group, in which we found that EAT thickness was associated with MI and impaired coronary perfusion [9].
The main limitation of the study is the small sample size and the medium duration of follow-up, which limits the number of detected adverse events. Second, we mea-sured EAT thickness using echocardiography, but not EAT volume using cardiac CT or MRI. However, in many studies, echocardiography has been proved to show good correlation with more advanced imaging techniques [26,27], and it is advantageous over CT or MRI because it is cheap and easily available in almost all cardiology clinics. Finally, we did not perform serial measurements of EAT thickness in the clinical follow-up, which could add value to the present study.
In conclusion, measurement of EAT thickness using conventional echocardiography can be used as a risk determinant besides well-known clinical risk factors, and
coronary angiographic findings, for MACEs including MI and cardiovascular death. Patients with a greater EAT thickness might be candidates for more aggressive risk reduction strategies if the findings of this study are sup-ported by larger future studies.
Acknowledgements
Conflicts of interest
There are no conflicts of interest.
References
1 Iacobellis G, Malavazos AE, Corsi MM. Epicardial fat: from the biomolecular aspects to the clinical practice. Int J Biochem Cell Biol 2011;
43:1651–1654.
2 Iacobellis G, Ribaudo MC, Assael F, Vecci E, Tiberti C, Zappaterreno A, et al. Echocardiographic epicardial adipose tissue is related to anthropometric and clinical parameters of metabolic syndrome: a new indicator of
cardiovascular risk. J Clin Endocrinol Metab 2003; 88:5163–5168. 3 Wang CP, Hsu HL, Hung WC, Yu TH, Chen YH, Chiu CA, et al. Increased
epicardial adipose tissue (EAT) volume in type 2 diabetes mellitus and association with metabolic syndrome and severity of coronary atherosclerosis. Clin Endocrinol (Oxf) 2009; 70:876–882.
4 Kocaman SA, Durakoğlugil ME, Cetin M, Erdoğan T, Ergül E, Canga A. The independent relationship of epicardial adipose tissue with carotid intima–media thickness and endothelial functions: the association of pulse wave velocity with the active facilitated arterial conduction concept. Blood Press Monit 2013; 18:85–93.
5 Doesch C, Haghi D, Suselbeck T, Schoenberg SO, Borggrefe M, Papavassiliu T. Impact of functional, morphological and clinical parameters on epicardial adipose tissue in patients with coronary artery disease. Circ J 2012; 76:2426–2434.
6 Kim SH, Chung JH, Kwon BJ, Song SW, Choi WS. The associations of epicardial adipose tissue with coronary artery disease and coronary atherosclerosis. Int Heart J 2014; 55:197–203.
7 Yüce G, Türkvatan A, Yener Ö. Can aortic atherosclerosis or epicardial adipose tissue volume be used as a marker for predicting coronary artery disease? J Cardiol 2015; 65:143–149.
8 Yamashita K, Yamamoto MH, Ebara S, Okabe T, Saito S, Hoshimoto K, et al. Association between increased epicardial adipose tissue volume and coronary plaque composition. Heart Vessels 2014; 29:569–577. 9 Tanındı A, Kocaman SA, Erkan AF, Uğurlu M, Alhan A, Töre HF. Epicardial
adipose tissue thickness is associated with myocardial infarction and impaired coronary perfusion. Anatol J Cardiol 2015; 15:224–231. 10 Xu Y, Cheng X, Hong K, Huang C, Wan L. How to interpret epicardial
adipose tissue as a cause of coronary artery disease: a meta-analysis. Coron Artery Dis 2012; 23:227–233.
11 Sacks HS, Fain JN. Human epicardial adipose tissue: a review. Am Heart J 2007; 153:907–917.
12 Pierdomenico SD, Pierdomenico AM, Neri M, Cuccurullo F. Epicardial adipose tissue and metabolic syndrome in hypertensive patients with normal body weight and waist circumference. Am J Hypertens 2011;
24:1245–1249.
13 Iacobellis G, Diaz S, Mendez A, Goldberg R. Increased epicardial fat and plasma leptin in type 1 diabetes independently of obesity. Nutr Metab Cardiovasc Dis 2014; 24:725–729.
14 Iacobellis G, Barbaro G, Gerstein HC. Relationship of epicardial fat thickness and fasting glucose. Int J Cardiol 2008; 128:424–426. 15 Chun H, Suh E, Byun AR, Park HR, Shim KW. Epicardial fat thickness is
associated to type 2 diabetes mellitus in Korean men: a cross-sectional study. Cardiovasc Diabetol 2015; 14:46.
16 Pierdomenico SD, Pierdomenico AM, Cuccurullo F, Iacobellis G. Meta-analysis of the relation of echocardiographic epicardial adipose tissue thickness and the metabolic syndrome. Am J Cardiol 2013; 111:73–78. 17 Sacks HS, Fain JN. Human epicardial fat: what is new and what is missing?
Clin Exp Pharmacol Physiol 2011; 38:879–887.
18 Ahn SG, Lim HS, Joe DY, Kang SJ, Choi BJ, Choi SY, et al. Relationship of epicardial adipose tissue by echocardiography to coronary artery disease. Heart 2008; 94:e7.
19 Alexopoulos N, McLean DS, Janik M, Arepalli CD, Stillman AE, Raggi P. Epicardial adipose tissue and coronary artery plaque characteristics. Atherosclerosis 2010; 210:150–154.
20 Hajsadeghi F, Nabavi V, Bhandari A, Choi A, Vincent H, Flores F, et al. Increased epicardial adipose tissue is associated with coronary artery disease and major adverse cardiovascular events. Atherosclerosis 2014; 237:486–489.
21 Albuquerque FN, Somers VK, Blume G, Miranda W, Korenfeld Y, Calvin AD, et al. Usefulness of epicardial adipose tissue as predictor of cardiovascular events in patients with coronary artery disease. Am J Cardiol 2012; 110:1100–1105.
22 Cheng VY, Dey D, Tamarappoo B, Nakazato R, Gransar H, Miranda-Peats R, et al. Pericardial fat burden on ECG-gated noncontrast CT in asymptomatic patients who subsequently experience adverse cardiovascular events. JACC Cardiovasc Imaging 2010; 3:352–360.
23 Mahabadi AA, Berg MH, Lehmann N, Kälsch H, Bauer M, Kara K, et al. Association of epicardial fat with cardiovascular risk factors and incident myocardial infarction in the general population: the Heinz Nixdorf Recall Study. J Am Coll Cardiol 2013; 61:1388–1395.
24 Ding J, Hsu FC, Harris TB, Liu Y, Kritchevsky SB, Szklo M, et al. The association of pericardial fat with incident coronary heart disease: the Multi-Ethnic Study of Atherosclerosis (MESA). Am J Clin Nutr 2009;
90:499–504.
25 Iacobellis G, Willens HJ. Echocardiographic epicardial fat: a review of research and clinical applications. J Am Soc Echocardiogr 2009; 22:1311–1319.
26 Iacobellis G, Assael F, Ribaudo MC, Zappaterreno A, Alessi G, Di Mario U, Leonetti F. Epicardial fat from echocardiography: a new method for visceral adipose tissue prediction. Obes Res 2003; 11:304–310.
27 Yamada H, Sata M. Does echocardiographic epicardial adipose tissue thickness become a useful biomarker? J Atheroscler Thromb 2015; 22:555–556.
28 Bertaso AG, Bertol D, Duncan BB, Foppa M. Epicardial fat: definition, measurements and systematic review of main outcomes. Arq Bras Cardiol 2013; 101:e18–e28.