INVESTIGATING THE MECHANISMS OF TELOMERE
MAINTENANCE IN ZEBRAFISH TISSUES AND
HUMAN BRAIN CANCER CELL LINES
A THESIS SUBMITTED TO
THE GRADUATE SCHOOL OF ENGINEERING AND SCIENCE
OF BILKENT UNIVERSITY
IN PARTIAL FULFILLMENT OF THE REQUIREMENTS FOR
THE DEGREE OF
MASTER OF SCIENCE
IN
NEUROSCIENCE
By
Naz Şerifoğlu
September 2019
INVESTIGATING THE MECHANISMS OF TELOMERE MAINTENANCE IN ZEBRAFISH TISSUES AND HUMAN BRAIN CANCER CELL LINES
By Naz Şerifoğlu
September 2019
We certify that we have read this thesis and that in our opinion it is fully adequate, in scope and in quality, as a thesis for the degree of Master of Science.
Michelle Marie Adams (Advisor)
Ayça Arslan Ergül (Co-Advisor)
Fahriye Duygu Çetinkaya
Urartu Özgür Şafak Şeker Approved for the Graduate School of Engineering and Science
Ezhan Karaşan
ABSTRACT
INVESTIGATING THE MECHANISMS OF TELOMERE MAINTENANCE IN ZEBRAFISH TISSUES AND HUMAN BRAIN CANCER CELL LINES
Naz Şerifoğlu M.Sc. in Neuroscience Advisor: Michelle Marie Adams
Co-Advisor: Ayça Arslan Ergül September 2019
Telomeres are nucleoprotein complexes formed at each end of the chromosomes to protect these ends from deterioration. In each round of cellular division, telomeric sequences shorten due to the end replication problem of DNA polymerase. Progressive telomere shortening results in replicative senescence in healthy somatic cells. To evade replicative senescence, cells need to maintain their telomere length either by activating the telomerase enzyme or through the alternative lengthening of telomeres (ALT). Telomerase is a holoenzyme, which is composed of dyskerin, telomerase RNA subunit (TR or TERC), and telomerase catalytic subunit (TERT). Dyskerin and TR are constitutively expressed in all cells but TERT expression is silenced in adult somatic cells. Thus, telomerase activity is dependent on the expression of TERT. Current studies show that TERT re-activation is a common feature of cancer cells and 85-90% of cancers utilize telomerase enzyme in maintaining telomeres to become immortal. Remaining of cancer cells maintain their telomeres by the alternative lengthening of telomeres (ALT), which is a DNA repair pathway dependent mechanism. Current models suggest that ALT is achieved by homology-directed DNA repair, through the interaction of multiple proteins.
DNA methylation is regarded as a key player in epigenetic silencing of transcription. DNA methyltransferase inhibitors are currently being used in cancer treatments. Recent studies show that DNA methyltransferases and their expression levels impact both telomerase- and ALT mediated lengthening of telomeres, and have different outcomes in different tissue types.
In this study, we worked on the zebrafish brain and human brain cancer cell lines. In zebrafish brain, we observed differences in methylated regions at Sp1 binding site between young and old that can be associated with telomere shortening. By silencing DNMT1 and DNMT3B in brain cancer cell lines, we investigated the changes in gene expression levels of telomerase and ALT related genes, telomerase activity, population doubling time and replicative senescence status. To further investigate TERT regulation, we introduced mutations to the Sp1 binding sites in the promoter region and measured the promoter activity with luciferase assay. Our results show that Sp1 methylation sites in the telomerase promoter region are critical in brain aging, dependent on their position. We propose a therapeutical option for brain aging and tumorigenesis.
Keywords: Aging, zebrafish, brain cancers, telomerase, TERT, ALT, Sp1, gene expression, qTRAP, site-directed mutagenesis
ÖZET
ZEBRABALIĞI DOKULARINDA VE İNSAN BEYİN KANSERLERİNDE TELOMERLERİN SÜRDÜRÜLME MEKANİZMALARININ İNCELENMESİ
Naz Şerifoğlu
Nörobilim Lisansüstü Programı, Yüksek Lisans Tez Danışmanı: Michelle Marie Adams
Tez Eş Danışmanı: Ayça Arslan Ergül Eylül 2019
Telomerler kromozom sonlarında bulunan nükleoprotein yapılardır ve kromozom uçlarını korurlar. Hücre bölünmesinin her turunda telomerler, DNA polimerazın çalışma mekanizmasına bağlı olarak kısalırlar. Telomer uzunluğu kritik bir uzunluğun altına düştüğünde, sağlıklı somatik hücreler replikatif senesense girerler. Replikatif senesensi atlatmak için hücrelerin telomer uzunluklarını korumaraları gerekmektedir. Bu telomeraz enzimi veya telomerlerin alternatif uzatılması (ALT) ile sağlanabilir. Telomeraz holoenzimi diskerin, telomeraz RNA alt ünitesi (TR veya TERC) ve telomeraz katalitik alt ünitesinden (TERT) oluşur. Diskerin ve TR hücrelerde her daim sentezlenir ancak TERT ifadesi erişkin somatik hücrelerde susturulur. Buna bağlı olarak telomeraz aktivitesi, TERT geninin ifade edilmesine bağlıdır. Güncel yayınlar göstermektedir ki TERT geninin yeniden aktive edilmesi kanser hücrelerinin sık görülen bir özelliğidir. Kanserlerin %85-90’ı telomeraz enzimi ile telomer uzunluklarını sürdürürler ve ölümsüzlüklerini sağlarlar. Geriye kalan kanser hücreleri, telomerlerini ALT ile devam ettirirler. ALT DNA tamir mekanizması temelli bir yolaktır. Güncel modeller ALT mekanizmasını çoklu protein etkileşimiyle sağlanan homolog rekombinasyon tamiri ile açıklar.
DNA metilasyonu, gen ifadesinin susturulmasında önemli bir epigenetik yol olarak kabul edilmektedir. DNA metilasyonunu engelleyen ajanlar günümüzde kanser tedavilerinde kullanılmaktadır. Yakın zamanda yapılan çalışmalar göstermiştir ki DNA metiltransferaz enzimleri ve ifade seviyeleri, hem telomeraz enzimine bağlı hem de ALT mekanizmasına bağlı telomer uzunluğu sürdürülmesini doku tipine bağlı olarak etkilemektedir. Biz bu çalışmada Genç ve yaşlı zebrabalığı beyinlerinde, Sp1 bağlanma bölgesinde metilasyon seviyesinde farkları gözlemledik. Bu metilasyon farklarının telomer uzunluğunu etkilediğini düşünüyoruz. DNMT1 ve DNMT3B ifadesini engellediğimiz insan beyin kanseri hatlarında, telomeraz ve ALT mekanizmasıyla ilgili genlerin ifade seviyesini, telomeraz aktivitesini, popülasyon katlanma zamanını ve replikatif senesens durumunu inceledik. TERT promotor aktivitesini lusiferaz ölçümü ile, Sp1 bağlanma bölgelerinde, bölgeye yönelik mutasyonlar varlığında ve yokluğunda hesap ettik. Bulgularımız TERT promotor bölgesinde Sp1 metilasyon alanlarının, pozisyona bağlı olarak, beyin yaşlanmasında önemli olduğunu göstermektedir. Biz sonuçlarımız doğrultusunda beyin yaşlanması ve tümör oluşumu için bir tedavi seçeneği önermekteyiz.
Anahtar Sözcükler: Yaşlanma, zebrabalığı, beyin kanserleri, telomeraz, TERT, ALT, Sp1, gen ifadesi, qTRAP, bölgeye yönelik mutasyon
Acknowledgment
I want to thank Prof. Michelle M. Adams and Assoc. Prof Ayça Arslan Ergül for their guidance, support and allowing me to work on this project. I am grateful to them for always being open to my ideas and trusting my decisions. I have learned a lot from them, and I am honored to have them as advisors.
I would like to thank Prof. Duygu F. Uçkan Çetinkaya and Assoc. Prof Urartu Özgür Şafak Şeker for their kindness on accepting to take part in my thesis committee. I am thankful to Prof. Duygu F. Uçkan Çetinkaya for also allowing me to conduct experiments at PEDI-STEM, Hacettepe University.
I consider my self very lucky to know and work with my labmates. Narin Ilgım Ardıç and Begün Erbaba never failed to make me smile. Bihter Muratoğlu, Melis Temel, Rumeysa Tuncer, Cansu Üstüner, Melek Umay Tüz, and Elif Tuğçe Karoğlu, I am thankful for their support and their friendship. I would also like to thank my friends at PEDI-STEM, Hacettepe University, for their positive energy and welcoming nature.
I am thankful to Barış Oralalp, Yiğit Yılmaz, Eylül Celtemen, Gülce Kale, and Mustafa Ege Can Şulan for their friendship and support in every aspect of my life.
Finally, I would like to express my profound gratitude to my family, Mefaret and Refik Şerifoğlu, for providing me with unconditional love, support, and encouragement. I could not have written the thesis without their help. Thank you.
Experiments in this thesis were supported partially by The Scientific and Technological Research Council of Turkey 1001 grant (no: 114S548) and two Hacettepe University Scientific BAP grants (no: 2017-15492 and no: THD-2018-16904).
TABLE OF CONTENTS
ABSTRACT ... i
ÖZET ... iv
Acknowledgment ... vi
TABLE OF CONTENTS ... vii
LIST OF TABLES ... x
LIST OF FIGURES ... xi
CHAPTER 1 ... 1
INTRODUCTION ... 1
1.1. Telomeres: Structure and Function ... 1
1.2. Replicative Senescence ... 2
1.3. Telomerase ... 4
1.4. TERT Re-activation and Telomerase Regulation in Cancer ... 5
1.5. ALT Mechanisms in Cancer ... 8
1.6 DNA Methyltransferases, Cancer, and Stemness ... 12
CHAPTER 2 ... 14
OBJECTIVES AND RATIONALE: ... 14
CHAPTER 3 ... 16
MATERIALS AND METHODS ... 16
3.1 Materials ... 16
3.1.1. Cell Culture Reagents ... 16
3.1.2. General Enzymes ... 16
3.1.3. General Kits, Reagents and Chemicals ... 17
3.1.4. Cloning Enzymes and Buffers ... 18
3.1.5. Microbiology Reagents and Solution Recipes ... 19
3.1.6. siRNAs and Reagents ... 19
3.1.7 qTRAP Buffers and Reagents ... 20
3.1.8 Equipments used ... 21 3.2 Methods... 21 3.2.1. Zebrafish Maintenance: ... 21 3.2.2. Tissue Collection: ... 21 3.2.3. Cell Culture: ... 23 3.2.4. DNA Isolation: ... 23 3.2.5. Bisulfite Conversion: ... 25
3.2.6. PCR for TERT Promoter Sites:... 27
3.2.7. PCR for Bisulfite Sequencing: ... 28
3.2.8. PCR Clean Up: ... 28
3.2.9. Restriction Enzyme Digestion: ... 29
3.2.10. DNA Clean Up: ... 29
3.2.11. DNA Ligation: ... 30
3.2.12. Transformation: ... 30
3.2.13. Colony PCR: ... 31
3.2.14. Plasmid Isolation:... 31
3.2.15. Site Directed Mutagenesis of TERT Promoter: ... 33
3.2.17. Luciferase Assay: ... 36
3.2.18. siRNA Transfection: ... 37
3.2.19. Azacytidine and Adriamycin Treatment of Cell Lines: ... 38
3.2.20. RNA Isolation: ... 38
3.2.21. cDNA Synthesis: ... 39
3.2.22. qPCR: ... 40
3.3.23. Population Doubling Assay: ... 41
3.3.24. Beta Galactosidase Staining: ... 41
3.3.25. Telomere Length Measurement: ... 42
3.3.26. qTRAP: ... 43
3.3.27. Statistical Analysis: ... 44
CHAPTER 4 ... 46
RESULTS ... 46
4.1. Telomere Lengths Change Throughout Aging in All Organs ... 46
4.2. Brain Samples Show Variation in Distal Upstream Zebrafish TERT Gene Methylation ... 47
4. 3. Hypomethylation at ch19: 627,118 (-972 from tert transcription start site) is Related with Aging in Zebrafish Brains ... 51
4. 4. Mutations at SP1 Binding Sites Abrogate Promoter Activity in Brain Cancer Cell Lines ... 51
4.5. DNA Methylation Inhibition Through RNAi Does Not Change Population Doubling Time in Brain Cancer Cell Lines ... 54
4.6. Inhibition of DNA Methylation Have Different Outcomes on Cellular Senescence Induction Depending on Cell Type ... 55
4.7. Inhibition of De Novo DNA Methylation Machinery Affects Telomerase Activity in Brain Cancers ... 57
4.8. Inhibition of DNA Methyltransferases Does Not Change TERT Expression however, Changes hTR Expression in Brain Cancer Cell Lines ... 58
4.9. Inhibition of DNA Methyltransferases Show Cell Specific Effects on ALT Associated Genes in Brain Cancer Cell Lines ... 63
4.10. Short Term Inhibition of DNA Methyltransferases Do Not Change Telomere Length Significantly ... 69
CHAPTER 5 ... 70
DISCUSSION ... 70
5.1. Variation in Telomere Length is Related to the Regenerative Capacity of the Organs ... 70
5.2. Methylation Variation at TERT Promoter Can Affect Sp1 Binding to Target Sites And Hypomethylation at -972th position is only seen in old zebrafish brains ... 70
5.3. SP1 Binding to Target Sequences is Required for TERT Promoter Activity in Brain Cancer Cell Lines ... 71
5.4. Short Term Silencing of DNA Methyltransferases Do Not Change Population Doubling Times however Changes the Induction of Cellular Senescenc between Cell Types ... 72
5.5. Inhibiting the De Novo DNA Methylation, Not the Maintenance DNA Methylation, Reduces Telomerase Activity ... 72
5.6. Expression of the Catalytic Subunit of Telomerase Holoenzyme Does Not Change Significantly with RNAi but Telomerase RNA Component Expression
Depends on DNA Methylation ... 73
5.7. ALT Associated Genes Show Variable Response to the Inhibition of DNA Methylation Depending on the Cell Type ... 74
5.8. Short Term Silencing of DNA Methyltransferases Do Not Change the Telomere Lengths ... 76
CHAPTER 6 ... 77
CONCLUSIONS AND FUTURE PROSPECTS ... 77
REFERENCES ... 79
APPENDIX ... 88
A.1 Plasmid Design and Site Directed Mutagenesis Targets ... 88
A.2 Sequences of Plasmids Used ... 88
LIST OF TABLES
Table 3.1.1: List of cell culture reagents ... 16
Table 3.1.2: List of general enzymes ... 16
Table 3.1.3: List of general kits, reagents and chemicals ... 17
Table 3.1.4: List of cloning reagents ... 18
Table 3.1.5: List of microbiology reagents and solution recipes ... 19
Table 3.1. 6: List of siRNA and Reagents ... 19
Table 3.1.7: List of qTRAP Buffers and Reagents ... 20
Table 3.1.8: List of Equipments Used ... 21
Table 3.2.1: List of zebrafish used in tissue collection. ... 22
Table 3.2.2: Primer pairs used in site directed mutagenesis experiments, and final concentrations in the reaction. ... 34
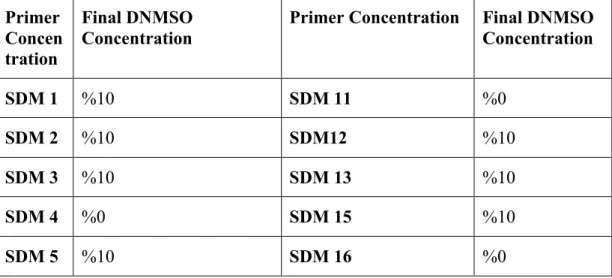
Table 3.2.3: Final DMSO concentration in the site directed mutagenesis reactions . 35 Table 3.2.4: List of qPCR primers. ... 40
Table 3.2.5: List of telomere length measurement primers. ... 43
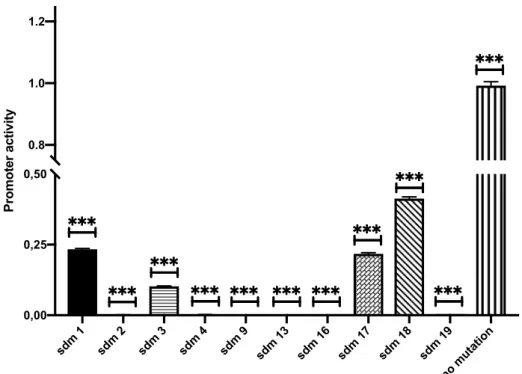
Table 4.1: Effect of SP1 binding site mutations on TERT promoter activity ... 52
Table 5.1: List of ALT associated genes that are significantly affected by DNA methylation inhibition ... 75
LIST OF FIGURES
Figure 1.1: Telomere induced DNA damage response pathways. A) Telomere
length mediated DNA damage response activates p16, ATM, and ATR mediated pathways. B) Capping protein-mediated DNA damage response activates ATM or ATR mediated pathways depending on the lost telomere capping molecule. . 3
Figure 1.2: Relationship between TERT promoter mutations and proliferative advantage in initiating cells. A) Proliferative outcomes in
tumor-initiating cells from stem cell compartments with long telomeres. B) Proliferative outcomes in tumor-initiating cells from differentiated cell compartments with short telomeres. Adapted from Chiba et al. 2015 ... 7
Figure 1.3: Currently proposed ALT mechanisms. A) Break Induced Repair based
ALT model. B) Sister Chromatid Exchange based ALT model.C) Homologous Recombination and Rolling Circle based ALT model. Adapted from Amorim et al. 2016. ... 10
Figure 4.1: Relative telomere length in aging zebrafish heart and brain. Y-axis
shows the age in months and X-axis shows the relative telomere length. Graphs are drawn using GraphPad Prism. Error bars represent the +SEM. *: p = 0.03, #: p = 0.0113, ##: p = 0.0241. ... 47
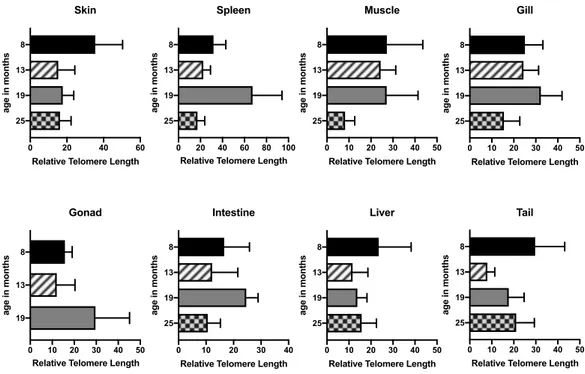
Figure 4.2: Relative telomere length in aging zebrafish organs. Y-axis shows the
age in months and X-axis shows the relative telomere length. Graphs are drawn using GraphPad Prism. Error bars represent the +SEM. ... 47
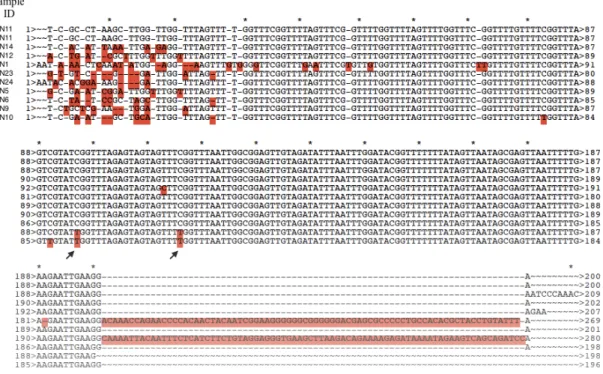
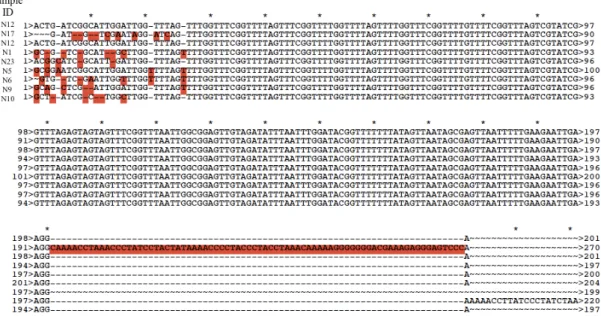
Figure 4.3: Sequence alignment of distal TERT promoter site in brain samples.
Aligned sequences are from N11, N14, N12, N1, N23, N24, N5, N6, N9, and N10 respectively. Disrupted Sp1 binding sites are shown with an arrow. Alignments
are made to sample N11 with Ape-A plasmid editor v2.0.Mismatches are highlighted with red and gaps are shown with hyphen. ... 48
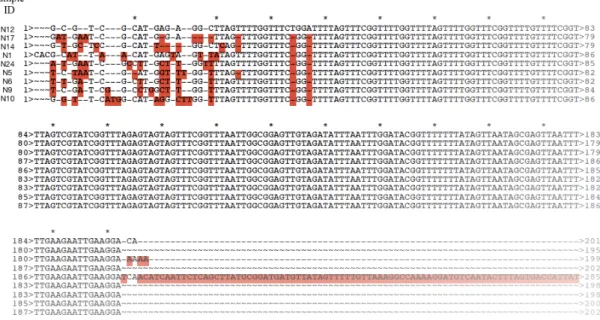
Figure 4.4: Sequence alignments of distal TERT promoter site in skin samples.
Aligned sequences are from N12, N17, N14, N1, N24, N5, N6, N9 and N10 respectively. Alignments are made with Ape-A plasmid editor v2.0. Mismatches are highlighted with red and gaps are shown with hyphen. ... 49
Figure 4.5: Sequence alignments of distal TERT promoter site in spleeen samples.
Aligned sequences are from N12, N17, N14, N1, N23, N6, N9 and N10 respectively Alignments are made with Ape-A plasmid editor v2.0. Mismatches are highlighted with red and gaps are shown with hyphen. ... 49
Figure 4.6: Sequence alignments of distal TERT promoter site in muscle samples.
Aligned sequences are from N17, N12, N1, N23, N5, N6, N9 and N10 respectively. Alignments are made to sample N12 with Ape-A plasmid editor v2.0. Mismatches are highlighted with red and gaps are shown with hyphen. .. 50
Figure 4.7: Relative telomere length in individuals and methylation status between 627,112 and 627,137 of chromosome 19. Table shows fish ID,
methylation status and alignment to reference sequence. Graph is drawn using GraphPad Prism. Error bars represent the +SEM. ... 50
Figure 4.8: Relative telomere length and methylation status in -972th position of TERT promoter in young and old zebrafish brains. Y axis shows the relative
telomere length and X axis shows the age groups. Individual data points are color coded according to their methylation status, where methylation is shown with black and hypo-methylation is shown with white. Graph is drawn with GraphPad Prism. Error bars represent the +SEM. ... 51
Figure 4.9: Normalized promoter activity in A172 and Daoy cell lines. Y axis
shows the relative promoter activity and X axis lists the mutant and wild type TERT distal promoter. A) A172. B) Daoy. No mutation value is set to 1. Graphs are drawn using GraphPad Prism. Error bars represent the +SEM. ***: p<0.001 ... 53
Figure 4.10: Normalized promoter activity in SW1088 cell line. Y axis shows the
relative promoter activity and X axis lists the mutant and wild type TERT distal promoter. No mutation value is set to 1. Graphs are drawn using GraphPad Prism. Error bars represent the +SEM. ***: p<0.001 ... 54
Figure 4.11: Population doubling time in brain cancer cell lines. Y axis shows the
population doubling time in hours and X axis lists the treatment type. Population doubling time in A) A172, B) Daoy, C) SW1088. Final concentration of 25 nM siRNA is used for transfection. Scrambled is non-targeting siRNA. Graphs are drawn using GraphPad Prism. Error bars represent the +SEM. ... 54
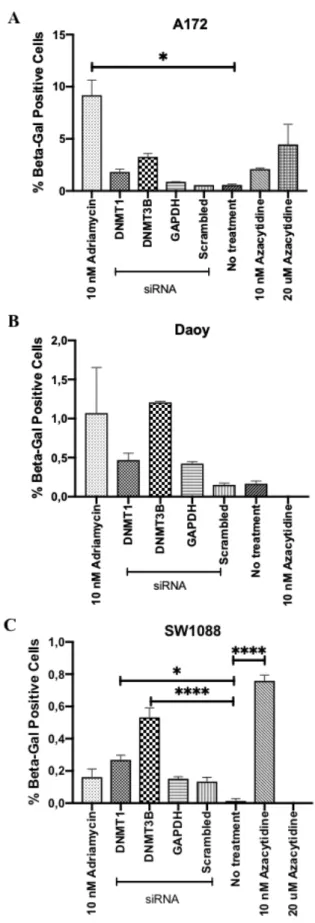
Figure 4.12: Beta-Galactosidase staining in brain cancer cell lines. Y axis shows
the percentage of Beta-Galactosidase positive cells and X axis shows the treatment. Final concentration of 25 nM siRNA is used for transfection. A) A172, B) Daoy, C) SW1088. Scrambled is non-targeting siRNA. Graphs are drawn using GraphPad Prism. Error bars represent the +SEM. *: p<0.05, ***: p<0.001, ****: p<0.0001. ... 56
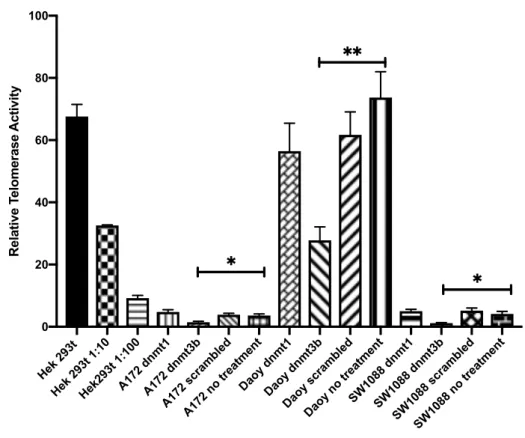
Figure 4.13: Effect of RNAi treatment on telomerase activity. Y axis show the
relative telomerase activity and X axis shows the cell type and treatment. Hek293t is used for positive control. Serial dilution of Hek293t is required for standard curve generation, where linear equation is used for relative telomerase activity
measurement. Scrambled is non-targeting siRNA. Graph is drawn using GraphPad Prism. Error bars represent the +SEM. *: p<0.05, **: p<0.01. ... 57
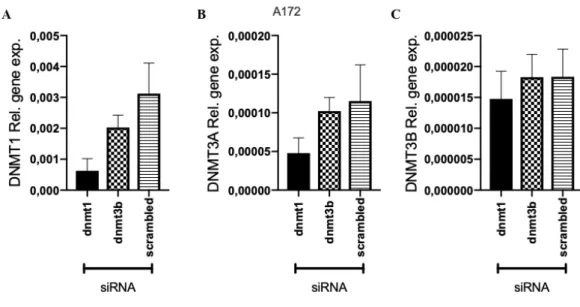
Figure 4.14: Expression of DNA Methyltransferase in A172 cell line 48 hour post treatment. Y axis shows the normalized relative gene expression and X axis
shows the treatment type. Final concentration of 25 nM siRNA is used for transfection. A) DNMT1 expression levels, B) DNMT3A expression levels, C) DNMT3B expression levels. Scrambled is non-targeting siRNA. Graphs are drawn using GraphPad Prism. Error bars represent the +SEM. ... 59
Figure 4.15: Expression of DNA Methyltransferase in Daoy cell line 48 hour post treatment. Y axis shows the normalized relative gene expression and X axis
shows the treatment type. Final concentration of 25 nM siRNA is used for transfection. A) DNMT1 expression levels, B) DNMT3A expression levels, C) DNMT3B expression levels. Scrambled is non-targeting siRNA. Graphs are drawn using GraphPad Prism. Error bars represent the +SEM. *: p<0.05 ... 59
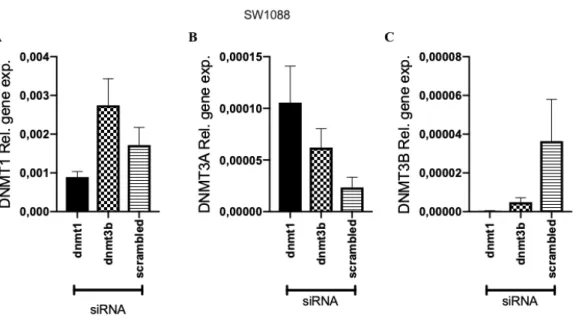
Figure 4.16: Expression of DNA Methyltransferase in SW1088 cell line 48 hour post treatment. Y axis shows the normalized relative gene expression and X axis
shows the treatment type. Final concentration of 25 nM siRNA is used for transfection. A) DNMT1 expression levels, B) DNMT3A expression levels, C) DNMT3B expression levels. Scrambled is non-targeting siRNA.Graphs are drawn using GraphPad Prism. Error bars represent the +SEM. ... 60
Figure 4.17: Expression of DNA Methyltransferase in VA-13 cell line 48 hour post treatment. Y axis shows the normalized relative gene expression and X axis
shows the treatment type. Final concentration of 25 nM siRNA is used for transfection. A) DNMT1 expression levels, B) DNMT3A expression levels, C)
DNMT3B expression levels. Scrambled is non-targeting siRNA.Graphs are drawn using GraphPad Prism. Error bars represent the +SEM. ... 60
Figure 4.18: Expression of hTERT in brain cancer and control cell lines. Y axis
shows the normalized relative gene expression and X axis shows the treatment type. Final concentration oft he treatments are 25 nM for siRNAs and 20 uM for Azacytidine. A) All cell lines without treatment, B) Treated A172 cells, C) Treated Daoy cells, D) Treated SW1088 cells. Scrambled is set to 1. Graphs are drawn using GraphPad Prism. Error bars represent the +SEM. ... 61
Figure 4.19: Expression of hTR in brain cancer and control cell lines. Y axis shows
the normalized relative gene expression and X axis shows the treatment type. Final concentration oft he treatments are 25 nM for siRNAs and 20 uM for Azacytidine. A) A172, B) Daoy, C) SW1088, D) VA-13. Scrambled is set to 1. Graph is drawn using GraphPad Prism. Error bars represent the +SEM. *: p<0.05, **: p<0.01, ***: p<0.001 ... 62
Figure 4.20: Expression of ATRX in brain cancer and control cell lines: Y axis
shows the normalized relative gene expression and X axis shows the treatment type. Final concentration oft he treatments are 25 nM for siRNAs and 20 uM for Azacytidine. A) A172, B) Daoy, C) SW1088, D) VA-13. Scrambled is set to 1. Graph is drawn using GraphPad Prism. Error bars represent the +SEM. *: p<0.05, **: p<0.01 ... 63
Figure 4.21: Expression of DAXX in brain cancer and control cell lines: Y axis
shows the normalized relative gene expression and X axis shows the treatment type. Final concentration oft he treatments are 25 nM for siRNAs and 20 uM for Azacytidine. A) A172, B) Daoy, C) SW1088, D) VA-13. Scrambled is set to 1.
Graph is drawn using GraphPad Prism. Error bars represent the +SEM. ***: p<0.001 ... 64
Figure 4.22: Expression of TRF2 in brain cancer and control cell lines: Y axis
shows the normalized relative gene expression and X axis shows the treatment type. Final concentration oft he treatments are 25 nM for siRNAs and 20 uM for Azacytidine. A) A172, B) Daoy, C) SW1088, D) VA-13. Scrambled is set to 1. Graph is drawn using GraphPad Prism. Error bars represent the +SEM. *: p<0.05, **: p<0.01, ***: p <0.001, ****: p< 0.0001 ... 65
Figure 4.23: Expression of FEN1 in brain cancer and control cell lines: Y axis
shows the normalized relative gene expression and X axis shows the treatment type. Final concentration oft he treatments are 25 nM for siRNAs and 20 uM for Azacytidine. A) A172, B) Daoy, C) SW1088, D) VA-13. Scrambled is set to 1. Graph is drawn using GraphPad Prism. Error bars represent the +SEM. *: p<0.05, **: p<0.01, ***: p <0.001, ****: p< 0.0001 ... 66
Figure 4.24: Expression of WRN in brain cancer and control cell lines: Y axis
shows the normalized relative gene expression and X axis shows the treatment type. Final concentration oft he treatments are 25 nM for siRNAs and 20 uM for Azacytidine. A) A172, B) Daoy, C) SW1088, D) VA-13. Scrambled is set to 1. Graph is drawn using GraphPad Prism. Error bars represent the +SEM. *: p<0.05, **: p<0.01 ... 67
Figure 4.25: Expression of CBX3 in brain cancer and control cell lines: Y axis
shows the normalized relative gene expression and X axis shows the treatment type. Final concentration oft he treatments are 25 nM for siRNAs and 20 uM for Azacytidine. A) A172, B) Daoy, C) SW1088, D) VA-13. Scrambled is set to 1.
Graph is drawn using GraphPad Prism. Error bars represent the +SEM. *: p<0.05, **: p<0.01 ... 68
Figure 4.26: Relative Telomere length. Y axis shows the relative telomere length
and X shows the treatment. Y axis shows the relative telomere length and X axis show the treatment type. Figure A) Relative telomere length in 25 nM siRNA treated A172 cells. Figure B) Relative telomere length in 25 nM siRNA treated Daoy cells. Figure C) Relative telomere length in 25 nM siRNA treated SW1088 cells. Graphs are drawn using GraphPad Prism. Error bars represent the +SEM. ... 69
Figure A.1: Plasmid Construct with TERT promoter area. ... 89 Figure A.2: Sequence of SDM 1. Promoter sequence is aligned to reference sequence
(NC_000005.10, GRCh38.p7 1294771-1299989). Alignments are made with with Ape-A plasmid editor v2.0. Mismatches are highlighted with an #. ... 90
Figure A.3: Sequence of SDM 2. Promoter sequence is aligned to plasmid with no
mutation. Alignments are made with with Ape-A plasmid editor v2.0. Mismatches are highlighted with an #. ... 90
Figure A.4: Sequence of SDM 3. Promoter sequence is aligned to reference sequence
(NC_000005.10, GRCh38.p7 1294771-1299989). Alignments are made with with Ape-A plasmid editor v2.0. Mismatches are highlighted with an #. ... 91
Figure A.5: Sequence of SDM 4. Promoter sequence is aligned to plasmid with no
mutation. Alignments are made with with Ape-A plasmid editor v2.0. Mismatches are highlighted with an #. ... 91
Figure A.6: Sequence of SDM 9. Promoter sequence is aligned to plasmid with no
mutation. Alignments are made with with Ape-A plasmid editor v2.0. Mismatches are highlighted with an #. ... 92
Figure A.7: Sequence of SDM 13. Promoter sequence is aligned to reference
sequence (NC_000005.10, GRCh38.p7 1294771-1299989). Alignments are made with with Ape-A plasmid editor v2.0. Mismatches are highlighted with an #... 92
Figure A.8: Sequence of SDM 16. Promoter sequence is aligned to reference
sequence (NC_000005.10, GRCh38.p7 1294771-1299989). Alignments are made with with Ape-A plasmid editor v2.0. Mismatches are highlighted with an #... 93
Figure A.9: Sequence of SDM 17. Promoter sequence is aligned to reference
sequence (NC_000005.10, GRCh38.p7 1294771-1299989). Alignments are made with with Ape-A plasmid editor v2.0. Mismatches are highlighted with an #... 94
Figure A.10: Sequence of SDM 18. Promoter sequence is aligned to reference
sequence (NC_000005.10, GRCh38.p7 1294771-1299989). Alignments are made with with Ape-A plasmid editor v2.0. Mismatches are highlighted with an #... 95
Figure A.11: Sequence of SDM 19. Promoter sequence is aligned to reference
sequence (NC_000005.10, GRCh38.p7 1294771-1299989). Alignments are made with with Ape-A plasmid editor v2.0. Mismatches are highlighted with an #... 96
Figure A.12: Beta-Galactosidase Staining of A172 cell line. A)10 nM Adriamycin
siRNA, B) 25 nM DNMT1 siRNA, C) 25 nM DNMT3B siRNA, D) 25 nM GAPDH siRNA, E) 25 nM Scrambled siRNA, F) No treatment, G) 10 nM Azacytidine, H) 20 uM Azacytidine. Images are taken with Olympus DP71 CKX41, 96 hours post treatment. 10x lens is used for imaging. ... 97
Figure A.13: Beta-Galactosidase Staining of A172 cell line. A)10 nM Adriamycin
siRNA, B) 25 nM DNMT1 siRNA, C) 25 nM DNMT3B siRNA, D) 25 nM GAPDH siRNA, E) 25 nM Scrambled siRNA, F) No treatment, G) 10 nM Azacytidine. Images are taken with Olympus DP71 CKX41, 96 hours post treatment. 10x lens is used for imaging. ... 98
Figure A.14: Beta-Galactosidase Staining of SW1088 cell line. A)10 nM
Adriamycin siRNA, B) 25 nM DNMT1 siRNA, C) 25 nM DNMT3B siRNA, D) 25 nM GAPDH siRNA, E) 25 nM Scrambled siRNA, F) No treatment, G) 10 nM Azacytidine, H) 20 uM Azacytidine. Images are taken with Olympus DP71 CKX41, 96 hours post treatment. 10x lens is used for imaging. ... 99
CHAPTER 1
INTRODUCTION
1.1. Telomeres: Structure and Function
Linear eukaryotic chromosome ends are specialized nucleoprotein complexes, known as telomeres. In mammals, telomeric DNA consist of double-stranded tandem repeats of 5’-TTAGGG-3’ followed by 3-guanine-rich single-stranded overhangs. Telomeric repeats interact with the Shelterin complex, and this interaction protects chromosome ends from being recognized as DNA damage [1]. Shelterin is a multimeric protein complex and consists of TRF1, TRF2, TIN2, RAP1, POT1, and TPP1 in humans [2]. Association of telomeric repeats with Shelterin complex, result in the formation of a lariat like structure, known as the t-loop.
Several cascades of molecular events lead to t-loop formation. Double-stranded telomeric repeats fold back on itself, and the terminal single-Double-stranded overhang invades into duplex TTAGGG repeats. This invasion displaces double-stranded TTAGGG repeats and forms the displacement loop (d-loop). Displaced telomeric repeats at d-loop are only bound by POT1 and TPP1. Double-stranded TTTAGG repeats are directly bound by TRF1, TRF2, and POT1 [2]. Rest of the Shelterin complex members do not have the capacity to interact with the telomeric repeat sequences. RAP1 interacts with TRF2 to localize on telomeres [3] [4]. TPP1 interacts with POT1 and shown to be enhancing POT1 affinity to TTAGGG repeats [5]. TIN2 is accepted as a central component of the Shelterin complex since it directly interacts with TRF1, TRF2, and TPP1 [6]. Overall, this molecular arrangement maintains and protects telomeres.
The primary function of telomeres is to protect chromosome ends from being recognized as DNA damage. This way, telomeres contribute to genomic stability by
preventing chromosome fusions [1]. They also function in nuclear architecture and chromosome positioning by helping the organization of chromosomes [7].
Telomere shortening is known to be accompanying healthy aging and telomeres are accepted as mitotic clocks. In humans, telomeres are 8 to 12 kbp in length at birth, and total loss of 2 to 4 kbp in average telomere length is observed in chromosomes [8]. Pathological telomere dysfunctions, such as short telomeres due to telomerase deficiency in early development and telomere uncapping, are shown to be accelerating aging in mammals. Experimental mouse models with shortened and lengthened telomeres show decreased and increased life span, respectively [9] [10]. Meta-analysis studies in humans also indicate a strong relationship between premature mortality and short telomeres [11].
Telomeres shorten due to the working mechanism of DNA polymerase and thus the end replication problem in cells, in the absence of the telomerase enzyme. Apart from the end replication problem, exonucleolytic activities and oxidative damage are also shown to be contributing to telomere shortening [12] [13]. After a critical point is reached, shortening of telomeres triggers either apoptosis or growth arrest, known as the replicative senescence. Replicative senescence is believed to be the initial barrier against tumor formation and accepted as a hallmark of aging [14].
1.2. Replicative Senescence
Senescent cells can be characterized by the absence of proliferation markers, enlarged cell size, increase in senescence-associated β-galactosidase activity, and increased p16INK4a expression [15]. The onset of replicative senescence is usually
determined by the length of the shortest telomere, but the loss of TRF2 or POT1 (telomere uncapping) can also lead to cell cycle arrest [16].
Figure 1.1: Telomere induced DNA damage response pathways. A) Telomere length mediated DNA
damage response activates p16, ATM, and ATR mediated pathways. B) Capping protein-mediated DNA damage response activates ATM or ATR mediated pathways depending on the lost telomere capping molecule.
Telomere induced DNA damage response (DDR) is achieved by several different signaling events (Figure 1.1). Shortening of telomeres shown to be inducing p16Ink4a-Rb, ATM, and ATR mediated pathways. In the p16Ink4a-Rb pathway, p16 inhibits CDK4 and CDK6, which represses Rb. Release of the inhibition of Rb results in replicative senescence [17]. In ATM and ATR signaling, stimulation of CHK1 and CHK2 activates p53. p53 can induce apoptosis or activate p21 to induce senescence. Telomere uncapping induced DNA damage response is mediated by ATM or ATR, depending on the lost capping protein. TRF2 loss and double stand breaks result in ATM-mediated DNA damage response. POT1 loss and single-strand breaks induce ATR mediated DNA damage response [17]. In both pathways, cells either enter replicative senescence, through p21 activity or enter apoptosis, through p53 activity.
By preventing further cellular divisions, replicative senescence protects the genetic information from being lost and contributes to genomic stability. However, growth arrest can be by-passed by the loss of tumor suppressors and other oncogenic changes. When the growth arrest is by-passed, telomeres continue to shorten and eventually, chromosome bridge-fusion-breakage cycles occur. These cycles result in genomic instability and increased risk of cancer [7]. Extensive cell death occurs; however, certain rare cells escape the crisis, start maintaining their telomeres and become malignant. This can be achieved by either re-activating or up-regulating the telomerase reverse transcriptase (TERT) gene, coding for the catalytic subunit of the telomerase holoenzyme, or lengthening their telomeres by the alternative lengthening of telomeres, using DNA recombination pathways [18] [19].
1.3. Telomerase
Telomerase is the enzyme that can elongate telomeres by adding TTAGGG repeats onto chromosome 3’-ends de novo. It is a ribonucleoprotein complex, and in humans, it consists of TERT, telomerase RNA component (TERC or TR) and human telomerase-associated protein 1 (TEP1) or dyskerin (DKC1). For telomerase to function, several proteins are required. Regulator of Telomere Elongation Helicase 1 (RTEL1), Telomerase Cajal body protein 1 (TCAB1) and CST complex (Cdc13/Ctc1, Stn1, and Ten1) are some of the identified contributors to telomerase activity in yeast. For telomere replication, T-loop needs to dissociate. RTEL1 helicase is the enzyme responsible for t-loop dissociation. DNA replication yields in a blunt-ended telomere end at the leading-strand synthesis and an RNA primer-ended telomere end in lagging strand synthesis. RNA primer-ended telomere ends are processed by the CST complex and Apollo before telomerase activity. TCAB1 in the Cajal bodies promotes assembly of telomerase and telomerase localizes onto the replicated and processed telomere.
Localization is achieved by interaction with TCAB1 and TPP1 and telomeres add 50 to 100 base pairs of new telomere repeats to the G-overhang. When the telomerase activity is done, CST complex and DNA polymerase-α perform a fill-in reaction and nucleolytic processing. This way, extended telomeres are closed to further telomerase action [20].
Telomerase activity is dependent on TERT expression. TERC and DKC1 are constitutively expressed, but TERT expression is highly regulated [1]. TERT is active during early development in humans, but gets transcriptionally silenced between the 12th and the 18th weeks of gestation [21]. However, in adults, TERT is actively being expressed in stem cell compartments and embryonic stem cells. In somatic cells, TERT expression or telomerase activity are usually undetectable or at low levels [22]. In contrast, in 85-90 % of cancer cells, TERT is up-regulated, which leads to the re-activation of telomerase [23].
1.4. TERT Re-activation and Telomerase Regulation in Cancer
Majority of cancer cells maintain their telomeres through re-activation of the TERT gene, and several cellular events can contribute to this re-activation. Epigenetic modifications are one such example. They play a major role in TERT re-activation, and the most common ones are DNA methylation in CpG islands, histone methylation, and histone acetylation. Methylation is generally associated with gene silencing, and it functions by inhibiting protein binding to the target DNA sequence. However, in the TERT promoter site, the opposite is observed. In healthy adult somatic tissues, CpG islands of the TERT promoter is hypo or non-methylated. On the contrary, cancer cells with TERT expression, have methylated CpG islands at TERT promoter site. CCCTC binding factor (CTCF) inhibitory proteins are one of the reasons behind hypo-methylation of CpG at the TERT promoter sites [24].
The methylation code, produced by DNA methyltransferases, DNA demethylases, and several other interacting proteins, differ in between cell types. In colon cancer cell line HCT116, and lung cancer cell line H209, proximal promoter site up to -150 bp shows no DNA methylation and shows hypermethylation between -150 and -650 bp. In embryonic stem cells, hypomethylation is observed between -650 and -400 bp, and no methylation is observed from -400 bp to transcription start site [25]. Current studies suggest that methylation code at the TERT promoter site can have different outcomes at different severities depending on the cell type.
Promoter mutations can also lead to TERT expression and the telomerase re-activation. Human tumors show variation in terms of frequency of TERT promoter mutations. In colon, pancreatic, breast, prostate, and thyroid cancers, TERT promoter mutations are not observed frequently. On the other hand, in cancers such as primary glioblastoma, oligodendrogliomas, medulloblastoma, and liver cancer TERT promoters are frequent. Other brain cancers such as astrocytoma and neuroblastoma also show mutations at the TERT promoter site but less frequently, where the frequency is around 10% [26]. Mutations at the TERT promoter site can re-activate the expression through several transcription factors. The core promoter, which is upto -2000 bp from the transcription site, has binding sites for transcription factors like Myc/Max and Sp1 [27]. Mutations at SP1 binding site were shown to be affecting transcription factor binding and thus the promoter activity. In the same study, it was also shown that SP1 over-expression increased the telomerase activity in a cell type-dependent manner [27]. Analysis of conserved binding sites at the promoter area up to -4000 bp from the ATG start codon of TERT showed that first 1000 bp is critical and sufficient for regulation of TERT expression [28]. Number of studies report cell
type-dependent response to mutations at the TERT promoter site, and a recent model was proposed to explain this difference in cellular response (Figure 1.2).
Figure 1.2: Relationship between TERT promoter mutations and proliferative advantage in tumor-initiating cells. A) Proliferative outcomes in tumor-initiating cells from stem cell compartments
with long telomeres. B) Proliferative outcomes in tumor-initiating cells from differentiated cell compartments with short telomeres. Adapted from Chiba et al. 2015
In this model, the response firstly relies on the telomerase positivity and telomere length of the tumor-initiating stem cell. If the cell is telomerase positive and has long telomeres in the first place, mutations affecting proliferation would cause a strong advantage towards tumor formation. On the other hand, mutations at the TERT promoter site would be neutral in terms of tumor formation. In other words, mutations
of TERT promoter at such cells, will not be a tumor-initiating event since it does not cause a proliferative advantage. If the tumor-initiating cell is from a telomerase negative differentiated cell compartment with short telomeres and has mutations that are increasing cell proliferation, even though the cell has a strong tumor initiating advantage due to cellular senescence or apoptosis, it will not be able to form a tumor. However, if the same cell type has a mutation at the TERT promoter area that is activating telomerase, it will have a strong advantage towards tumor formation since it can avoid cellular senescence [29].
1.5. ALT Mechanisms in Cancer
Apart from the telomerase-dependent lengthening of telomeres, cells can avoid entering into cellular senescence by the alternative lengthening of telomeres (ALT). This phenomenon was first observed in telomerase knock-out model of yeast. Even though the model was telomerase-deficient, it was able to maintain telomere length and continue proliferation. When a double knock-out for RAD52 was performed, these cells failed to survive and proliferate [30]. Since RAD52 is an important protein for double-strand break repair by homologous recombination, these observations were the first to suggest that telomeres could be maintained through DNA recombination-dependent pathways. Other studies, using exogenous DNA integration into telomeres, have shown the presence of ALT and shed light on how it employs homologous recombination [31].
Several models have been proposed to explain the working mechanism of ALT (Figure 1.3). The first model is based on break-induced repair, and the DNA is synthesized away from the break site using an HR donor template, which is the telomeric DNA in this case. This model is divided into three sub-models. In the first two sub-models, there is a loss of genetic material in the recipient telomeres, but the
timing of the lagging strand is different. In the third sub-model, unidirectional replication fork requires a Holliday junction at the end of the process. In this model, both the donor and the recipient telomeres are semi-conserved [32] [33]. The second model suggested for ALT is unequal telomeric sister chromatid exchange (T-SCE) due to the observation of increased sister chromatid exchange in ALT positive cells [34]. The last model is based on the presence of extrachromosomal telomeric repeats (ECTRs) in ALT positive cells. In this model, extrachromosomal telomeric repeats are suggested to be templates in telomere elongation through homologous recombination (HR) driven telomere elongation or rolling circle replication [31].
Current studies suggest that 10-15% of cancer cells utilize ALT to maintain telomeres [17]. ALT-positive cells are characterized by the presence of heterogeneity in telomere lengths, high level of telomeric sister chromatid exchange, extrachromosomal telomeric repeats, and the ALT-associated promyelocytic leukemia bodies (APBs), special telomeric nuclear bodies [35] [36]. Although the mechanism and the cause of ALT are still not well characterized, several different proteins and complexes are shown to be contributing to the ALT activation during cell immortalization and cancer progression. Alpha Thalassemia/Mental Retardation Syndrome X-linked (ATRX), Death Domain Associated Protein (DAXX) and transcription activating histone variant H3.3 are amongst the most studied proteins in ALT. ATRX and DAXX form a chromatin remodeling complex that functions in the deposition of H3.3 histone variant into telomeric and pericentromeric chromatin [31]. Identification of ATRX and DAXX inactivating mutations in ALT positive cells suggested that ATRX and DAXX loss is promoting ALT activation. ATRX loss increases susceptibility to DNA damage at heterochromatic regions and replicative
stress [37]. Several studies showed that ATRX re-expression suppresses the ALT mechanism [38] [39].
Figure 1.3: Currently proposed ALT mechanisms. A) Break Induced Repair based ALT model. B)
Sister Chromatid Exchange based ALT model.C) Homologous Recombination and Rolling Circle based ALT model. Adapted from Amorim et al. 2016.
Other proteins associated with ALT phenotype include but not limited to RAD50 Double-Strand Break Repair Protein (RAD50), RAD51 Recombinase (RAD51), Structural Maintenance of Chromosome 5 and 6 (SMC5/6) complex, WRN RecQ Like helicase (WRN), Telomeric Repeat Binding factor 2 (TRF2), MUS81 Structure-Specific Endonuclease Subunit (MUS81), X-Ray Repair Cross Complementing 6 (Ku70), X-Ray Repair Cross Complementing 5 (Ku80), Flap Structure-Specific Endonuclease (FEN1), Chromobox 3 (CBX3), BLM RecQ Like helicase (BLM), Anti-Silencing Function 1 Histone Chaperone (ASF1), SWI/SNF Related Matrix Associated Actin Dependent Regulator of Chromatin Subfamily A Like 1 (SMARCAL1), and Replication Protein A (RPA) [31]. Early studies in yeast
show that ALT mechanism is achieved by homologous recombination through RAD50 and RAD51 [40]. In human WI38-VA13/2RA cell line, depletion of RAD51 results in telomere shortening. Moreover, an increase in apoptosis is observed in these RAD51 depleted cells [41]. SMC5/6 Complex depletion in U-2 OS cell line results in shortening of telomeres, disruption of ALT-associated promyelocytic leukemia bodies formation, and impaired extrachromosomal telomeric repeats formation [42]. WRN helicase deficiency in U-2 OS and VA13 cell lines, result in inhibition of ALT-associated promyelocytic leukemia bodies formation and shortening of telomeres [43]. Depletion of TRF2 and disruption of Shelterin complex in SUSM1 and U-2 OS cell lines decrease telomeric signals and shortens telomeres [44]. Depletion of MUS81 in GM847, U-2 OS, and SAOS-2 cell lines shown to be inhibiting T-SCEs and results in growth arrest. On the other hand, MUS81 depletion does not affect telomere length in these cell lines [45]. Ku70/80 is shown to be promoting proliferation in ALT positive cell line CCL75.1 and depletion results in reduced number of extrachromosomal telomeric repeats. However, telomere length remains unchanged when Ku70/80 is depleted [46]. FEN1 depletion is associated with telomere dysfunction and in U-2 OS cell line inhibition of FEN1 results in increased telomeric DNA response [47]. RNA sequencing experiments revealed an association of CBX3 with ALT pathways [37]. Another study revealed that CBX3 is contributing to the maintenance of sister telomere cohesion and telomere length through interaction with TINF2 [48]. Over-expression of BLM Helicase in WI-38 VA-13/2RA and GM-847 cell lines increases telomeric DNA synthesis [49]. Depletion of ASF1 in IMR90, WI38, and HeLa is shown to be inducing ALT hallmarks. Extrachromosomal telomeric repeats and ALT-associated promyelocytic leukemia bodies forms in the absence of this protein [50]. SMARCAL1 inhibition in HeLa 1.3 and U-2 OS cells results in accumulation of extrachromosomal
telomeric repeats and telomere-associated DNA damage response [51]. RPA depletion in GM-847 and U-2 OS cell lines accumulates G-rich telomeric single-stranded DNA and results in proliferation arrest [52].
1.6 DNA Methyltransferases, Cancer, and Stemness
DNA methylation is a key epigenetic modification involved in gene expression regulation and genomic integrity maintenance. It is a heritable and reversible modification that is regulated by DNA Methyltransferases (DNMTs). These proteins transfer methyl groups from S-adenosyl-L-methionine (SAM) to the C-5 position of the cytosines [53]. DNMT1 is accepted as maintenance DNMT since it preferentially methylates hemimethylated DNA. DNMT2 is actually an RNA methyltransferase. It methylates the cytosine-38 in the anticodon loop of aspartic acid tRNA [54]. DNMT3A and DNMT3B, known as the de novo methyltransferases, both have a preference to methylate unmethylated CpG dinucleotides [55]. DNMT3L, last member of DNMTs, lacks enzymatic activity and functions in the binding of de novo methyltransferases to SAM [55].
Typically, tumor cells exhibit aberrant DNA methylation patterns during malignant transformation [56]. Recent findings suggest that the relationship between telomeres, methylome, aging, and cancer is more intricately linked than originally supposed. DNMT1 depletion in healthy cells increases microsatellite instability and chromosomal translocation frequency [57]. DNMT1, DNMT3A, and DNMT3B are shown to be over-expressed in colon, prostate, breast, and liver cancers. Silencing of DNA methyltransferases in an antisense approach inhibits tumorigenesis [58]. Studies on stem cell differentiation revealed a direct link between telomere integrity, de novo DNA methylation, and stem cell pluripotency. Embryonic stem cells (ESCs) and induced pluripotent stem cells (iPSCs) with short telomeres exhibit reduced expression
of DNMT3A and DNMT3B [59] [60]. A recent study showed that ESCs with short telomeres cannot differentiate stably, and thus their proliferation capacity is limited. In these cells, Nanog regulation is impaired, and both DNA and Histone 3 Lysine tri-methylation are altered. Enforced DNMT3B expression or telomere elongation, rescue differentiation capacity, and impaired DNA methylation [61].
CHAPTER 2
OBJECTIVES AND RATIONALE:
In this thesis, we aimed to shed light on telomere maintenance during aging of the zebrafish brain, in the brain cancers and the effect of DNA methylation for both conditions we aimed to provide data for future translational studies. We had four objectives and our first objective was to study telomere shortening in a zebrafish model of aging. For this purpose, we have measured the telomere length in the different organs of the aging wild-type zebrafish and investigated the methylation levels of TERT promoter in these samples. Although zebrafish adult tissues produce telomerase at low levels, we expected to observe a decreasing trend through the aging process with different speeds in an organ-specific manner. Observation of long telomeres in some of the old zebrafish tissues lead us to study methylation levels in the TERT promoter since TERT promoter is rich in CpG islands and telomerase activity is generally dependent on TERT transcription.
Our second and third objectives were concerning the telomere maintenance in human brain cancer cell lines and DNA methylation machinery. Our second objective was to focus on the telomerase-dependent telomere maintenance in these cell lines. For this purpose, we have investigated the effect of point mutations affecting Sp1 binding sites at the TERT promoter, the effect of DNA methylation inhibition in the gene expression of telomerase-associated genes, and the telomerase activity. The third objective was focused on the alternative lengthening of telomeres in these cell lines. We investigated the expression of ALT-associated genes for this purpose when the DNA methylation was blocked. For both of these objectives, telomere lengths were also measured in the presence and absence of DNA methylation.
Our last objective was to investigate the relationship between the DNA methylation machinery and the onset of replicative senescence. Our rationale was based on that DNMTs are accepted as stemness markers and over-expressed in most tumor cells. Population doubling assays and Beta-Galactosidase staining experiments were performed for this objective.
CHAPTER 3
MATERIALS AND METHODS
3.1 Materials
3.1.1. Cell Culture Reagents
Table 3.1.1: List of cell culture reagents DMEM F-12 w/o L-Glutamine w/o
Hepes L0090, BioWest, Nuaillé, France
PBS L0615-500, BioWest, Nuaillé, France
Trypsin L0930-100, BioWest, Nuaillé, France
L-glutamine 25030-024, Gibco, Paisley, UK
Non Essential Aminoacids X0557, BioWest, Nuaillé, France
Penicillin-Streptomycin 15140122, Gibco, Paisley, UK
Fetal Bovine Serum S181H-500, BioWest, Nuaillé, France
DMSO 1.16743.1000, Merck, Billerica, USA
Vidaza/Azacytidine 8699538774815, Erkim ilaç, Istanbul,
Turkey
Adriamycin/Doxorubicin 8699511796056, Saba ilaç, Istanbul, Turkey
Cell Culture grade water L0970-500, BioWest, Nuaillé, France
3.1.2. General Enzymes
Table 3.1.2: List of general enzymes Phusion High Fidelity Master Mix with
High GC content F-532, Thermo Scientific, Vilnius, Lithuania
Taq DNA polymerase A140303, Ampliqon, Odense, Denmark
Table 3.1.2: Continued
Fast Start SYBR Green Master 04 673 492 001, Roche, Mannheim, Germany
SensiFAST ™ SYBR® No-ROX Kit BIO-98020, Bioline, Luckenwalde,
Germany
3.1.3. General Kits, Reagents and Chemicals
Table 3.1.3: List of general kits, reagents and chemicals
QIAamp DNA Mini Kit 51304, Qiagen, Hilden, Germany
DNeasy Blood&Tissue Kit 69506, Qiagen, Hilden, Germany Epitect Fast DNA Bisulfite Kit 59824, Qiagen, Hilden, Germany EZ Methylation Lightning Kit D5030, Zymo Research, Irvine, USA PureLink Quick PCR Purification Kit K310001, Thermo Fisher Scientific,
Vilnius, Lithuania
DNA Clean & Concentrator ™-25 D4034, Zymo Research, Irvine, USA
Zyppy Miniprep Kit D4019, Zymo Research, Irvine, USA
ZymoPURE Plasmid Maxiprep Kit D4202, Zymo Research, Irvine, USA
RNeasy Mini Kit 74104, Qiagen, Hilden, Germany
RNase free DNase set 79254, Qiagen, Hilden, Germany
Transcriptor High Fidelity cDNA Synthesis Kit
05081963001, Roche Diagnostics, Mannheim, Germany
Senescence β-gal staining kit 9860, Cell Signalling Technologies, Frankfurt am Main, Germany
Luciferase Assay E1500, Promega, Madison, USA
Transfex ACS-4005, ATCC, Virginia, USA
Nuclease Free Water AM9937, Ambion, Austin, USA
Table 3.1.3: Continued
Boric Acid 1.00165.1000, Merck, Darmstadt,
Germany
EDTA E5134-500G, Merck, St. Louis, USA
Agarose Tablets BIO-41027, Bioline, Luckenwalde,
Germany
Ethidium Bromide A1152,0025, AppliChem, Darmstadt,
Germany
DNA ladder BIO-33053, Bioline, Luckenwalde,
Germany
Loading dye B7024S, New England Biolabs,
Ipswich, USA
3.1.4. Cloning Enzymes and Buffers
Table 3.1.4: List of cloning reagents
pGL3-Basic Luciferase Reporter Vector E1751, Promega, Madison, USA
T4 DNA ligase M0202S, New England Biolabs,
Ipswich, USA
Ligation Buffer B0202S, New England Biolabs,
Ipswich, USA
KpnI-HF R3142S, New England Biolabs,
Ipswich, USA
SacI-HF R3156S, New England Biolabs,
Ipswich, USA
DpnI-HF R0176S, New England Biolabs,
Ipswich, USA
CutSmart Buffer B7204S, New England Biolabs,
3.1.5. Microbiology Reagents and Solution Recipes
Table 3.1.5: List of microbiology reagents and solution recipes
Agar 1802.00, Conda, Madrid, Spain
NaCl 1.06404.1000, Merck, Darmstadt,
Germany
Tryptone LP0042, OXOID, Hampshire, England
Yeast Extract 1.03753.05000, Merck, Darmstadt,
Germany
Ampicillin 8699828270126, Koçak Farma,
Istanbul, Turkey
LB Agar 20 g Agar, 20 g NaCl, 10 g Tryptone, 5
g Yeast Extract per liter. Autoclave. 1000x Ampicillin is added around 56 ºC, in the final concentration of 1x
LB Broth 10 g NaCl, 10 g Tryptone, 5 g Yeast
Extract per liter. Autoclave. 1000x Ampicillin is added after cooling, in the final concentration of 1x
3.1.6. siRNAs and Reagents
Table 3.1. 6: List of siRNA and Reagents
DNMT1 ON-TARGETplus siRNA L-004605-00-0005, Dharmacon,
Lafayette, USA
DNMT3B ON-TARGETplus siRNA L-006395-00-0005, Dharmacon,
Lafayette, USA
GAPDH ON-TARGETplus siRNA D-001830-10-05, Dharmacon,
Lafayette, USA Non-Targeting ON-TARGETplus
siRNA
D-001810-10-05, Dharmacon, Lafayette, USA
RNAse free 5x siRNAbuffer B-0020000-UB-100, Dharmacon,
Table 3.1. 6: Continued
DharmaFECT Reagent 1 T-2001-03, Dharmacon, Lafayette, USA
3.1.7 qTRAP Buffers and Reagents
Table 3.1.7: List of qTRAP Buffers and Reagents
Hepes-KOH sc- 286007A, ChemCruz, Dallas, USA
MgCl2 MA00350500, Scharlau, Barcelona,
Spain
KCl P9541-500G, Sigma, St. Louis, USA
EGTA E3889-100G, Sigma, St. Louis, USA
PMSF 830000-5G-F, Sigma, St. Louis, USA
Chaps C3023-1G, Sigma Aldrich, St. Louis,
USA
Beta-Mercaptoethanol 8.05740.0250, Merck, Darmstadt,
Germany
Glycerol K49564692 742, Merck, Darmstadt,
Germany
Tween 8.22184.0500, Merck, Lyon, France
BSA P6155-100GR, BioWest, Nuaillé,
France
CHAPS Lysis Buffer 1 mM MgCl2, 1 mM EGTA, 0.1 mM
PMSF, 0.5% Chaps, 10% glycerol, 5 mM Beta-Mercaptoethanol, 10 mM Tris-HCl, complete to 10 ml with cell culture grade water. Store at +4°C
10 x QTRAP Buffer 200 mM Tris-HCl, 15 mM MgCl2, 630
mM KCl, 0.5% Tween, 10 mM EGTA, 1mg/ml BSA, complete to 10 ml with cell culture grade water. Store at -20°C
3.1.8 Equipments Used
Table 3.1.8: List of Equipments Used
Thermal Cycler T100, Biorad
Centrifuge 5810 R, Eppendorf
Centrifuge Microfuge 16, Beckman Coulter
qPCR Mic qPCR, Bio Molecular Systems
Incubator Galaxy 170 R, New Brunswick
Laminar Flow Class II Safety Cabinet, Metisafe
Microscope DP71 CKX41, Olympus
pH meter SevenEasy, Mettler Toledo
Spectrophotometer ND-1000, Nanodrop
Power Supply PS 1006 P, Apelex
Gel Tank MSCHOICE7, Cleaver Scientific
Imaging Cabinet Fluorchem FC3, Protein Simple
Luminometer Lucetta, LONZA
Orbital Shaker 613.11.001, Isolab
3.2 Methods
3.2.1. Zebrafish Maintenance:
Wild-type zebrafish (AB) is used for tissue collection. All fish were kept in Techniplast aquarium system, with a 14:10 hour light: dark cycle. All fish are fed
ad-libitum, twice with dry flakes and once with Artemia, on a daily basis.
3.2.2. Tissue Collection :
the gills stop moving and decapitated with a scalpel in ice-cold 1 x PBS. Organs were dissected, snap frozen in liquid nitrogen and stored in - 80°C until DNA isolation. Gender determination is performed by direct gonadal examination. Samples with no visible gonad remained as undetermined and labeled as no gonad (NG). Experiments are approved by Bilkent University Animal Ethics Committee with approval number of 2014/18.
Table 3.2.1: List of zebrafish used in tissue collection.
Fish ID Sex Length Weight Date of Birth Date of Death Age (Months) N1 F 4.3 0.79 06/05/2014 04/06/2015 13 N2 F 3.2 0.41 06/05/2014 04/06/2015 13 N3 NG 3.1 0.29 06/05/2014 04/06/2015 13 N4 F 3.4 0.36 24/10/2013 04/06/2015 19 N5 NG 4.5 0.94 24/10/2013 09/07/2015 25 N6 NG 4.0 0.54 24/10/2013 09/07/2015 25 N7 NG 3.5 0.54 24/10/2013 09/07/2015 25 N8 NG 4.0 0.51 24/10/2013 09/07/2015 25 N9 NG 4.0 0.57 24/10/2013 09/07/2015 25 N10 NG 4.2 0.87 24/10/2013 09/07/2015 25 N11 F 3.0 0.30 16/10/2014 09/07/2015 8 N12 F 3.2 0.31 16/10/2014 09/07/2015 8 N13 M 3.1 0.30 16/10/2014 09/07/2015 8 N14 F 3.1 0.32 16/10/2014 09/07/2015 8 N15 M 3.2 0.31 16/10/2014 09/07/2015 8 N16 M 3.2 0.27 16/10/2014 09/07/2015 8 N17 M 3.1 0.31 16/10/2014 09/02/2016 8
Table 3.2.1: Continued
Fish ID Sex Length Weight Date of Birth Date of Death Age (Months) N18 F 4.5 1.25 17/12/2014 09/02/2016 13 N19 F 4.0 1.17 17/12/2014 09/02/2016 13 N20 F 4.3 1.22 17/12/2014 11/02/2016 13 N21 F 4.5 1.06 17/12/2014 11/02/2016 13 N22 M 3.7 0.51 09/07/2014 16/02/2016 19 N23 F 4.3 0.90 09/07/2014 22/02/2016 19 N24 F 4.5 0.78 09/07/2014 22/02/2016 19 3.2.3. Cell Culture:
Cell lines are cultured according to suggestions from ATCC’s website and kept in 37°C with 5% CO2. A172, Daoy, SW1088, and WI-38 VA-13 subline 2RA are bought from ATCC and HEK293T cell line is provided by Aerts Kaya lab from Hacettepe University, PEDI-STEM. All cell lines are cultured in DMEM medium (BioWest) with 1% Penicillin-Streptomycin (Gibco), 1% L-glutamine (Gibco), 1% Non-Essential Amino Acids (BioWest) and 10% FBS (BioWest). Complete medium is renewed twice a week, and cells are passaged once in every week. A172, Daoy, and HEK293T are passaged in 1:10 ratio. SW1088 and WI-38 VA-13 subline 2RA are passaged in 1:5 ratio. Cells were routinely checked for mycoplasma contamination using BioWest’s MycoKit.
3.2.4. DNA Isolation:
For genomic DNA isolation from zebrafish tissues, Qiagen’s QIAamp DNA Mini kit is used according to the manufacturer’s instructions. 180 µl Buffer ATL is
mixture. Tissues are disrupted with a sterile syringe, the mixture is vortexed and incubated overnight at 56°C. Completely lysed samples are briefly centrifuged and 200 µl Buffer AL is added. Samples are then incubated at 70°C for 10 minutes, briefly centrifuged and 200 µl 96-100% ethanol is added. Samples are mixed by vortexing for 15 seconds and briefly centrifuged. Mixture, including the precipitate, is transferred to QIAamp mini spin columns and centrifuged at 6000 x g for 1 minute. QIAamp mini spin column is transferred into a clean 2 ml collection tube and 500 µl Buffer AW1 is added onto the column matrix. Samples are centrifuged at 6000 x g for 1 minute and the QIAamp mini spin column is transferred into a new collection tube. 500 µl AW2 is added and centrifuged at 20,000 x g for 3 minutes. QIAamp mini spin columns are transferred into a 1.5 ml collection tube, 200 µl Buffer AE is added, incubated at room temperature for 1 minute and centrifuged at 6000 x g for 1 minute. Previous step is repeated by transferring the elute to the spin column. Eluted DNA concentration and elution quality is checked with Nanodrop ND-1000. Isolated zebrafish DNA samples are used in telomere length measurements, bisulfite conversion, and sequencing experiments.
For genomic DNA isolation from brain cancer cell lines, Qiagen’s DNeasy Blood & Tissue kit is used according to manufacturer’s instructions. Cells are collected, and centrifuged at 1500 x rpm for 5 minutes. Culture medium is removed, and the cell pellets are resuspended in 200 µl 1 x PBS. Following 20 µl proteinase K addition, 200 µl buffer AL is added to each tube, and mixed thoroughly by vortexing for 15 seconds. Tubes are incubated for 10 minutes at 56°C, and 200 µl 96-100% EtOH is added after the tubes are cooled down. Tubes are mixed thoroughly by vortexing, and the mixture is pipetted into a DNeasy Mini Spin Column. Columns are centrifuged at ≥ 6000 x g for 1 minute, and the flow-through is discarded. Spin column is placed
into a new collection tube, and 500 µl buffer AW1 is added. Tubes are centrifuged at ≥ 6000 x g for 1 minute. After discarding the flow through, and collection tubes, and the spin column is placed into a new collection tube. 500 µl Buffer AW2 is added, and the tubes are centrifuged at maximum speed for 3 minutes. Column is transferred into a clean 1.5 ml eppendorf, and 50 µl Buffer AE is added directly onto the column matrix. After a 1-minute incubation at room temperature, samples are centrifuged at ≥ 6000 x g for 1 minute. For increased DNA yield, last step is repeated after reloading Buffer AE to the column matrix. Following DNA isolation, each samples concentration and quality is checked with Nanodrop ND-1000. Isolated DNA samples are used for TERT promoter amplification, and telomere length measurement experiments.
3.2.5. Bisulfite Conversion:
EpiTect Fast DNA Bisulfite kit (Qiagen), and EZ DNA methylation kit (Zymo Research) is used according to manufacturer’s instructions. For EpiTect Fast DNA Bisulfite, these steps are followed. 25 µl (250 ng) DNA, 15 µl RNase-free water, 85 µl Bisulfite solution, and 15 µl DNA protect buffer is mixed in 0.2 ml PCR tube. Mixture is incubated at 95°C for 5 minutes, 60°C for 20 minutes, 95°C for 5 minutes, and 60°C for 20minutes in a thermal cycle. Upon completion of bisulfite conversion, PCR tubes are briefly centrifuged, and transferred into a clean 1.5 ml eppendorf tubes. 310 µl freshly prepared Buffer BL with 1% carrier RNA is added to each sample, vortexed, and briefly centrifuged. 250 µl 96-100% ethanol is added on top, vortexed for 15 seconds, and briefly centrifuged. Mixture is transferred into MinElute DNA spin columns, and centrifuged for 1 minute at 10,000 x g. Flow-through is discarded, and 500 µl Buffer BW is added to each spin column. Samples are centrifuged for 1 minute at 10,000 x g, flow through is discarded, and 500 µl Buffer BD is added to each spin
column. Columns are incubated at room temperature for 15 minutes, and centrifuged for 1 minute at 10,000 x g. Flow-through is discarded, 500 µl Buffer BW is added, and samples are centrifuged at 10,000 x g for 1 minute. Last step is repeated once, and 250 µl 96-100% ethanol is added to each spin column. Samples are centrifuged for 1 minute at 10,000 x g, columns are transferred into new 2 ml collection tubes, and centrifuged for 1 minute at 10,000 x g. Columns are transferred into 1.5 ml eppendorf tubes, 15 µl Buffer EB is directly added onto the center of the spin column, and incubated 1 minute at room temperature. Following incubation, samples are eluted by centrifuging at 10,000 x g for 1 minute. Purified samples are stored at -20°C for long term storage.
For EZ DNA Methylation Lightning kit following procedure is performed. 130 µl Lightning Conversion Reagent is added to 20 µl DNA sample in 0.2 ml PCR tube, mixed, and briefly centrifuged. Mixture is incubated at 98°C for 8 minutes, and 54°C for 1 hour. 600 µl M Binding Buffer is loaded into Zymo spin IC column- collection tube assembly. Sample is loaded into the spin column with the M Binding Buffer, and mixed by inverting the tubes several times. Columns are centrifuged at full speed for 30 seconds, and the flow through is discarded. 100 µl M Wash Buffer is added into the column, centrifuged at full speed for 30 seconds, and the flow-through is discarded. 200 µl L-desulphonation Buffer is added, and the columns are incubated for 20 minutes in room temperature. Following incubation, samples are centrifuged at full speed for 30 seconds. Columns are washed twice by adding 200 µl M Wash Buffer to the column, and centrifuging at full speed for 30 seconds. Columns are then placed into 1.5 ml eppendorf tubes, and 10 µl M Elution Buffer is directly added to the column matrix. Samples are centrifuged at full speed, and eluted samples are stored at -20°C for short term, and -80°C for long term storage.
Bisulfite treated DNA is quantified with Nanodrop ND-1000 with RNA quantification settings, where 40 ug/ml for Ab260 is equal to 1.
3.2.6. PCR for TERT Promoter Sites:
PCRs are performed for amplifying core, and distal TERT promoter area from different cell lines while adding restriction enzyme recognition site at each end of the product. Primer pair for core promoter is TERT 4F: 5’- GGT ACC TCG CCG CAC GCA CCT GTT -3’, and TERT 2R: 5’-GAG CTC CAC GAA CGT GGC CAG CGC-3’. For distal promoter area TERT 5F: 5’-GGT ACC ACC AGT GGC CGT GTG GCT T-3’ with TERT 2R. Thermo Scientific’s Phusion High Fidelity Master Mix with High GC content is used for reactions. 50 ng of genomic DNA is used as a template. Each reaction contains 10 µl 2x Phusion Master Mix, 0.5 µl of each primer, and 0.4 µl DMSO for distal promoter amplification or 0.8 µl DMSO for core promoter amplification. Volume is completed to 20 µl with PCR grade water. Annealing temperature is decreased to 68.5°C from 69.4 for distal promoter, and decreased to 71.1°C from 72.9°C for core promoter by adding DMSO. Cycling conditions are 98°C for 90 seconds (initial denaturation), 98°C for 10 seconds, 68.5-71.1°C for 20 seconds, 72°C for 30 seconds (total of 30 cycles), and 72°C for 5 minutes (final extension). Expected PCR product is 1144 bp for the distal, and 574 for the core promoter site.
To increase restriction enzyme digestion efficiency, six random nucleotides are added before the restriction enzyme recognition site by PCR. Both for core, and distal promoter new TERT reverse: 5’- ATG TAG GAG CTC CAC GAA CGT GGC -3’ is used. For core promoter area new TERT 4F: 5’- GTA ATA GGT ACC TCG CCG CAC GCA -3’ is used, and for the distal promoter area new TERT 5F: 5’- GTA TGA GGT ACC ACC AGT GGC CGT G -3’ is used as forward primer. 15 ng PCR product is used as template DNA in a 50 µl reaction. 4%, and 2% DMSO is used for core, and