Full Terms & Conditions of access and use can be found at
http://www.tandfonline.com/action/journalInformation?journalCode=rcjd20
Download by: [Bilkent University] Date: 18 October 2017, At: 05:31
canadienne d'études du développement
ISSN: 0225-5189 (Print) 2158-9100 (Online) Journal homepage: http://www.tandfonline.com/loi/rcjd20
Investigation on Sources of Growth for Turkey
Bahar Bayraktar
To cite this article: Bahar Bayraktar (2006) Investigation on Sources of Growth for Turkey, Canadian Journal of Development Studies / Revue canadienne d'études du développement, 27:1, 25-38
To link to this article: http://dx.doi.org/10.1080/02255189.2006.9669118
Published online: 15 Feb 2011.
Submit your article to this journal
Article views: 30
Investigation on Sources of Growth for lbrkey
Bahar Bayrakta?
ABSTRACT-
This paper evaluates the correlations between growth and selected macroeconomic indicators in Turkey under the dynamic macroeconomic adjustments as a globalizing developing economy during 1968-1 998. In this context, a sensitivity analysis for basic growth variables, includingfiscal, trade, and monetary indicators, is carried out by using a variant of the extreme bounds analysis (EBA). By controlfing the various fiscal, trade, and monetary variables, I reveal that, with the exception of human capital, none of the variables, which are always included in the growth regressions, are robust. Thus, the paper confirms the crucial role of human capital in the growth literature.RESUME
-
L'auteure halue les corrklations entre la croissance et des indicateurs macrokonomiques choisis duns le cadre des mesures d'ajwtement macrokconomique knergiques qui ont kte' adoptkes en Turquie durant laphiode de mondialisation de l'kconomie, de 1968 d 1998. Duns ce contexte, elle fait une analyse de sensibilite'pour vkrifier les variables fondamentales de la croissance, y compris des indicateurs budgktaires, commerciaux et monktaires, b l'aide d'une variante de l'analyse des limites extrhes. Apres avoir contrdlk les diverses variables budgktaires, commerciales et mont?taires qui sont toujours corriprises duns les analyses de rkgression de la croissanc~ l'auteure ionstate qu'd l'ex- ception du capital hurnain, aucune de ces variables n'est robuste. L'article confirme ainsi le r6le essentiel du capital hurnain duns les krits sur la croissance.Much of the research on economics focuses on the determinants of growth, including the interaction of population, human capital, technological spillovers, and capital accumulation, and the role of institutions (Barro 1991; Mankiw, D. Romer, and Weil 1990; f! Romer 1989). In this context, there exists a vast empirical literature on economic growth supported by different econometric techniques, country groups, and data sets (Levine and Renelt 1992; Sala-i-Martin 1997; Durlauf and Quah 1998). However, the great diversity of the studies produces not only inconsistent results but sometimes even conflicting ones. Those conflicting claims on growth empirics, which are partly explained by the analytical problems that plague growth regressions, challenge the reliability of the findings. In addi- tion, another problem emerges as theories do not explicitly define the variables to be placed into the growth models. Hence, selecting variables that are meaningfully correlated with growth becomes an important issue. Levine and Renelt (1992) provide an initial answer to this problem. Their formula- tion is using extreme bounds analysis (EBA) to identify "robust" empirical relations in the economic
* I wish to thank Prof. Erin$ Yeldan and Assistant Professor Erdem B q $ i for valuable comments and discussion. CANADIAN JOURNAL OF DEVELOPMENT STUDIES, VOLUME XXVII, NO 1,2006
growth literature. On the other hand, Sala-i-Martin (1997) assigns a certain level of confidence to each of the variables included in the growth regressions by looking at the entire distribution of the estimators to reach more robust findings.
Yet, most of the studies on growth consider only a small number of explanatory variables to establish a significant relationship between growth and a particular variable of interest. For example, researchers who examine the linkage between growth and openness ignore the potential importance of fiscal variables. In this respect, given the wide array of growth determinants and various econo- metric specifications, finding a reliable and independent statistical relationship between the various macroeconomic indicators and growth becomes difficult, especially for developing countries, due to their fragile socioeconomic environment. Thus, confidence in the empirical link between growth and a variety of economic policy indicators might be examined by exposing the set of control vari- ables to small alterations.
Noting the need for selecting the relevant variables in the growth analysis, it is the purpose of this paper to evaluate the analytical findings on the correlations between growth and selected macro- economic indicators under the dynamic macroeconomic adjustments of a globalizing developing economy. Hence, the paper focuses on the case of Turkey during 1968-1999, which is known to span the overall transformation of the Turkish economy from a domestic demand-oriented, import- substitutionist industrialization to one with export orientation and integration with the world finan- cial markets. After following a rather long period of an inward-looking, import-substitutionist pattern of growth, Turkey suffered a foreign exchange crisis in 1977-1980. In 1980, a structural adjustment program was introduced under the guidance of the World Bank and the IMF. The period of 1981-1987 was marked by commodity trade liberalization and export promotion. In 1989, the capital account was liberalized and Turkey entered a process of short-term foreign capital-led growth associated with mini booms and crises throughout the 1990s, where many of the instruments of monetary and fiscal control were transformed, and the constraints of macro-equilibrium underwent a major structural change (Metin-Ozcan, Voyvoda, and Yeldan 2001).
Within this framework, the paper examines the sensitivity of the relationship between the vari- ous macroeconomic indicators and growth in Turkey by using a variant of EBA as discussed in Leamer (1983, 1985) and Leamer and Leonard (1983). Determining the sensitivity of the macro- economic indicators is a crucial step in growth-enhancing policies, especially for developing coun- tries. In this context, examining the reliability of the basic growth and macroeconomic variables in Turkey for the period under consideration improves the confidence in the growth determinants that are examined by past studies. The next section provides a brief overview of the Turkish economy and the third introduces the model and presents the basic growth indicators and control variables used in this study. The fourth section focuses on the quantitative results, and the last summarizes and concludes.
Turkish economic development has followed an unstable and rough pattern. Overall, it is seen that the Turkish economy has experienced three important turning points with different characteristics under the post-1968 path: import-substitutionist industrialization (1968-1979), trade liberalization and export promotion (1980-19881, and financial liberalization (1989-1998).
In 1960-1979, there were two major and interrelated developments in the Turkish economy: the impact of the five-year development plans on industrialization and capital accumulation, and the adoption of an import-substitutionist industrialization strategy. Although the Turkish economy
INVESTIGATION ON SOURCES OF GROWTH FOR TURKEY 27
entered the 1970s with rapid growth, the import-substitutionist development strategy was observed to reach its limits in the second part of the decade when financing of the balance of payments and industrial investments became interestingly difficult (Metin-Ozcan, Voyvoda, and Yeldan 2001). As a result, the Turkish economy ended up with the foreign exchange crisis of 1977-1980.
A stabilization and adjustment program was introduced on 24 January 1980 under the World Bank and the International Monetary Fund (IMF). It aimed to curb inflation and alleviate balance- of-payments difficulties by eliminating the excess demand in domestic markets in the short run and restore equilibrium and economic growth in the long run.' The export-led growth strategy of the early 1980s was successful in its export targets but it failed to achieve comparable success in capital accumulation and income distribution. At the end of the 1980s, commodity trade liberalization had reached its limits; in particular, the real appreciation of domestic currency challenged the policies of the export-led growth strategy.
Following the liberalization of the capital account in 1989, there has been a massive inflow of short-term capital into the domestic economy; that is to say, flows of hot money (Boratav, Turel, and Yeldan 1996). In this setting, the ready availability of foreign exchange enabled the Turkish lira to appreciate against the major currencies in real terms and led to a rapid expansion of import demand.2 Although the process of financial deepening had nearly matured by 1990, there was no significant improvement in the growth path of the Turkish economy.
Due to the unsustainable nature of the fiscal policy and external deficit, the economy experi- enced a major crisis in early 1994, which was followed by real contraction. In July 1998, another disinflation program was introduced under the guidance of the IMF. Although the program achieved some improvements with regard to the inflation rate and fiscal imbalances, there were still pressures on the interest rate. The Russian crisis in August 1998, the general elections in April 1999, and two devastating earthquakes in August and October 1999 deteriorated the economic climate and the fiscal balances of the public sector.
Overall, the Turkish economy did not follow a high and stable growth pattern after the 1980s. The dynamics of the growth performance of the Turkish economy after 1989 can be linked to unsuccess- ful disinflation efforts and the government's debt financing policies, pronouncing themselves in the exchange rate policy (Ertugrul and Selcuk 2001). Another factor behind the unstable performance of growth rates in the post-1980 era is the investment climate, which is characterized by a lack of inno- vative entrepreneurship and modern management (see Senses 1990 and 1989). For instance, a large portion of investment is devoted to housing due to the expected high profits in that sector (Kepenek and Yentiirk 2000). Boratav, Turel, and Yeldan (1995) point to a boom in housing investments that attained a 36% growth rate in 1985-1988. Actually, the changing patterns of the sectoral distribution of investment may be summarized as follows. One is the investors' preference, which is associated with short-run financial investment in stocks, bonds, and other instruments. Therefore, long-term real investment in plants and equipment is neglected in favour of more quick and high returns (see Senses 1990 and 1989). The second is the failure to get inflation under control, which leads to big nominal changes in interest rates and the exchange rate, together with increased uncertainty for entrepreneurs, given the unstable political environment. As a result, investment rates are lower than the requirements of a dynamic growth process.
1. See Boratav and Turel(1993); Senses (1994); Celasun and Rodrik (1989); and Celasun (1994) for an o v e ~ e w of the post-1980 Turkish structural adjustment reforms.
2. See Balkan and Yeldan (1998); Selcuk (1997); Boratav, Turel, and Yeldan (1996); Ekinci (1998); and Yentiirk (1999) for an extensive discussion of the post-financial liberalization macroeconomic adjustments in Turkey.
On the other hand, an overwhelming deterioration in the fiscal balances of the state had adverse effects on the growth trajectory of the Turkish economy in the 1990s. Government revenues were not increased due to the inefficient and weak tax structure. In addition, high and persistent budget deficits, which is in part due to the accumulating debt stock and rising share of interest payments on domestic debt, disturbs the growth path of the economy.
In the 1990s, an increase in the growth rate of domestic credit stock was not able to provide a determined growth path for the economy since the rise in credits was not used efficiently in the production areas. The credits of the banking system were reallocated away from agriculture and industry and toward construction, housing, transport, and tourism (Boratav, Turel, and Yeldan 1996). It is argued that the main reason for using credits in non-production areas is the high inflation rate disturbing the profitability of production (Kepenek and Yentiirk 2000). Although the financial deep- ening due to the financial reforms is expected to contribute to the availability of loanable funds in the system, leading to an expansion of investments, the benefits of financial liberalization have not been realized.
High and variable inflation has been a central feature of the Turkish economy since the 1970s. One of the main reasons for the persistent inflation rates in the Turkish economy was identified as the deterioration in the fiscal balances of the public sector and the resulting borrowing requirement (Metin 1995). Although various stabilization programs were implemented over the years, inflation remains a major challenge for policy-makers.
Briefly, the Turkish economy suffered from low and volatile growth rates in 1968-1998 in partic- ular due to an unsustainable fiscal policy and high inflation rates. In addition, inefficient and unpro- ductive capital accumulation prevented sustainable growth and development. In this context, it is better to examine the sensitivity of the correlation between major macroeconomic indicators and growth in Turkey.
The study employs a variant of the EBA, which might simply be defined as a way of analysing the sensitivity of the variables. Since existing econometric models do not completely specify the vari- ables that should be examined on the growth regressions, the EBA tries to evaluate the strength of the growth models' findings. This methodology is similar to the one discussed in Leamer (1983,1985) and Learner and Leonard (1983).
The EBA aims to detect the sensitivity of the explanatory variables to small alterations. Hence, within a pool of N explanatory variables that have been previously identified as related to growth, the EBA aims to detect whether the variable Z, which is used as a symbol for the variable of interest, is "robust:' a term used to convey a true association with growth. In addition to the Z-type variables, the growth models might be said to include variables that, due to past empirical analysis, are known to be correlated with growth. For the sake of simplicity, such variables might be called I-type vari- ables. Another category of variables, named X-type variables, is chosen to form the basis of the conditioning information set. So, the general growth models classified for the purpose of the EBA might be given as follows:
where Y stands for either per capita GDP growth or the share of investment in GDP. Regarding the I- type variables, of the 41 growth studies survcyed in Levine and Renelt (1991), 33 include investment
INVESTIGATION ON SOURCES OF GROWTH FOR TURKEY 29
share, 29 include population growth, and 13 include human capital measure. Sala-i-Martin (1997) collected around 60 variables, which have been found to be significant in at least one regression. However, there are also problems with including the investment share of GDP as an I variable since the causal relationship between GYP (growth rate of real GDP per capita) and investment is ambigu- ous. This means that the variables included in growth regressions may explain investment. If invest- ment is included, the only channel through which other explanatory variables can explain growth differentials is the efficiency of resource allocation (Levine and Renelt 1992). Thus, as in Levine and Renelt (1992), to clarify this ambiguity, the correlation between investment and the macroeconomic variables of primary interest is also investigated.
The EBA works along the guidelines of first selecting Z-type variables and running a "base" regression that includes only the I-type variables and the variable of interest. Then, the regression results are computed for all possible linear combinations of up to three X variables and an estimate,
$,, and a standard deviation, o, are found. Thus, the upper extreme bound is defined as the highest value of$, plus two standard deviations, while the lower extreme bound as the lowest value of $,
minus two standard deviations. The EBA for variable Z works as if a regression is found for which the sign of the coefficient$, changes or becomes insignificant: then the variable is not robust. Hence, one might feel less confident in the relationship between the Z and Y variables since alterations in the conditioning information set change the statistical inferences drawn regarding the Z-Y relationship, which means the link between Z and Y is fragile.
In order to ensure robustness or fragility in a non-controversial manner as in Levine and Renelt (1992), the EBA is restricted in two ways: (1) choose up to three X variables from the pool of variables identified as potentially important explanatory variables of growth. Hence, the total number of explanatory variables included in any one regression is set as seven or fewer; (2) for every variable of interest, Z, the pool of variables is further restricted by excluding the X variables that might meas-
ure the same phenomenon. For example, the inflation rate is not allowed to be an X variable when the relationship between growth and the rate of domestic credit growth is examined.
In this study, when the dependent variable is the annual growth rate of GDP per capita, the selected I variables consist of the investment share of GDP (INV), high-school enrolment rate (HEC), and the annual rate of population growth (GPO). Next, Xvariables are the ratio of exports to GDP (E), the inflation rate3 (PI), the growth rate of domestic credit (GDC), the standard deviation of inflation (STDI), and the standard deviation of domestic credit growth (STDC). This pool is kept small to make the result more tangible. Hence, the sensitivity of the growth determinants is exam- ined in a wider range than that considered by any other study. Moreover, in this study, the economet- ric analysis is done by using the annual data from the State Planning Organization and Central Bank of the Republic of Turkey.
Using the econometric method outlined above, the analytical findings on the correlations between growth and selected macroeconomic indicators including fiscal, trade, and monetary variables for Turkey during 1968-1998 are presented in this section. First, the role of basic growth variables is examined before the analysis of a wide range of macroeconomic variables. The regression results of the I variables over the period of analysis might be followed as:
3. Inflation is calculated as the log difference of the consumer price index. Domestic credit refers to the credit by deposit banks.
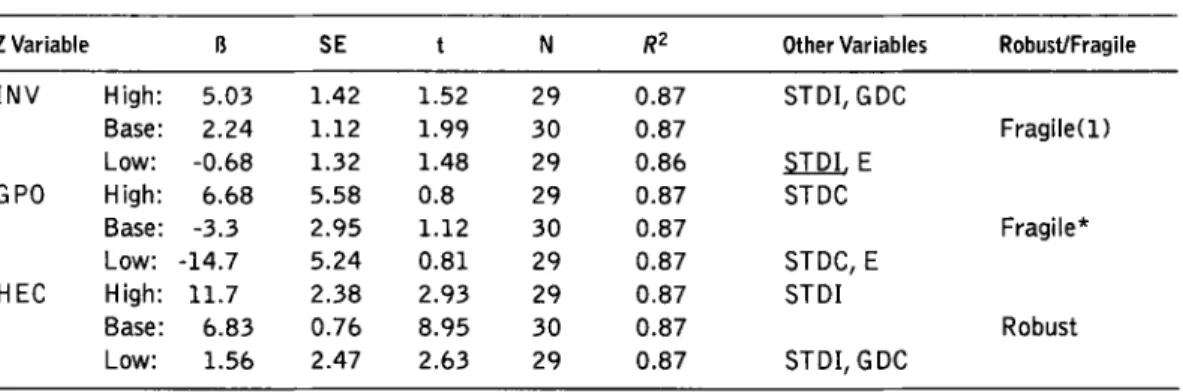
The I variables explain about 85% of the variance in growth rates. The variables have the signs predicted by a wide class of models and all but GPO are significant at 0.05 significance level (the figures in parentheses are t statistics). This base regression is run with four different investment shares in GDP (share of total investment, share of public investment, share of private investment, and share of housing investment) and two different human capital indicators (high-school and second- ary-school enrolment rates, HEC and SEC, respectively). Within this framework, among the various investment shares, the share of housing investment is the only one that has a positive and significant coefficient. Actually, this is not very surprising since the distribution of sectoral investments reveals a rising trend for the housing sector in the last two decades in Turkey In addition, both HEC and SEC have positive and significant coefficients.
When the EBA test is run for each of the I variables, it is noticed that the investment coefficient becomes fragile, meaning that the variable of interest enters with a wrong sign when the condition- ing set is altered. However, when the differences in ps rather than the differences in 8-bounds are examined, the coefficient of housing investment becomes robust.
Table 1. Sensitivity Results for Basicvariables
(Dependent Variable: Growth Rate of Real Per Capita GDP)
Z Variable B S E t N R2 Other Variables RobustIFragile
I N V High: Base: Low: GPO High: Base: Low: H EC High: Base: Low: STDI, GDC Fragile(1) STDI,E STDC Fragile* STDC, E STDI Robust STDI, GDC
The base I3 is the estimated coefficient from the regression with the variable of interest (Z variable) and the always included variables (Ivariables).The Ivariables are INV (Investment share of GDP), GPO (Growth in population), HEC (High school enrollment rate).The high R is the estimated coefficient from the regression with the extreme high bound (I3 + t w o standard deviations); the low R is the coefficient from the regression with the extreme lower bound.The other vari- ables are the Xvariables included in the base regression that produces the extreme bounds.The RobustIFragile column indi- cates whether the variable of interest is robust or fragile. I f fragile, the number in parentheses indicates how many additional variables need to be added before the variable is insignificant or of the wrong sign.The underlined variables are the minimum additional variables that make the coefficient of interest insignificant or change sign.
* Indicates that the variable of interest is insignificant at 0.05 significance level in the base regression.
Although empirical studies show a positive link between growth and human capital, the direc- tion of the link may change with respect to the proxies used. Related with this variable, HEC and SEC produce robust positive correlation with growth in Turkey, parallel with the existing literature. As to the effect of population growth on per capita growth, the coefficient on GPO is insignificantly corre- lated with growth in the base regression. While the negative relation between population growth and income is obvious from the data, a full understanding of this relationship is complicated. Thus, not only the effect of the population on income has to be considered, but also the determination of the population growth itself.
INVESTIGATION ON SOURCES OF GROWTH FOR TURKEY 31
Table 2 provides the EBA of the I variables using the investment share as the dependent variable. When the result is fragile, the column indicates the number of X variables, which needs to be added before the variable is insignificant or of the "wrong" sign. None of the I variables is robustly corre- lated with investment. The variable of interest, GPO, becomes insignificant or changes sign when the conditioning set is altered. Although the human capital indicator, HEC, is positive and significant in the base regression, it is not robust. In particular, PI and STDI make the coefficient of interest, HEC, insignificant or change sign.
Table 2. Sensitivity Results for Basic Variables (Dependent Variable: Investment Share)
Z Variable 0 S E t N R2 Other Variables RobustIFragile
- - -G P O High: 1.64 0.55 0.95 30 0.55 STDI, E Base: -1.65 0.8 2.04 3 1 0.27 Fragile(0) LOW: -4.84 1.06 2.53 30 0.32 STDC H E C High: 1.02 0.2 1.51 30 0.39 GDC, STDC, E Fragile(2) Base: 0.36 0.06 5.81 3 1 0.37
LOW: -1.16 0.27 2.2 3 0 0.57 PI. STDI, STDC
The base R is the estimated coefficient from the regression with the variable of interest ( Z variable). When the depend- ent variable is the investment share, no I variables are included.The high R is the estimated coefficient from the regres- sion with the extreme high bound ( R + t w o standard deviations); the low 8 is the coefficient from the regression with the extreme lower bound.The other variables are the X variables included in the base regression that produces the extreme bounds.The RobusWFragile column indicates whether the variable of interest is robust or fragile. I f fragile, the number in parentheses indicates how many additional variables need t o be added before the variable is insignificant or of the wrong sign.The underlined variables are the minimum additional variables that make the coefficient of interest insignif- icant or change sign.
Hence, it can be asserted that among the variables that are always included in the growth regres- sions for the Turkish case, only the human capital indicator is robust.
A. Fiscal Policy Indicators
The literature has not been successful in identifying a robust empirical relationship between growth and the aggregate indicators of fiscal policy such as government expenditures or taxes, due to conceptual complexities and statistical reasons. For example, in Barro (1990) and Easterly and Rebelo (1993), growth increases with taxation and low expenditure, and then decreases as the distortionary effects of taxation arise. Ram (1985) finds a positive correlation between the growth rate of govern- ment expenditures and output growth. Barro (1989,1990, 1991) and Diamond (1989) use detailed measures of government expenditures on capital goods, education, and defence and find that consumption spending, less defence, and education expenditures to GDP is negatively correlated with growth. Levine and Renelt (1992), however, show that this negative correlation becomes insignificant for some econometric specifications. Barro (1991) also finds that the coefficient on the ratio of government capital expenditure or education expenditures against growth depends on the specific econometric specification applied. Diamond (1989) tests for separate effects of a number of categories of public expenditures and finds that the different categories of government expenditure are quite fragile to the inclusion of other explanatory variables. Although the empirical work on fiscal policy and economic growth has not produced robust empirical relationships, Barro (1991), Fischer (1993), and Easterly and Rebelo (1993) report the central government surplus to be a robust variable in growth regressions.
Table 3. Sensitivity Results for Fiscal Variables (Dependent Variable: Growth Rate of Real Per Capita GDP)
ZVariable I3 S E t N R2 Other Variables RobustlFragile
SHDEF High: 0.84 0.59 0.56 29 0.66 STDI,
GDC.
EBase: -1.06 0.65 1.61 30 0.51 Fragile(1)
Low: -2.4 0.71 1.37 29 0.53 STDC
SHEXPNDHigh: 1.15 0.52 0.19 29 0.54 STDI, GDC, E
Base: -0.37 0.34 1.09 30 0.49 Fragile*
LOW: -1.64 0.58 0.82 29 0.54 STDI, STDC, E
The base O is the estimated coefficient f r o m the regression w i t h the variable of interest (Z variable) and the always included variables ( I variables).The I variables are INV, GPO, and HEC.The high R is the estimated coeffic~ent f r o m the regression with the extreme high bound ( 8 + t w o standard deviations); the low O is the coefficient from the regression w i t h the extreme lower bound. Z variable definitions: SHDEF = deficit share, SHEXPND = expenditure share.The other vari- ables are the X variables included in the base regression that produces the extreme bounds.The RobusffFragile column indi- cates whether the variable of interest is robust o r fragile. I f fragile, the number i n parentheses indicates how many additional variables need t o be added before the variable is insignificant or of the wrong sign.The underlined variables are the minimum additional variables that make the coefficient of interest insignificant or change sign.
* Indicates that the variable of interest is insignificant a t 0.05 significance level in the base regression.
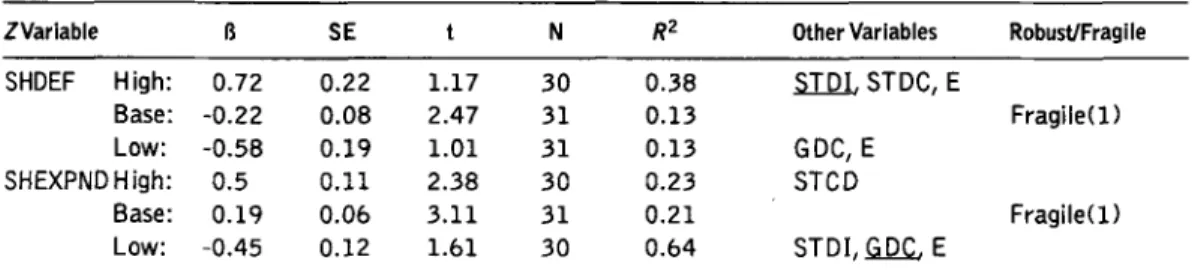
For the Turlush case regarding the sample period, results of the EBA test on fiscal variables and growth relation are reported in Table 3. Here, it is noticed that government deficit - entering with a negative coefficient
-
is not robust despite a 10% significance level. This is because the coefficient on government deficit becomes insignificant and positive when the conditioning information set is altered (e.g., by adding GDC). In spite of being fragile, rising budget deficits seriously threaten the growth path of the economy due to the unsustainable fiscal policy The ratio of total expenditures to GDP (SHEXPND) is insignificant in the base regression, and the inclusion of other macroeconomic indicators (e.g., STDC) also induces an insignificant coefficient on SHEXPND.On the other hand, Table 4 presents the EBA tests of the fiscal indicators with investment. Although the share of deficit is negatively and significantly correlated with the share of public invest- ment, the combination of different X variables causes SHDEF (share of deficit) to enter insignifi- cantly and change sign. Thus, there is a fragile link between public investment and SHDEF. In the base regression, there is a positive significant relation between SHEXPND and investment but the coefficient of the variable changes sign as the conditioning set is altered. Interestingly, the share of expenditure in GDP is not significantly correlated with growth. However, in spite of being fragile, the share of expenditure in GDP is significantly correlated with investment in the base regression. Thus, the relationship between SHEXPND and growth may be based on resource accumulation but not necessarily on the improved allocation of resources.
Table 4. Sensitivity Results for Fiscal Variables (Dependent Variable: Investment Share)
ZVariable SHDEF High: Base: Low: SHEXPND High: Base: Low:
R2 Other Variables RobustlFragile 0.38
STDI.
STDC, E 0.13 Fragile(1) 0.13 GDC, E 0.23 STCD 0.21 Fragile(1) 0.64 STDI,GDC.
E - ~- --The base R is the estimated coefficient f r o m the regression w i t h the variable of interest ( 2 variable). When the dependent variable is the investment share, no I variables are included.The high R is the estimated coefficient from the regression w i t h the extreme high bound (R + two standard deviations); the low R is the coefficient f r o m the regression w i t h the extreme lower bound. Z variable definitions: SHDEF = deficit share, SHEXPND =expenditure share.The other variables are the X
INVESTIGATION ON SOURCES OF GROWTH FOR TURKEY
variables included in the base regression that produce the extreme bounds.The robusflfragile column indicates whether the variable of interest is robust or fragile. I f fragile, the number in parentheses indicates how many additional variables need to be added before the variable is insignificant or of the wrong sign.The underlined variables are the minimum additional variables that make the coefficient of interest insignificant or change sign.
B. International Trade
Theoretical ties between trade and growth have been formalized by Rivera-Batiz and Romer (1991), Grossman and Helpman (1990), and Romer (1986,1990). Moreover, an endogenous growth theory has expanded on the notion of scale economies, suggesting that trade may increase the generation and diffusion of knowledge through mechanisms such as learning by doing, invention, and diffusion of knowledge. Although there is a fairly robust two-step empirical link between the share of exports in GDP and output growth, the widely cited Levine and Renelt (1992) analysis fails to find any of the large number of trade and trade policy indicators to be robustly correlated with growth, especially when the estimated equation includes investment share. These results are interpreted as indicating that the relationship between trade and growth may be based on an enhanced resource accumulation, and not necessarily on the improved allocation of resources (e.g., see Baldwin and Seghezza 1996).
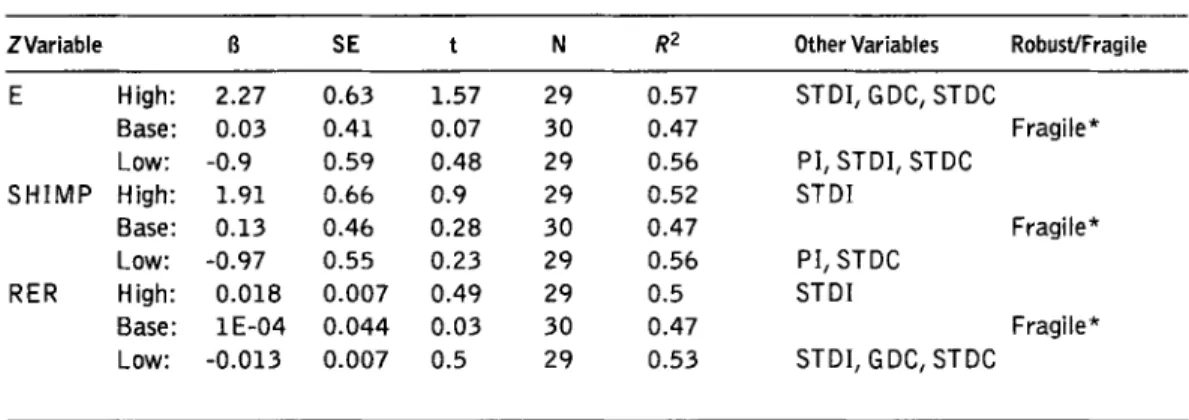
The major results for trade variables regarding the sample period for Turkey are presented in Tables 5 and 6. The ratio of exports to GDP (E) is not robustly correlated with growth, nor is it signif- icant in the base regression. To find a regression in which E enters positively and significantly, one needs to search beyond the five variables considered as potential Xvariables by the EBA. The ratio of imports to GDP is also examined and, as in the case of E, it is not robustly correlated with growth and has a positive and insignificant coefficient in the base regression. Moreover, the relationship between real exchange rate (RER) and growth is positive and insignificant, but fragile.
Table 5. Sensitivity Results for Trade Variables
(Dependent Variable: Growth Rate of Real Per Capita GDP)
ZVariable E High: Base: Low: S H I M P High: Base: Low: R E R High: Base: Low:
Other Variables RobustIFragile
STDI, GDC, STDC Fragile* PI, STDI, STDC STDI Fragile* PI, STDC STDI Fragile* STDI, GDC, STDC
The base B is the estimated coefficient from the regression with the variabie of interest ( Z variable) and the always included variables ( I variables).The I variables are INV, GPO, and H EC.The high R is the estimated coefficient from the regression with the extreme high bound (I3 +two standard deviations); the low I3 is the coefficient from the regression with the extreme lower bound. Z variable definitions: E = export share, SHIMP = import share, RER = real exchange rate.The other variables are the X variables included in the base regression that produces the extreme bounds.The RobusttFragile column indicates whether the variable of interest is robust or fragile. I f fragile, the number in parentheses indicates how many additional variables need to be added before the variable is insignificant or of the wrong sign.The underlined variables are the minimum additional variables that make the coefficient of interest insignificant or change sign.
Indicates that the variable of interest is insignificant at 0.05 significance level in the base regression.
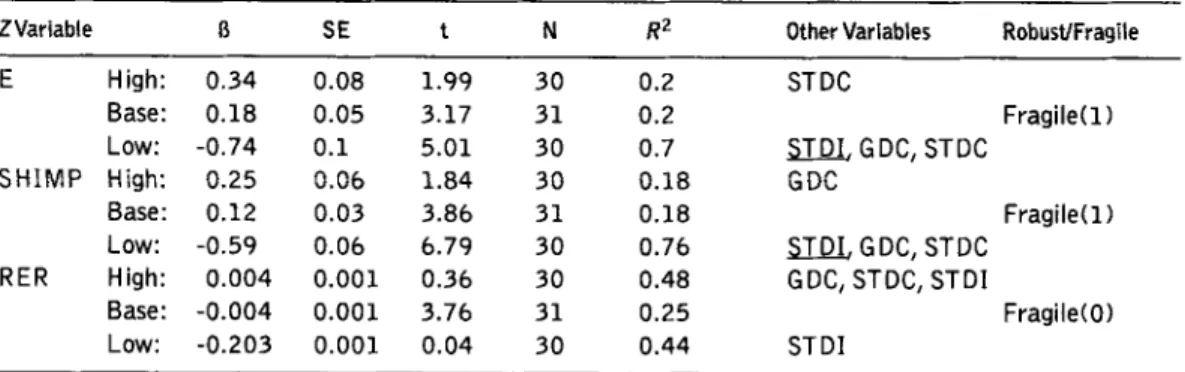
Table 6 shows the link between trade variables and investment. Although the shares of exports and imports are positive and significant in the base regression, they are not robustly related with the share of investment, and the coefficient on the share of exports (imports) becomes negative when the
conditioning information set is altered (e.g., by adding STDI). The coefficient of RER is negative and significant but it becomes insignificant and changes sign with different combinations of Xvariables. In short, both the shares of exports and imports are positively and significantly correlated with hous- ing investment. In addition, instead of being fragile, RER is negatively and significantly correlated with the share of housing investment in GDP
In this context, the unbalanced structure of trade policy in Turkey matched the fragile relation- ship between growth and trade variables. Although the link between trade variables and growth is fragile and insignificant, the correlation between the trade and investment is fragile and significant. These results indicate that the relationship between trade and growth may be based on an enhanced resource accumulation and not necessarily on the improved allocation of resources. Consequently, there exists a positive correlation between trade variables and housing investment. The results also indicate that the rising share of housing in GDP corresponded to the real exchange rate appreciation.
Table 6. Sensitivity Results for Trade Variables (Dependent Variable: Investment Share)
ZVariable I3 S E t N R2 Other Variables RobustlFragile
E High: 0.34 0.08 1.99 30 0.2 STDC Base: 0.18 0.05 3.17 3 1 0.2 Fragile(1) LOW: -0.74 0.1 5.01 30 0.7 STDI, GDC, STDC S H I M P H i g h : 0.25 0.06 1.84 30 0.18 G DC Base: 0.12 0.03 3.86 3 1 0.18 Fragile(1) LOW: -0.59 0.06 6.79 30 0.76
STDI.
GDC, STDC R E R High: 0.004 0.001 0.36 30 0.48 GDC, STDC, STDI Base: -0.004 0.001 3.76 3 1 0.25 Fragile(0) LOW: -0.203 0.001 0.04 30 0.44 ST DIThe base B is the estimated coefficient from the regression with the variable of interest ( Z variable). When the dependent
variable is the investment share, no I variables are included.The high B is the estimated coefficient from the regression with the extreme high bound (B + two standard deviations); the low B is the coefficient from the regression with the extreme lower bound. Z variable definitions: E =export share, SHIMP = import share, RER = real exchange rate.The other vari- ables are the X variables included in the base regression that produces the extreme bounds.The RobusWFragile column indi- cates whether the variable of interest is robust or fragile. I f fragile, the number in parentheses indicates how many additional variables need to be added before the variable is insignificant or of the wrong sign.The underlined variables are the minimum additional variables that make the coefficient of interest insignificant or change sign.
C . Monetary Indicators
Empirical evidence on the relationships among money, inflation, and growth is ambiguous. Kormendi and Meguire (1985) conclude that the growth rate of inflation is negatively correlated with growth. Bruno and Easterly (1993) demonstrate that growth falls sharply during periods of high inflation (which they define as 40% or above). But Grier and Tullock (1989) find that both the sign and significance of the inflation-growth correlation depends importantly on the sample chosen. Levine and Renelt (1992) argue that the relationship between growth and inflation and growth and domestic credit growth depend on the inclusion of other policy variables.
Although theory suggests that monetary policy variability should impede the efficient allocation of resources, the empirical relationship between monetary policy uncertainty and growth is ambigu- ous. For example, Hayek (1944), Friedman (1977), and Barro (1976) argue that variable inflation or monetary policy uncertainty can interfere with the ability of agents to extract information from rela- tive prices and may reduce investment and economic performance. Empirically, Kormendi and Meguire (1985) find a negative correlation between the standard deviation of M1 (measure of money supply, or a money aggregate) growth and output growth. Grier and Tullock (1989) again find that
INVESTIGATION ON SOURCES OF GROWTH FOR TURKEY 35
both the sign and significance of this correlation depend on the sample of countries chosen, and Levine and Renelt (1992) demonstrate that small changes in the explanatory variables can change the sign of the coefficient on the standard deviation of inflation or the standard deviation of domestic credit in growth regressions.
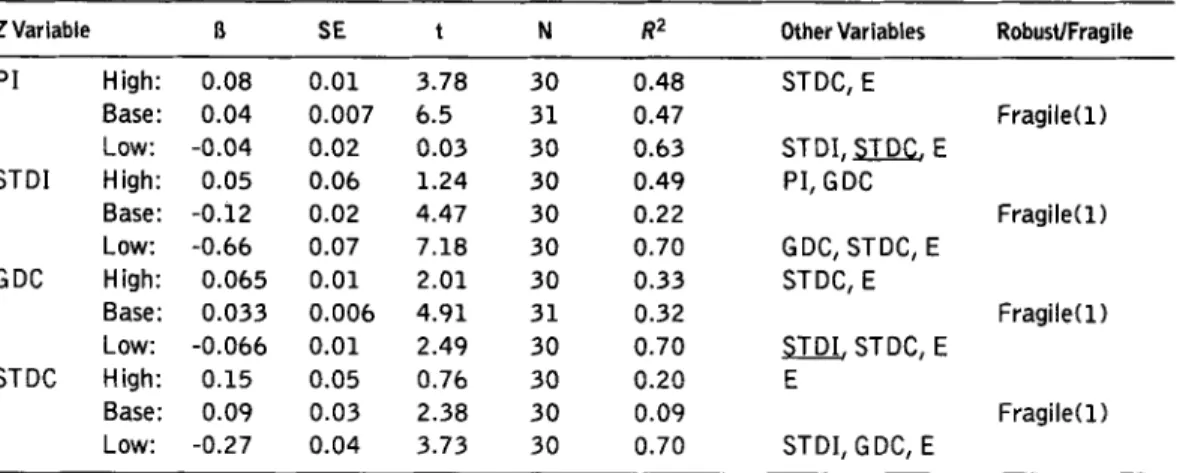
Table 7. Sensitivity Results for Monetary Variables
(Dependent Variable: Growth Rate of Real Per Capita GDP)
ZVariable 0 S E t N R~ Other Variables RobustIFragile
P I High: Base: Low: STDI High: Base: Low: GDC High: Base: Low: STDC High: Base: Low: STDI, STDC, E Fragile(0) E GDC. STDC, E Fragile* PI, STDC, E STDC STDI, E Fragile(1) STDI, STDC ST Dl, G DC, E Fragile* PI, STDI, GDC
The base R is the estimated coefficient from the regression with the variable of interest ( Z variable) and the always
included variables ( I variables).The I variables are INV, GPO, and H EC.The high R is the estimated coefficient from the regression with the extreme high bound (I3 +two standard deviations); the low I3 is the coefficient from the regression with the extreme lower bound. Z variable definitions: P I = inflation rate, STDI =standard deviation of rate of inflation, GDC = growth rate of domestic credit, STDC =standard deviation of domestic credit growth.The other variables are the X vari- ables included in the base regression that produce the extreme bounds.The RobustrFragile column indicates whether the variable of interest is robust or fragile. I f fragile, the number in parentheses indicates how many additional variables need to be added before the variable is insignificant or of the wrong sign.The underlined variables are the minimum additional variables that make the coefficient of interest insignificant or change sign.
'Indicates that the variable of interest is insignificant a t 0.05 significance level in the base regression.
Table 7 examines the relationship between growth and measures of monetary policy in Turkey during 1968-1998. None of the indicators is robustly correlated with growth (see Table 7). The infla- tion coefficient is negative and significant in the base regression but changes sign and becomes insignificant when the conditioning information set is altered. The differences inj3s rather than the differences in$-bounds are also examined and the coefficient of inflation becomes robust when the dependent variable is the growth rate of real GDP per capita. Both coefficients of STDI and STDC are insignificant in the base regression and there exists no significant relationship between STDI and growth or STDC and growth. The growth rate of domestic credit stock is positive and signifi- cant in the base regression but becomes negative and insignificant when the conditioning set is altered (e.g., by adding STDC). In fact, STDC is positive and insignificantly correlated with growth. Thus, both are fragile.
Table 8 provides the EBA of the monetary variables using the housing investment share as the dependent variable. Inflation enters with a positive and significant coefficient when the dependent variable is the share of housing investment but changes sign or fails to be significant when the condi- tioning set is altered. There exists a negative and significant correlation between investment and STDI, but it is not robust. When the differences in $s rather than the differences in $-bounds are examined, STDI becomes robust at a 10% significance level. In addition, the coefficient on GDC is positively and significantly correlated with the share of housing investment in the base regression but becomes negative when the regression is run with the different combinations of the conditioning set
Table 8. Sensitivity Results for Monetary Variables (Dependent Variable: Investment Share)
- - -
Z Variable I3 SE t N R2 Other Variables RobusVFragile
P I High: Base: Low: STDI High: Base: Low: GDC High: Base: Low: STDC High: Base: Low: STDC, E Fragile(1) STDI,STDC. E PI, GDC Fragile(1) GDC, STDC, E STDC, E Fragile(1)
STDI.
STDC, E E Fragile(1) STDI, G DC, EThe base R is the estimated coefficient from the regression with the variable of interest ( Z variable). When the dependent
variable is the investment share, no I variables are included.The high R is the estimated coefficient from the regression with
the extreme high bound ( 8 + two standard deviations); the low I3 is the coefficient from the regression with the extreme lower bound. Z variable definitions: P I = inflation rate, STDI = standard deviation of rate of inflation, GDC = growth rate of domestic credit, STDD =standard deviation of domestic credit growth.The other variables are the X variables included in the base regression that produce the extreme bounds.The RobusVFragile column indicates whether the variable of inter- est is robust or fragile. I f fragile, the number in parentheses indicates how many additional variables need to be added before the variable is insignificant or of the wrong sign.The underlined variables are the minimum additional variables that make the coefficient of interest insignificant or change sign.
* Indicates that the variable of interest is insignificant at 0.05 significance level in the base regression.
(e.g., by adding STDI). Moreover, STDC enters with a positive and significant coefficient in spite of being fragile.
As indicated in Tables 7 and 8, among the narrow set of various monetary variables, the growth rate of domestic credit is significant to both growth and investment. However, it changes sign or fails to be significant with different sets of variables; thus it is fragile. In fact, an increase in the growth rate of domestic credit stock was not able to provide a determined path for the economy since the rise in credits was not used efficiently in the production.
Given the wide array of growth determinants and econometric specifications, the empirical literature on economic growth still lacks standard models fitting all the cases. Especially for the developing countries due to their fragile socioeconomic environment, finding a reliable and independent rela- tionship between various macroeconomic variables and growth becomes difficult. In this context, this paper evaluates the robustness of the correlation between per capita growth rates and selected macroeconomic indicators for the developing economy of Turkey during 1968-1998. The paper examines the sensitivity of the growth regressions by using the EBA, which provides information on the reliability of various variables.
Within this framework, very few economic variables of Turkey are found to be robustly corre- lated with growth rates or the share of investment in GDP There exists a positive and robust corre- lation between growth and the human capital indicator; that is, high-school enrolment rate and growth. Moreover, when the differences in$s rather than$-bounds are examined, the results indicate a positive and robust correlation between growth and the share of housing investment and a negative and robust link between inflation rate and growth. The relationship between standard deviation of inflation and the share of housing investment is also negative and robust.
INVESTIGATION ON SOURCES OF GROWTH FOR TURKEY 37
Moreover, none of the fiscal (share of expenditure in GDP and share of deficit in GDP) and trade (share of imports in GDP, real exchange rate, a n d share of exports in GDP) variables studied is robustly correlated with growth and the investment share.
Overall, the lack of productive and efficient investments plays a certain role in the unstable and volatile growth rates of the Turkish economy in addition t o high inflation rates and deteriorated fiscal balances. Actually, it seems that the most important tool in reaching sustainable growth rates is investment i n human capital. Although trade and financial liberalization are the two important turn- ing points in the economy, neither exports n o r extended credits due t o financial deepening has a significant role in the growth path of the economy.
Baldwin, R.E. and E. Seghezza (1996) "The New Growth Theory: Its Logic and Trade Policy Implications," paper presented at the Trade Research Consortium Meetings, Washington, DC, December.
Balkan, E. and E. Yeldan (1998) "Financial Liberalization in Developing Countries: The Turkish Experience," in R. Medhora and J. Fanelli (eds.) Financial Reform in Developing Countries, New York: Palgrave Macmillan. Barro, R. (1991) "Economic Growth in a Cross Section of Countries," Quarterly Journal of Economics 106:2,
407-43.
.
(1990) "Government Spending in a Simple Model of Endogenous Growth," Journal of Political Economy 98:5,103-25..
(1989) "A Cross-Country Study of Growth, Saving, and Government," NBER Working Paper No. 2855, National Bureau of Economic Research (NBER), Cambridge, MA..
(1976) "Rational Expectations and the Role of Monetary Policy" Journal of Monetary Economics 2:l-32. Boratav, K . and 0. Turel (1993) "Turkey," in L. Taylor (ed.) The Rocky Road to Reform, Cambridge, MA andLondon: MIT Press.
Boratav, K., 0. Turel, and E. Yeldan (1996) "Dilemmas of Structural Adjustment and Environmental Policies under Instability: Post-1980 Turkey," World Development 24:2,373-93.
.
(1995) "The Turkish Economy in 1981-1992: A Balance Sheet, Problems and Prospects," Middle East Technical University (METU) Studies in Development 22:l-36.Bruno, M. and W. Easterly (1993) "Inflation Crises and Long-Run Growth:'Journal of Monetary Economics 41:1, 3-26.
Celasun, M. (1994) "Trade and Industrialization in Turkey: Initial Conditions, Policy and Performance in the 1980s:' in G.K. Helleiner (ed.) Trade Policy and Industrialization in Turbulent Times, London: Routledge. Celasun, M. and D. Rodrik (1989) "Debt, Adjustment and Growth: Turkey," in J. Sachs and S.M. Collins (eds.)
Developing Country Debt and Economic Performance: Country Studies
-
Indonesia, Korea, Philippines, Turkey, Vol. 3, Book IV, Chicago: University of Chicago Press, 615-808.Diamond, J. (1989) "Government Expenditure and Economic Growth: An Empirical Investigation," IMF Working Paper No. 89/45, International Monetary Fund, Washington, DC.
Durlauf, S. and D. Quah (1998) "The New Empirics of Growth," NBER Working Paper No. 6422, National Bureau of Economic Research (NBER), Cambridge, MA.
Easterly, W. and S. Rebelo (1993) "Fiscal Policy and Economic Growth: An Empirical Investigation," Journal of Monetary Economics 32:3,417-58.
Ekinci, N. (1998) "Turkiye Ekonomisinde Buyume ve Kriz Dinamikleri," Toplum ve Bilim 77 (Summer): 7-27. Ertugrul, A. and E Selcuk (2001) "A Brief Account of the.Turkish Economy: 1980-2000," forthcoming in Russian
and East European Finance and Trade 37:6,6-30.
Fischer, S. (1993) "The Role of Macroeconomic Factors in Growth," Journal of Monetary Economics 32:3, 485-512.
Friedman, M. (1977) "Inflation and Unemployment," Journal of Political Economy 85:3,451-72.
Grier, K. and G. Tullock (1989) "An Empirical Analysis of Cross-National Economic Growth, 1951-80," Journal of Monetary Economics 24:2,259-76.
Grossman, G. and E. Helpman (1990) "Trade, Innovation, and Growth," American Economic Review: Papers and Proceedings 80:2,86-91.
Hayek, F.k (1944) The Road to Serfdom, Chicago: University of Chicago Press. Kepenek, Y. and N. Yentiirk (2000) Turkish Economy, Istanbul: Remzi Kitabevi.
Kormendi, RC. and PC. Meguire (1985) "Macroeconomic Determinants of Growth: Cross-Country Evidence," Journal of Monetary Economics 16:2,141-63.
Learner, E.E. (1985) "Sensitivity Analyses Would Help,"American Economic Review 75:3,308-13.
.
(1983) "Let's Take the Con Out of Econometrics."American Economic Review 73:1,31-43.Leamer, E.E. and H. Leonard (1983) "Reporting the Fragility of Regression Estimates," Review of Economics and Statistics 652,306-17.
Levine, R and D. Renelt (1992) "A Sensitivity Analysis of Cross-Country Regressions," American Economic Review 82:4,942-63.
.
(1991) "Cross-Country Studies of Growth and Policy: Some Methodological, Conceptual, and Statistical Problems," World Bank Working Paper Series, No. 608, Washington, DC: World Bank.Mankiw, N.G., D. Romer, and D.N. Weil(1992) "A contribution to the empirics of economic growth," Quarterly Journal of Economics 107:2,407-37.
Metin, K. (1995) "An Integrated Analysis of Turkish Inflation:' Oxford Bulletin of Economics and Statistics 574, 513-31.
Metin-Ozcan K., E. Voyvoda, and E. Yeldan (2001) "Dynamics of Macroeconomic Adjustment in a Globalized Developing Economy: Growth, Accumulation and Distribution, Turkey 1969-1999," Canadian Journal of Development Studies 22:1,219-53.
Ram, R. (1985) "Exports and Economic Growth: Some Additional Evidence," Economic Development and Cultural Change 33:2,415-25.
Rivera-Batiz, L. and P Romer (1991) "Economic Integration and Endogenous Growth," Quarterly Journal of Economics 106:2,531-55.
Romer, P (1990) "Endogenous Technological Change,"Journal of Political Economy 98:5,71-103.
.
(1989) "Human Capital and Growth: Theory and Evidence," NBER Working Paper No. 3173, National Bureau of Economic Research (NBER), Cambridge, MA..
(1986) "Increasing Returns and Long-Run Growth,"Journal of Political Economy 945,1002-37. Sala-i-Martin, X. (1997) "I Just Ran Two Million Regressions," American Economic Review: Papers andProceedings 87:2,178-83.
Selcuk, F. (1997) "Consumption Smoothing and Current Account: Turkish Experience, 1987-1995," METU Studies and Development 244,519-30.
Senses, F. (1994) "The Stabilization and Structural Adjustment Program and the Process of Turkish Industrialization: Main Policies and Their Impact," in F. Senses (ed.) Recent Industrialization Experience of Turkey in a Global Context, Westport, CT Greenwood Press, 51-73.
.
(1990) "An Assessment of the Pattern of Turkish Manufactured Export Growth in the 1980's and its Prospects," in T. Aricanli and D. Rodrik (eds.) The Political Economy of Turkey, New York: Palgrave Macmillan, 60-71..
(1989) 1980 Sonrasi Ekonom' Politikalarinin Ztginda Tiirkiye'de Sanayile~me, Ankara: V Yainlari. Yentiirk, N. (1999) "Short-term Capital Inflows and their Impact on Macroeconomic Structure: Turkey in the1990s," The Developing Economies 37:1,89-113.